ITP19 Data Processing
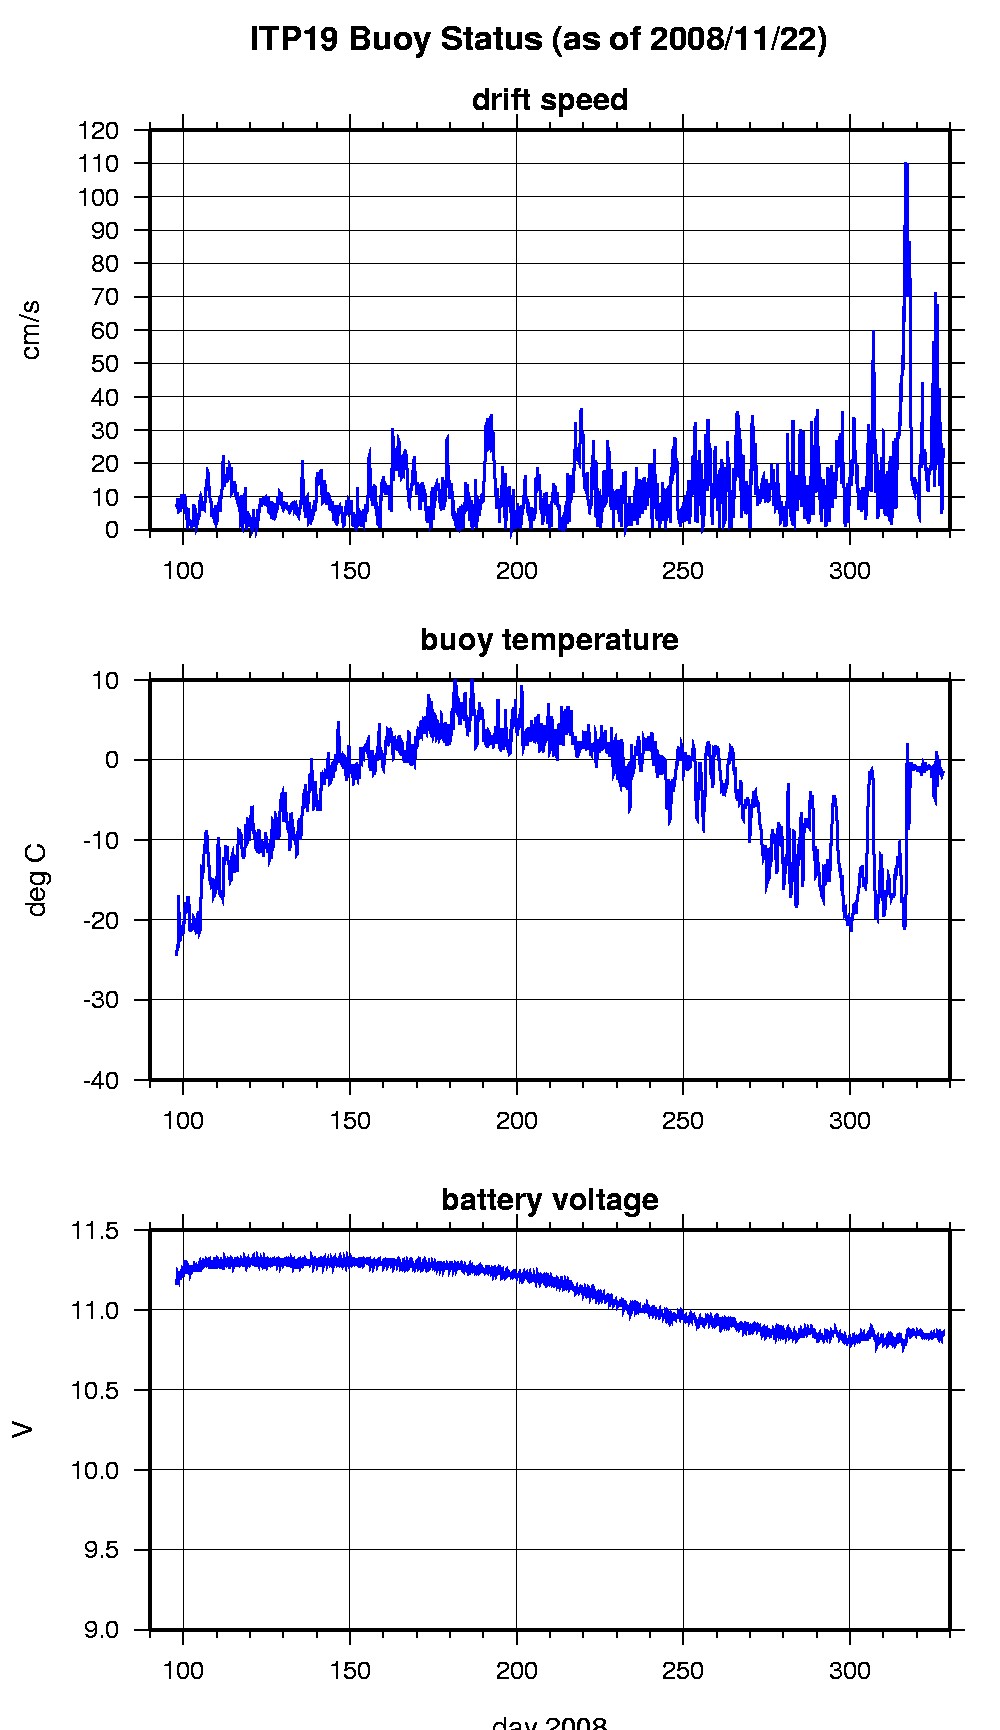
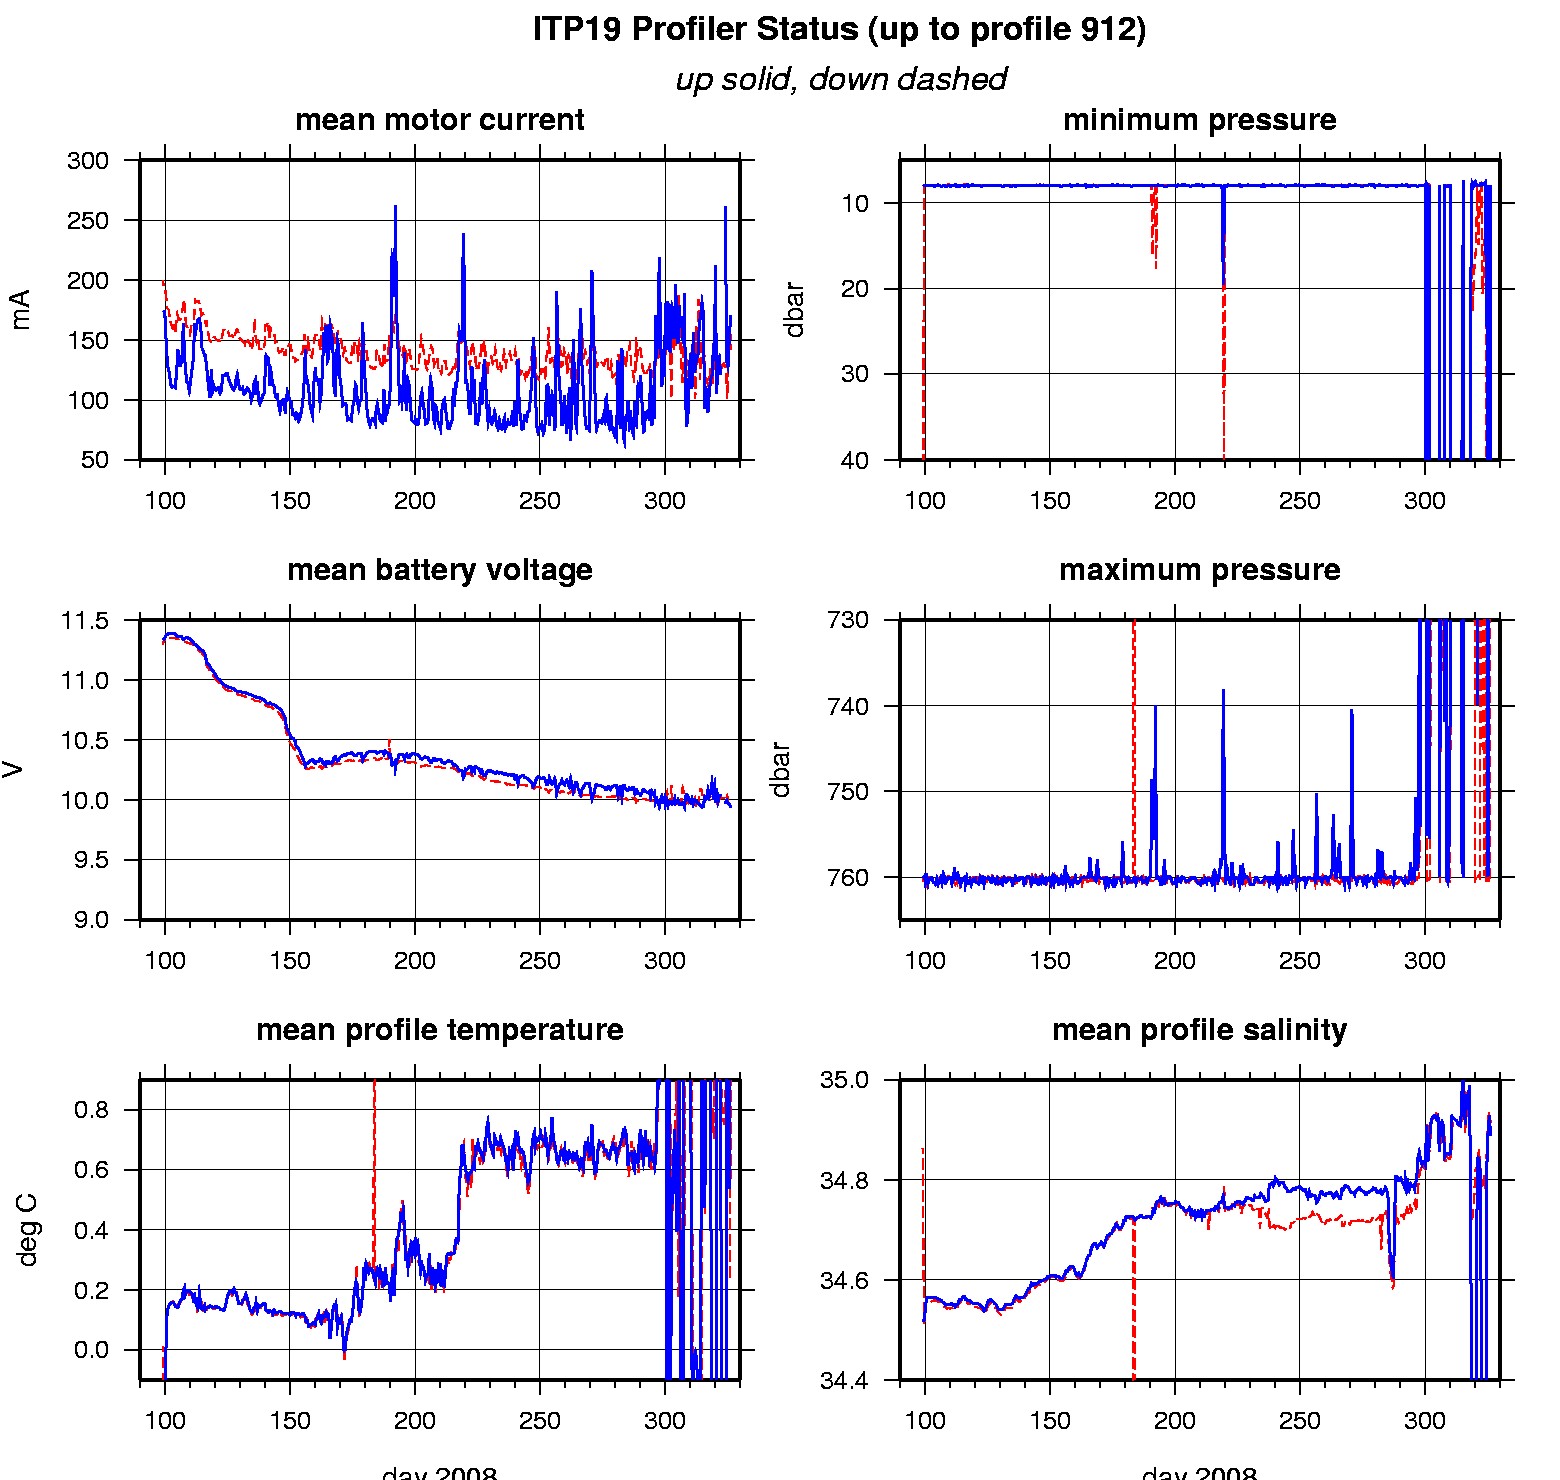
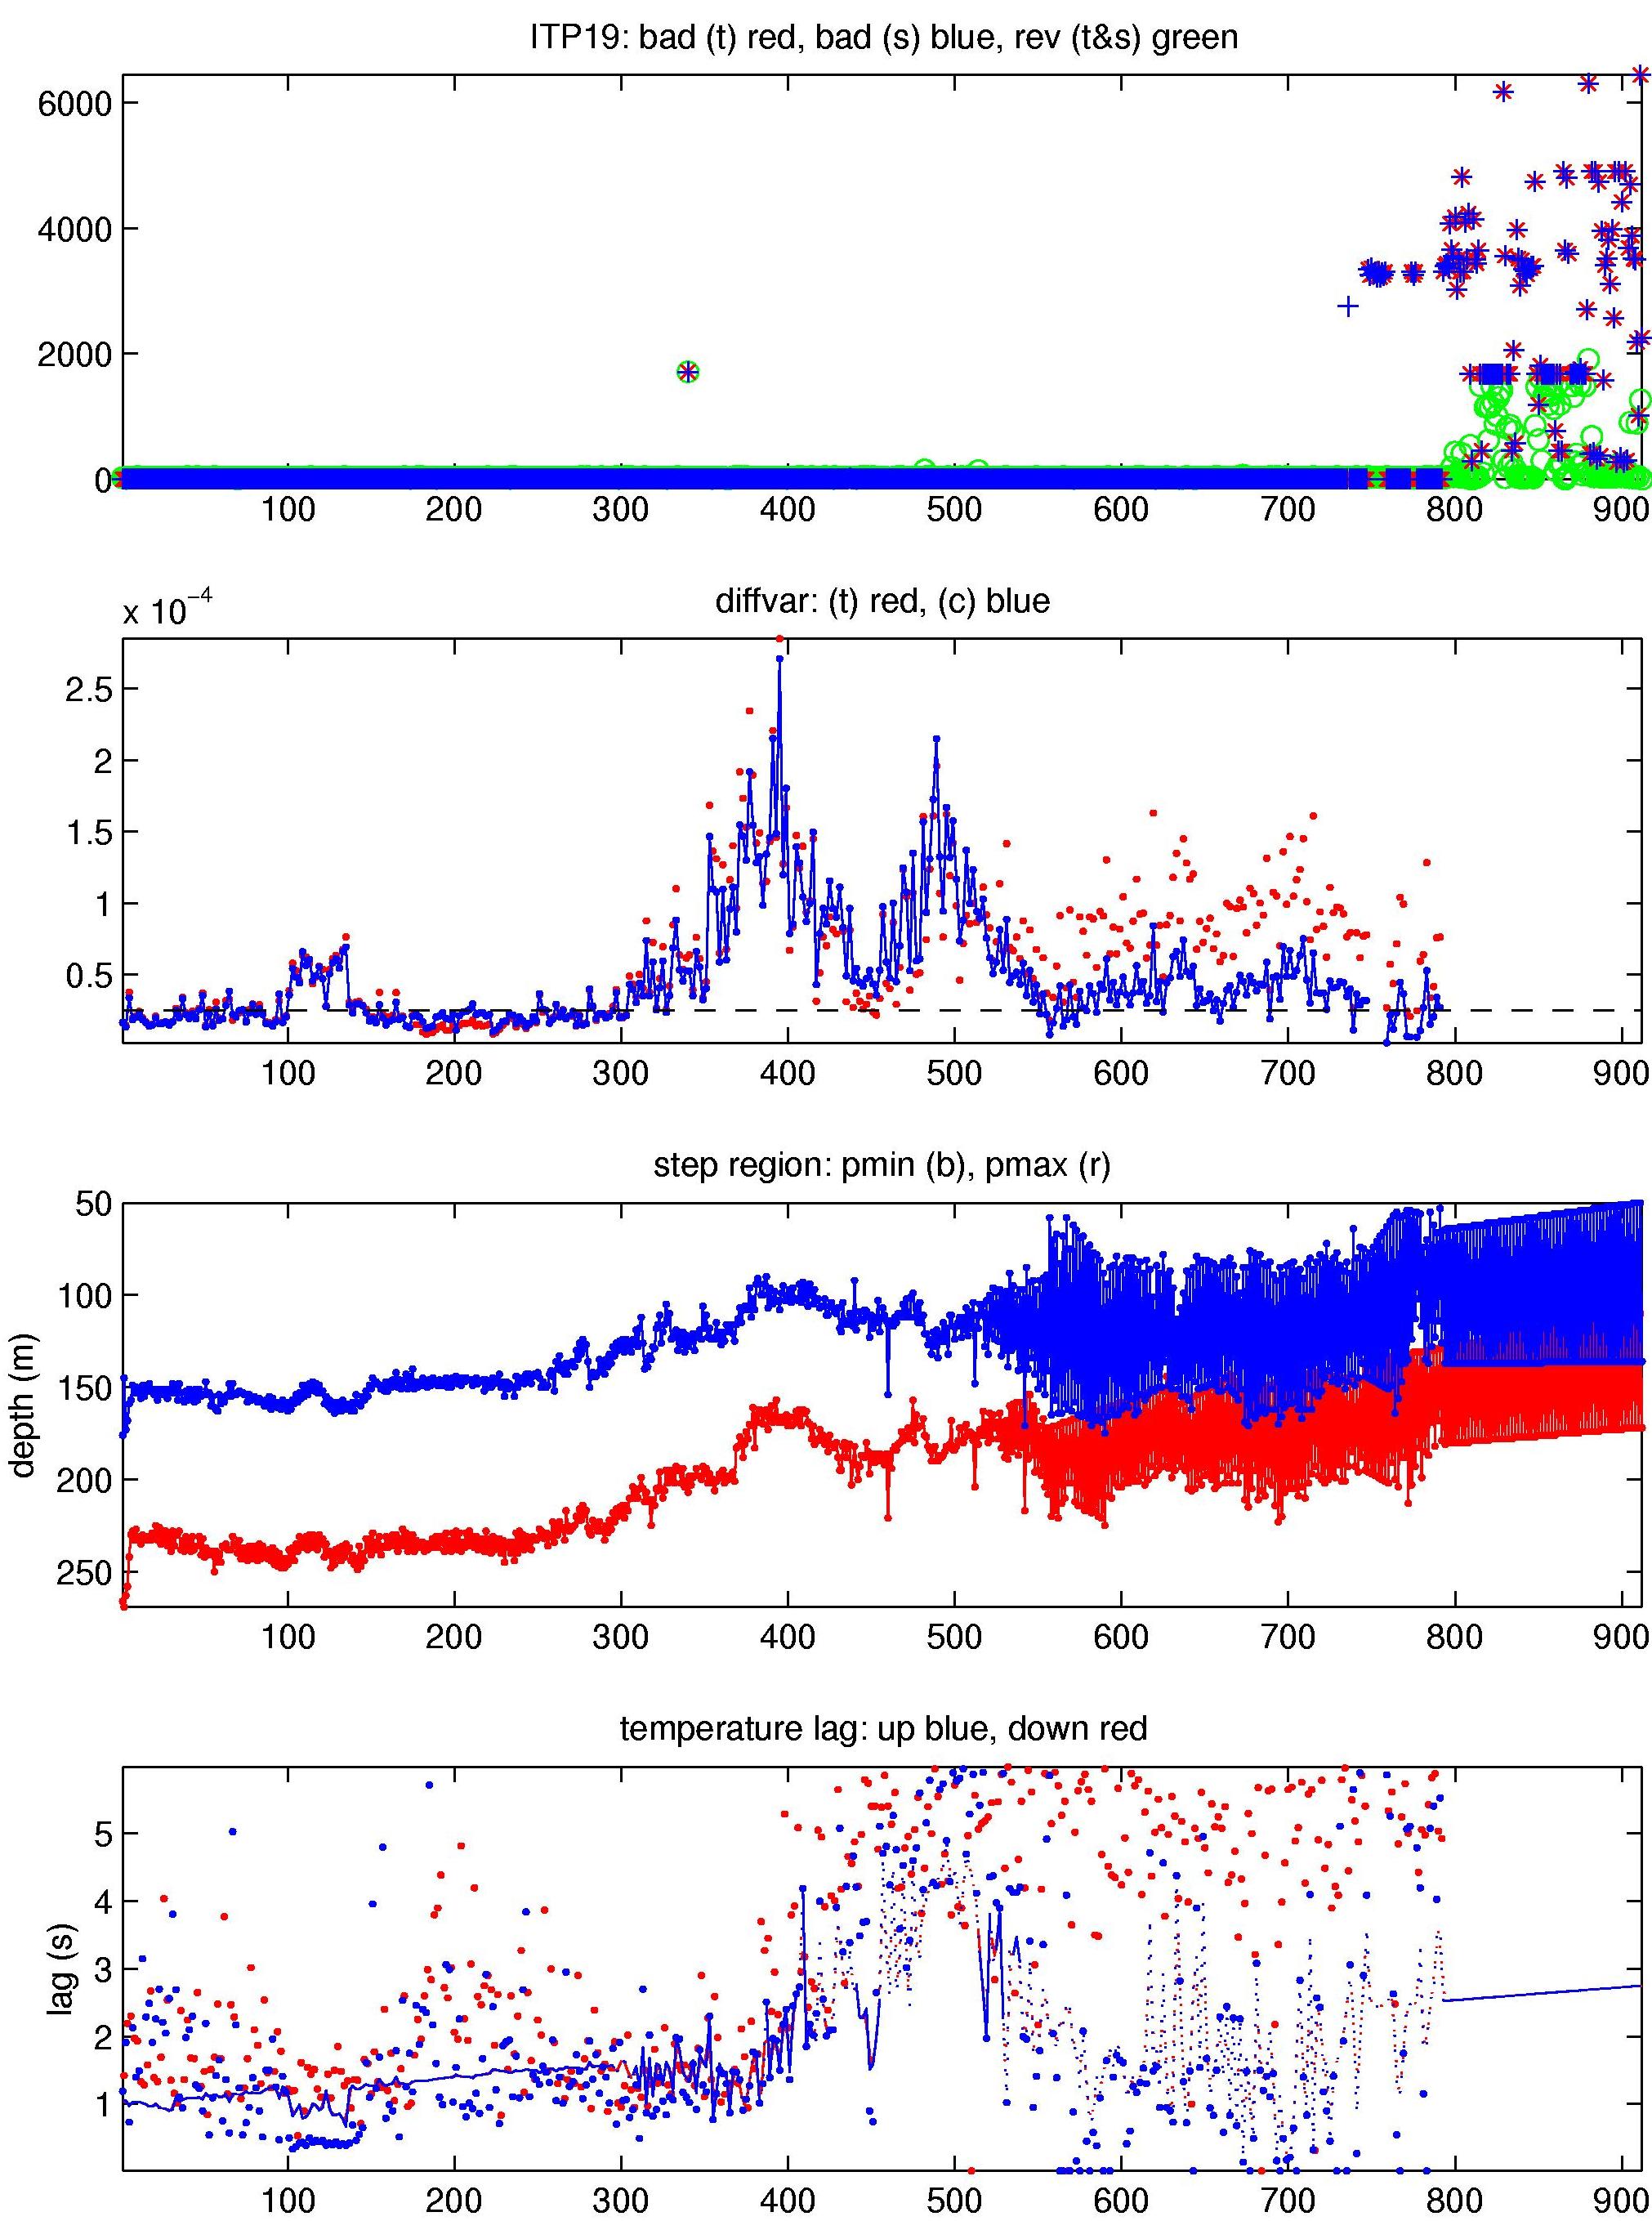
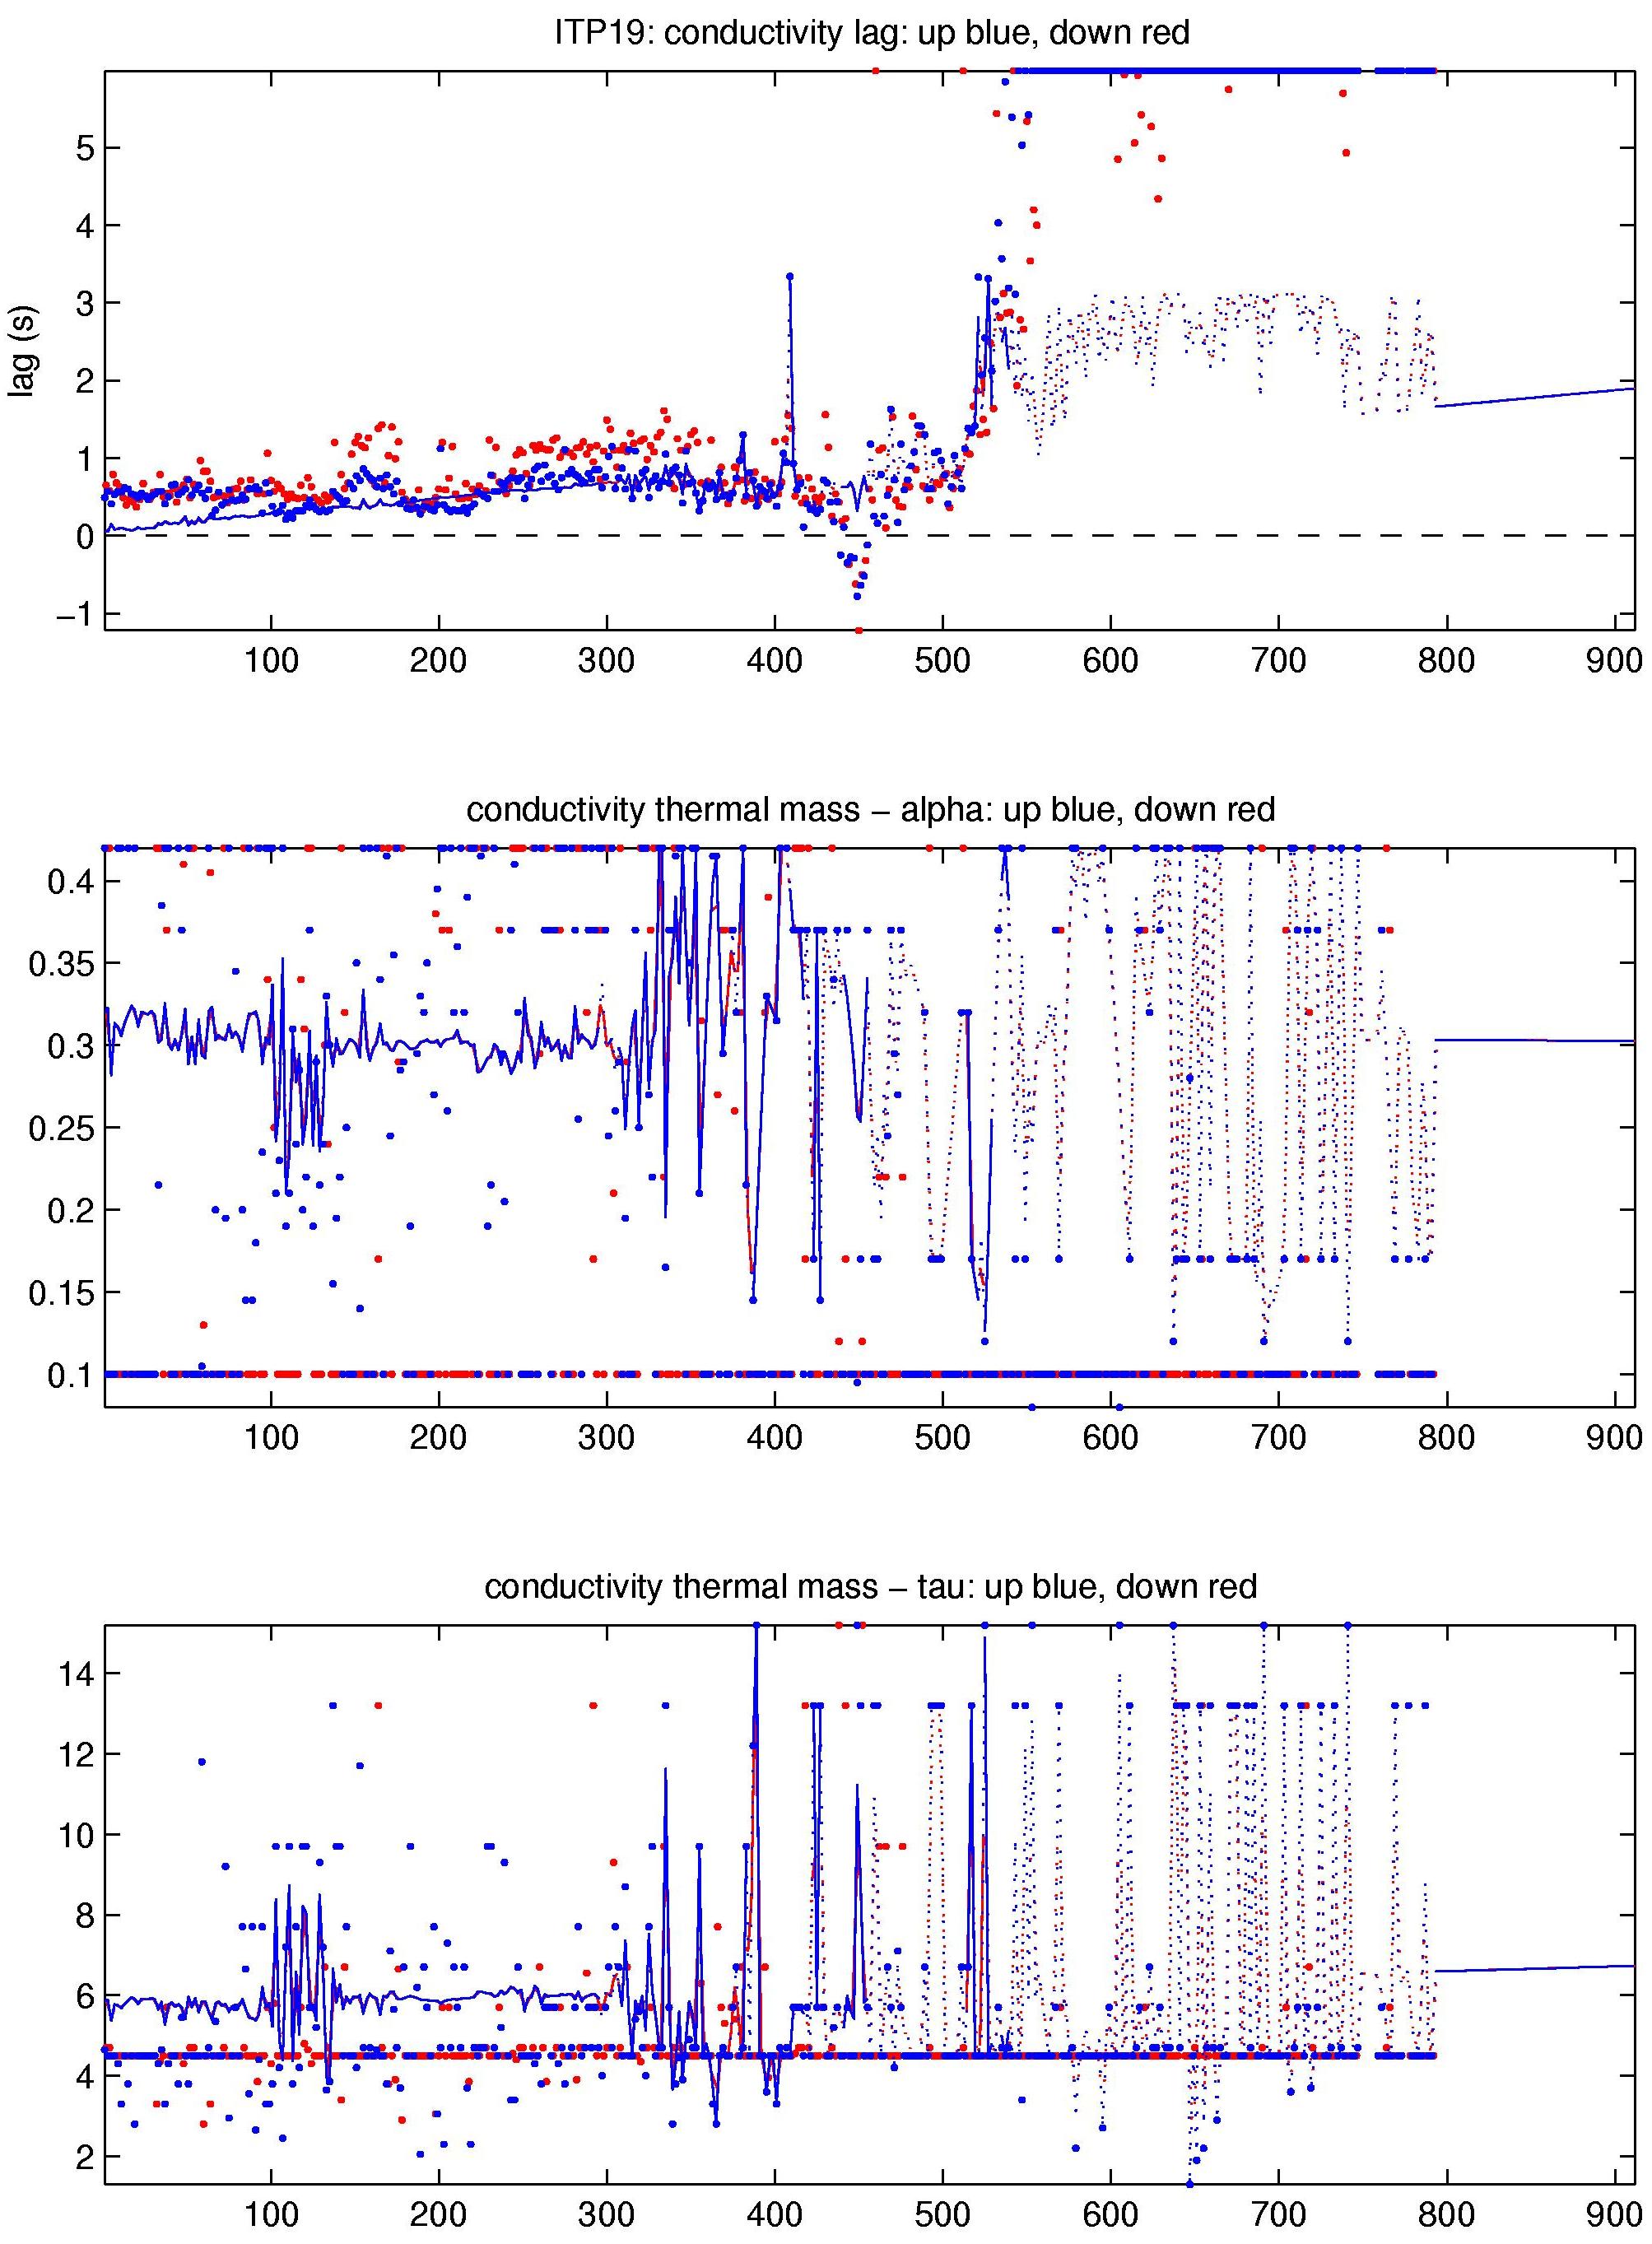
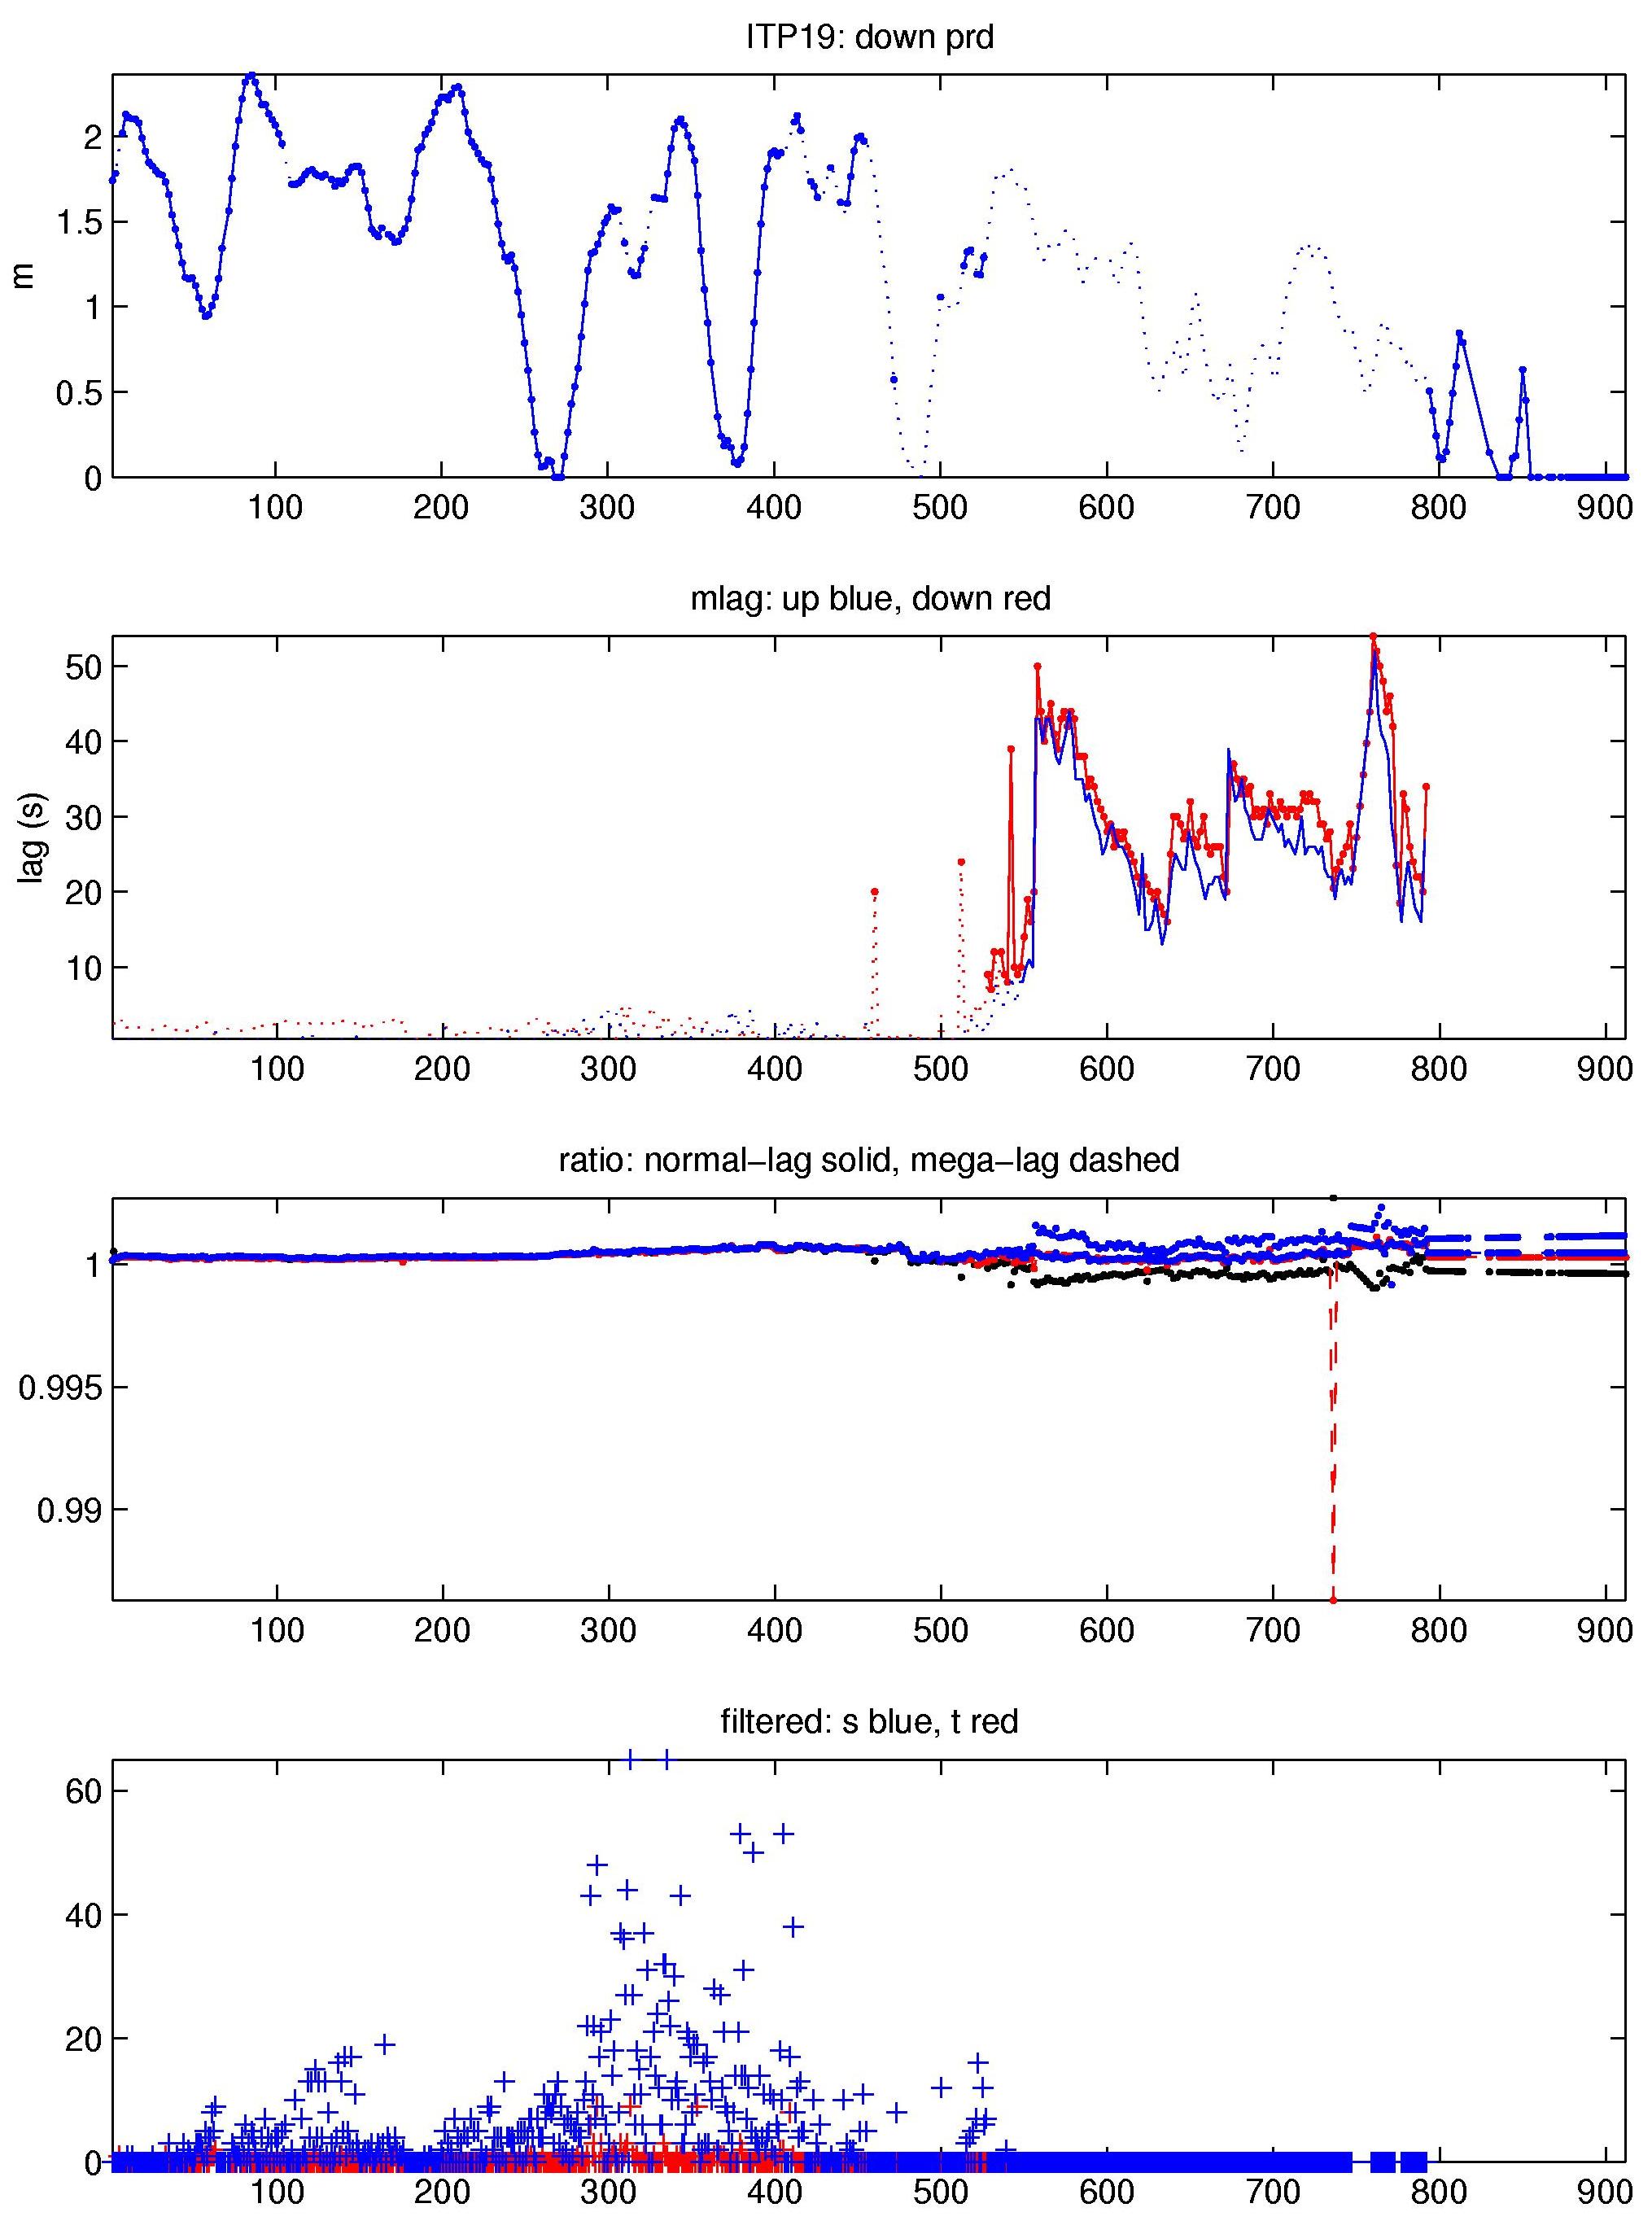
The 912 profiles that were recovered from the ITP were processed according to the procedures described in the ITP Updated Data Processing Procedures. The processing parameters for ITP 19 are shown in the figures to the right. Sensor lags were typical for the first 474 profiles (237 days) but became very large (more than 5 seconds). Mega-lag corrections were applied to compensate for the extreme fouling or pump failure at reduced quality and with residual up/down deviations beginning with profile 528. Profiles 748 to 758, 774 to 776 and those from 793 and above were beyond meaningful lag correction and were eliminated from the final product. A broken profiler spring (discovered when the system was recovered) and excessive drift speeds through and after Fram Strait hindered the profiler from climbing the wire against the drag in a number of profiles after 800.
See the Data Products tab to the left for descriptions of the three levels (I, II, III) of data processing and to access all data.
