ITP34 Data Processing
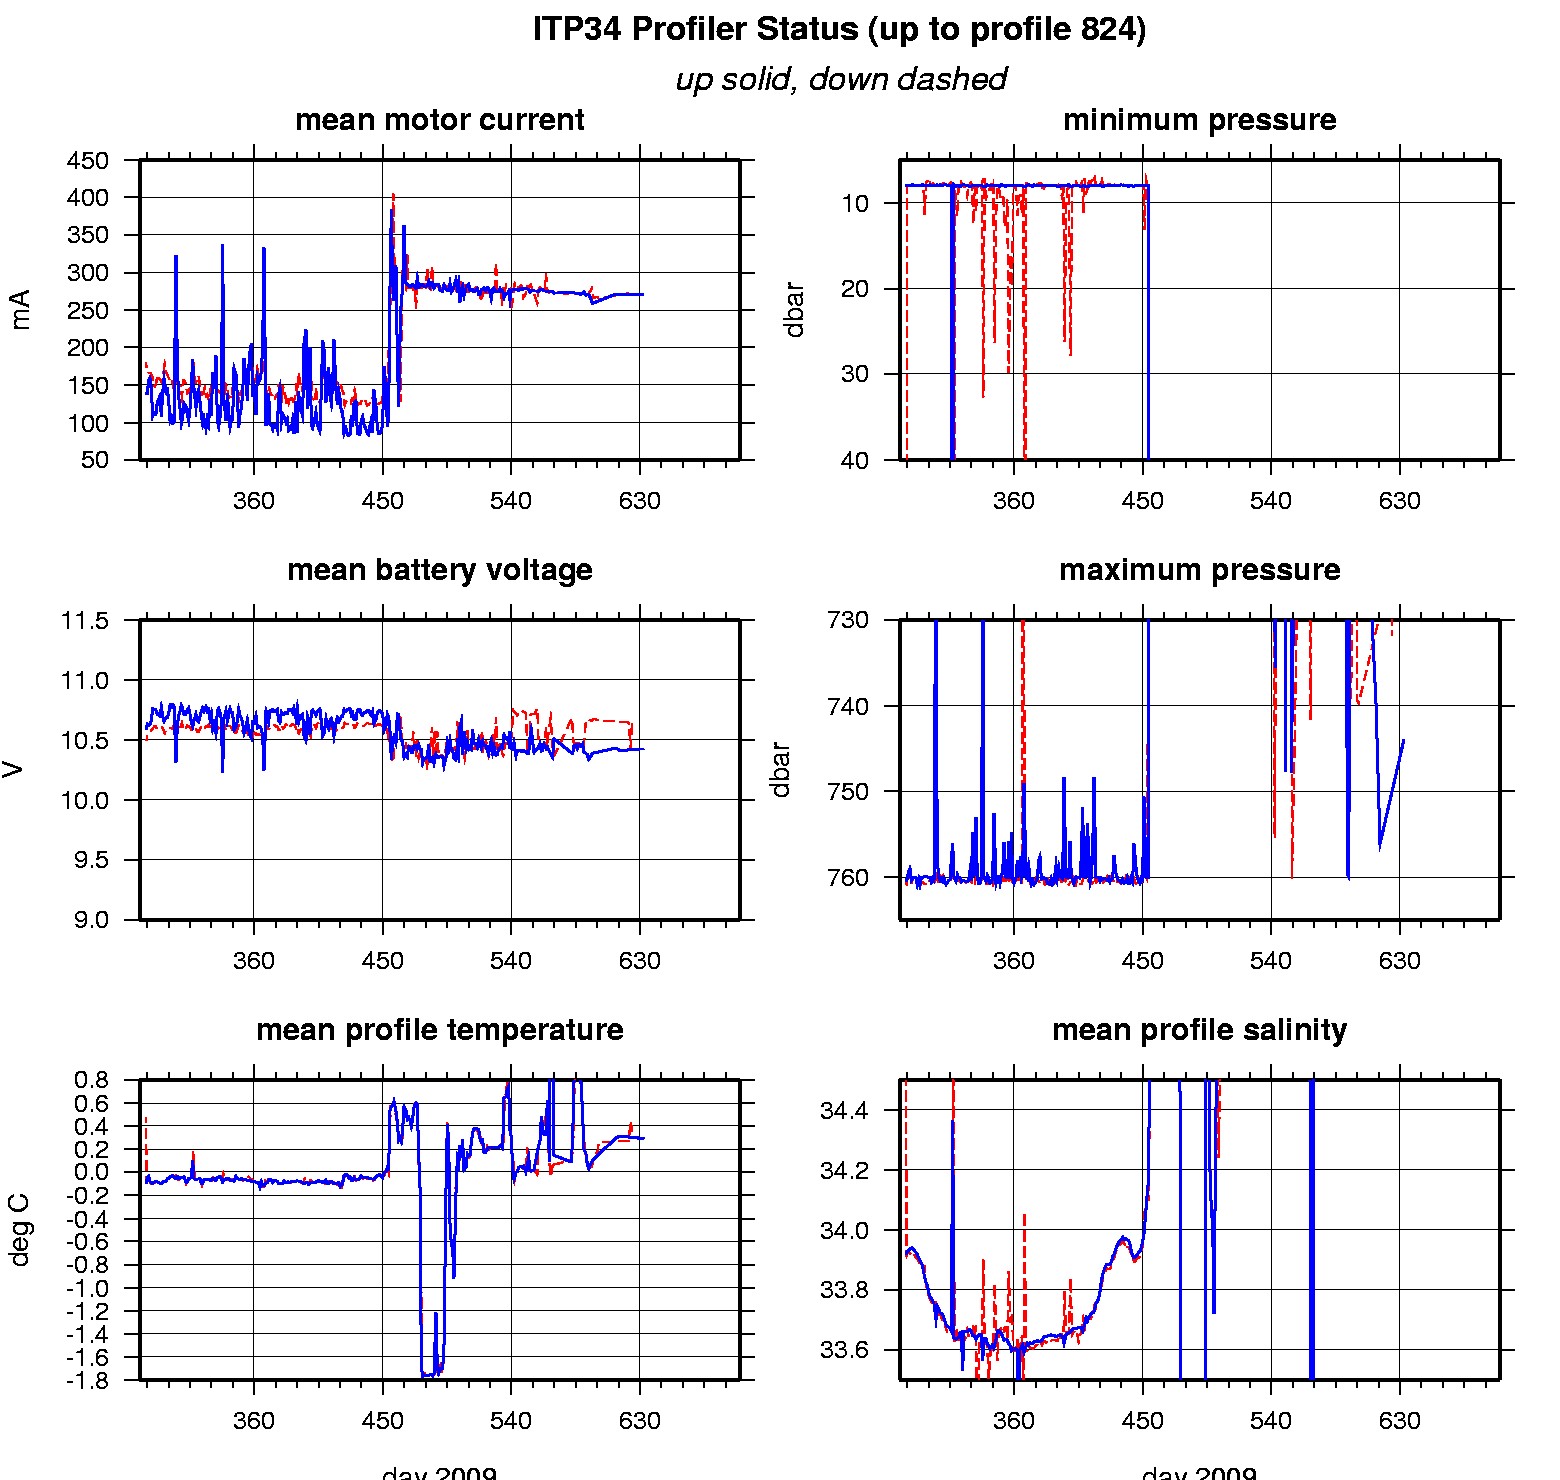
Following its deployment in October 10 2009, ITP34 transmitted 342 nearly flawless journeys up and down the wire until March 30, 2010. At that time, the profiler stopped crawling and continued to provide "point measurements" from single depths for another 482 profiles until the end of November 2010. Only the profiling portion of the record is included in the level 3 data set.
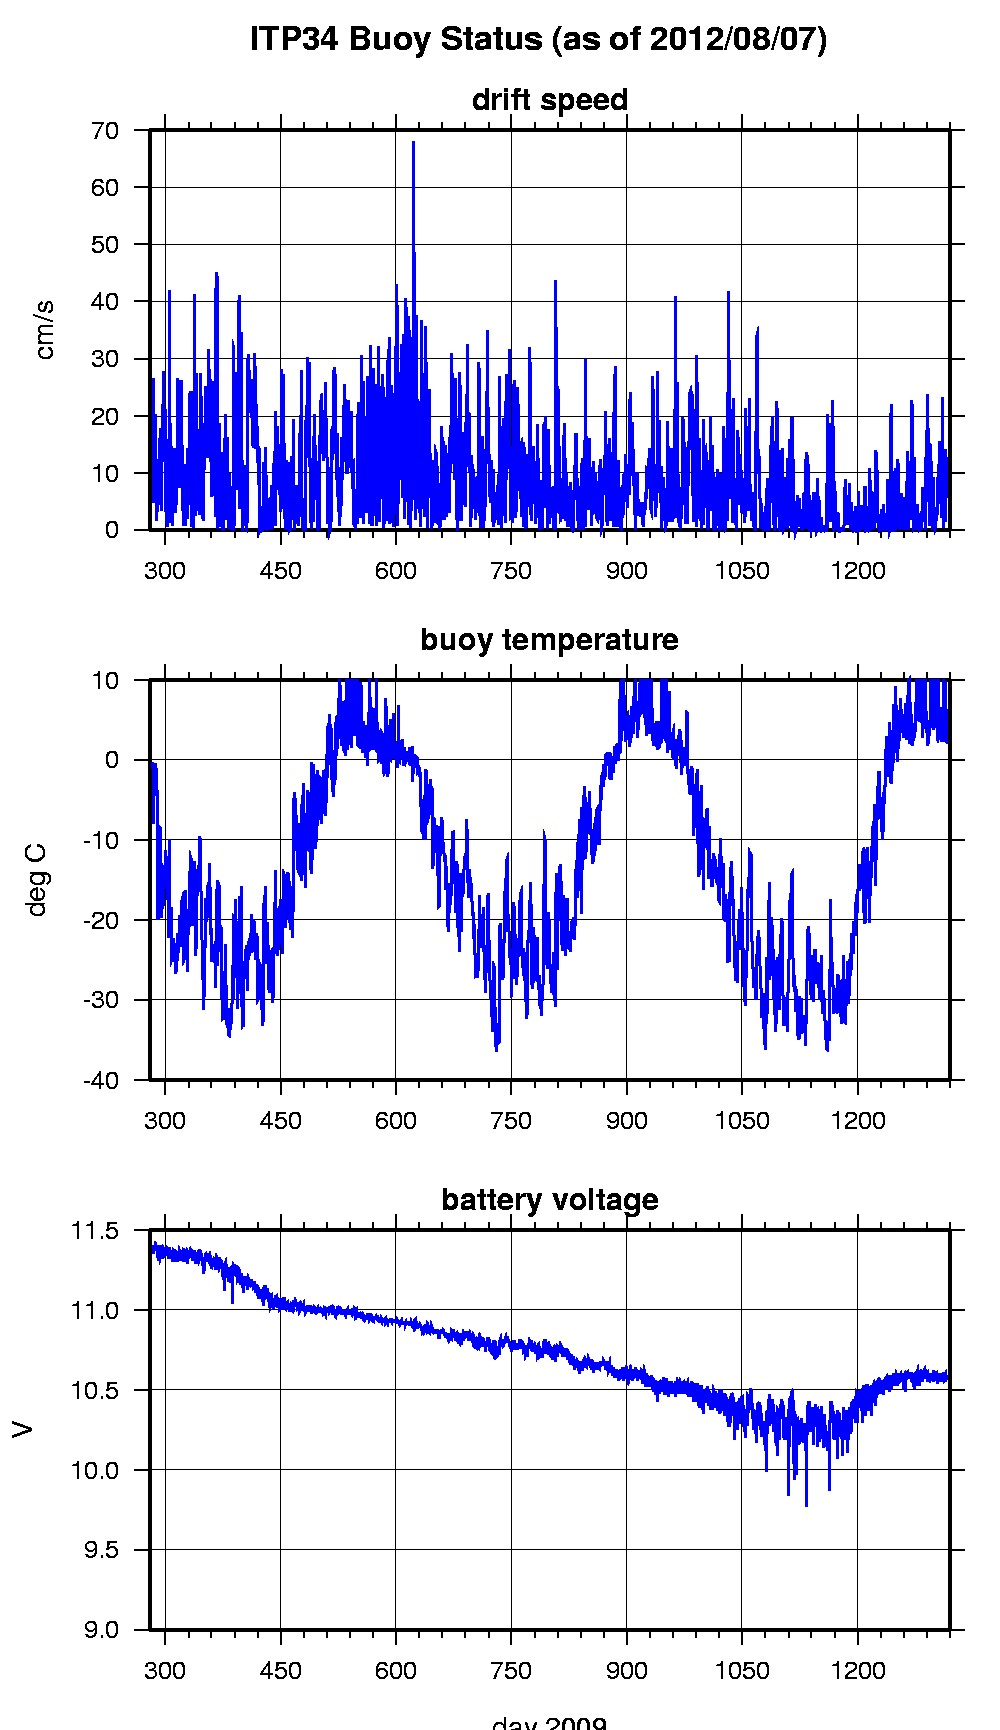
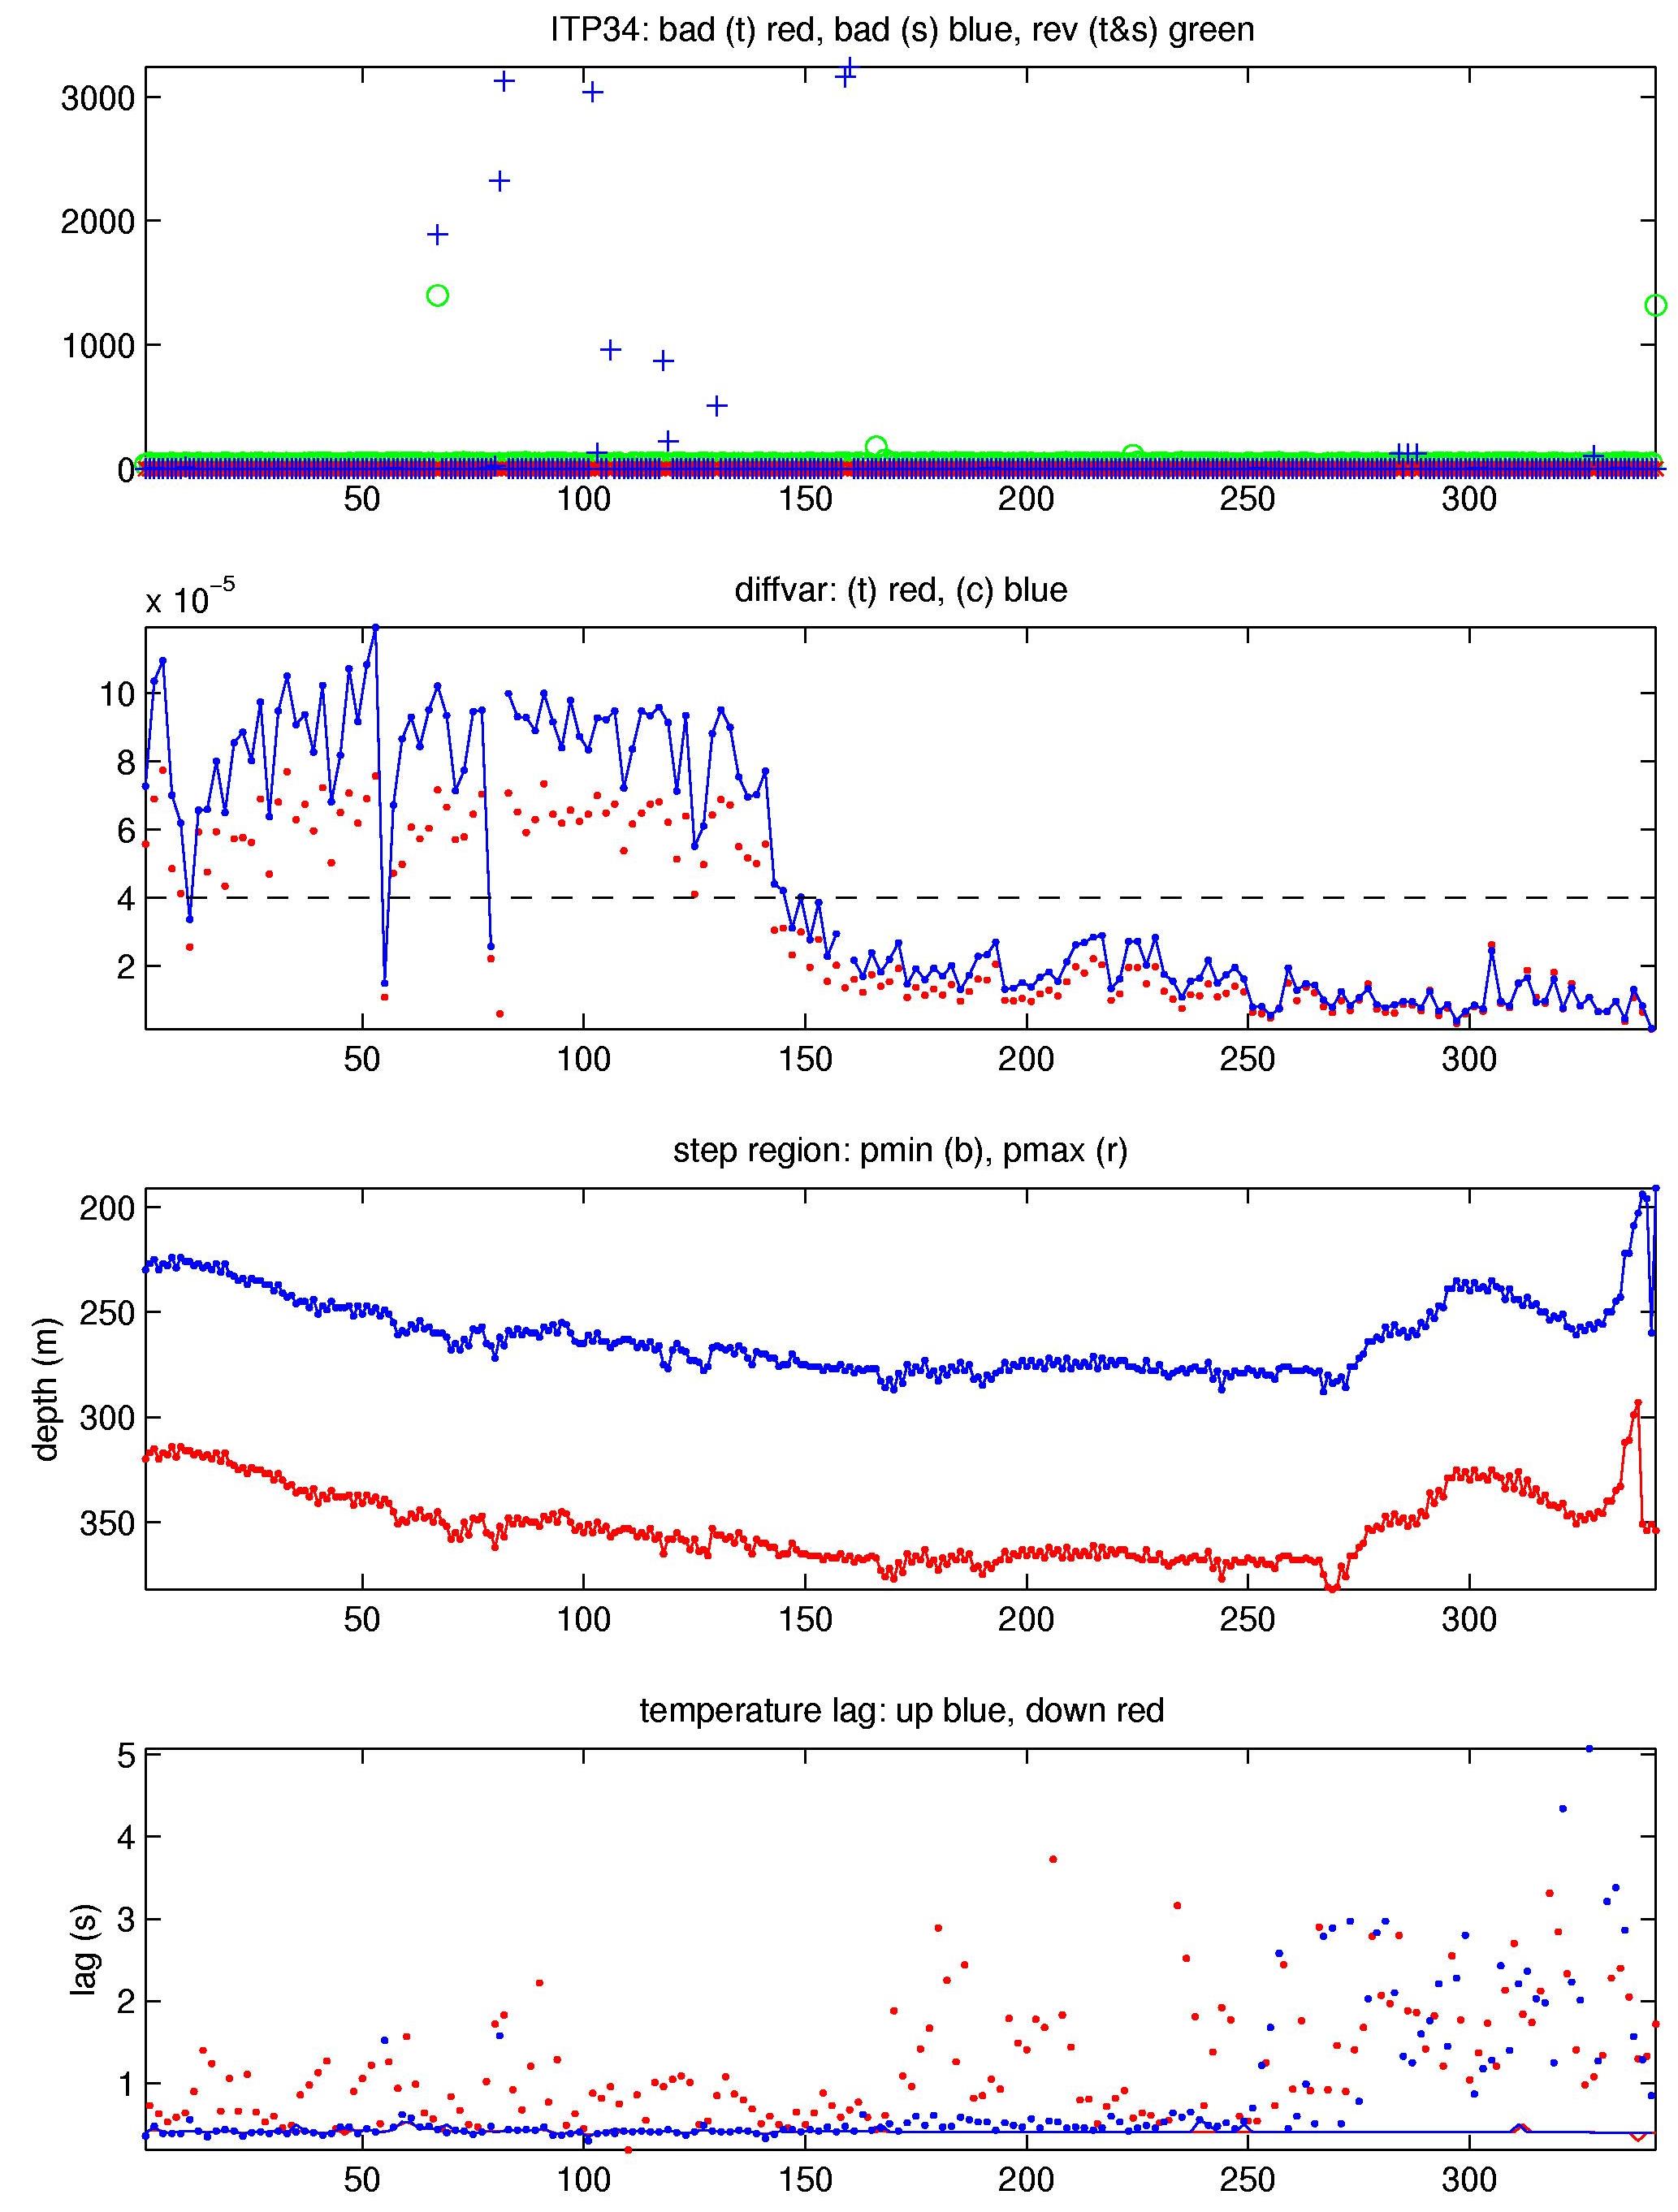
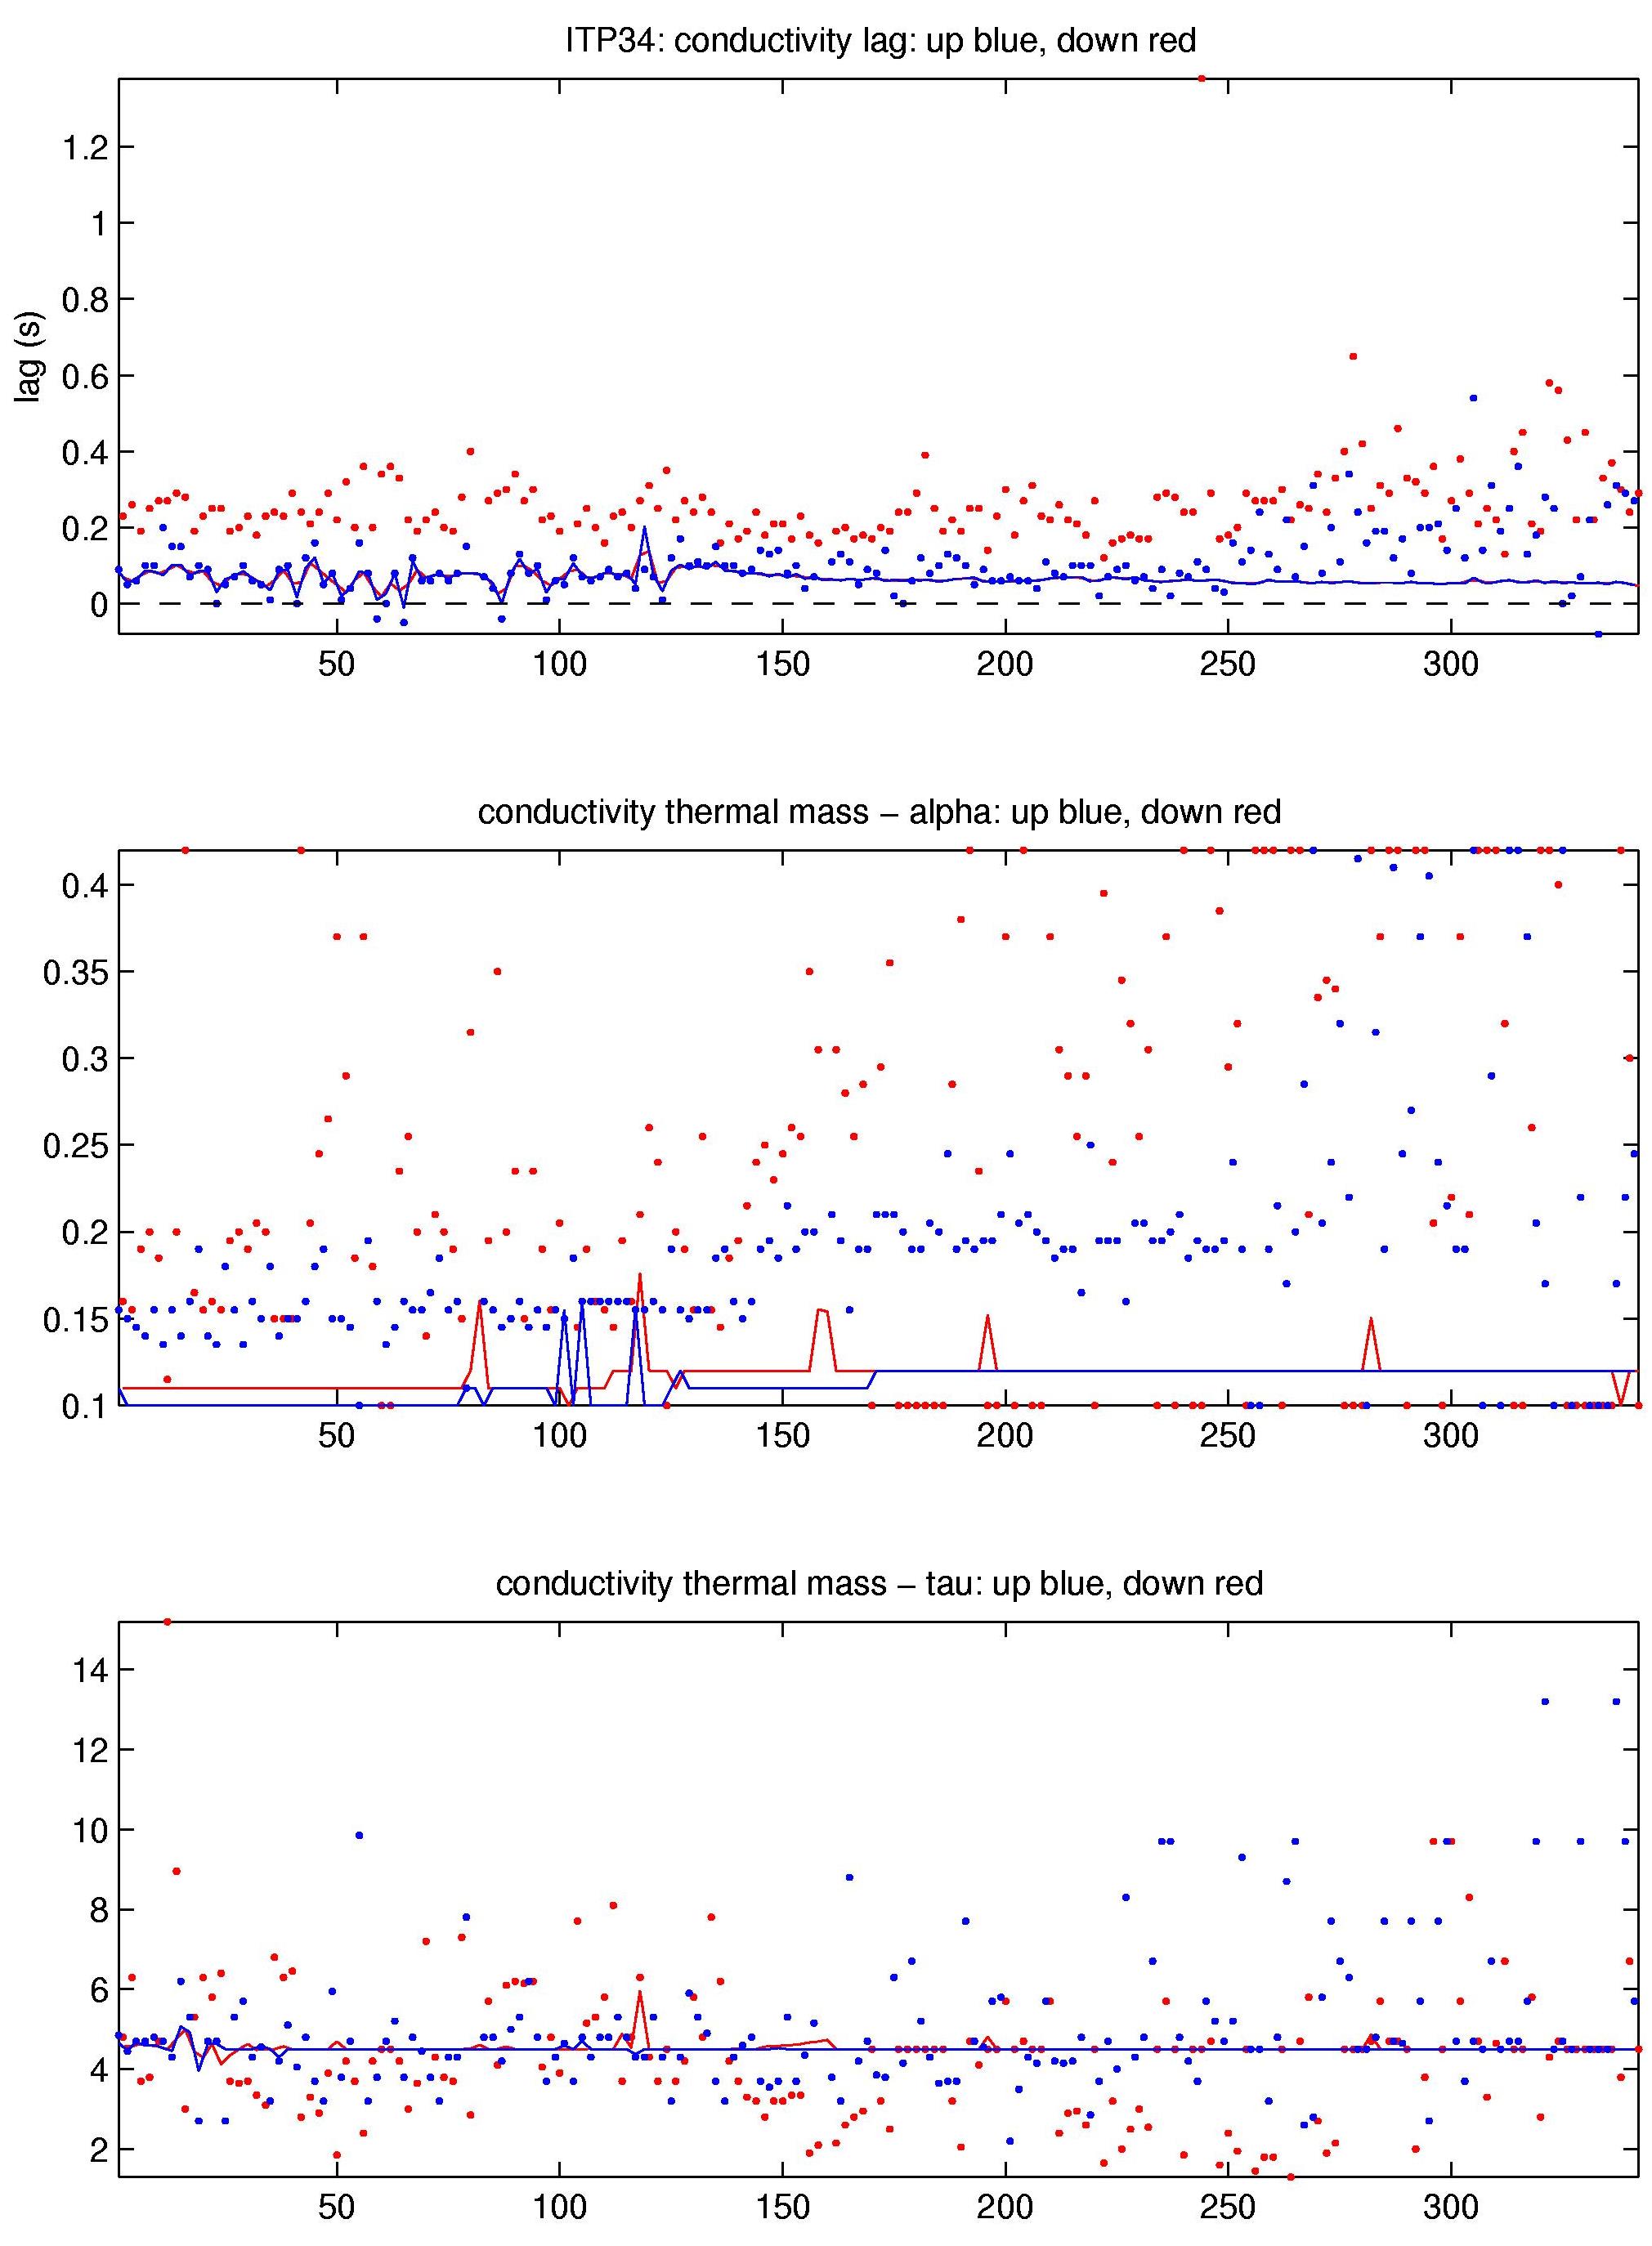
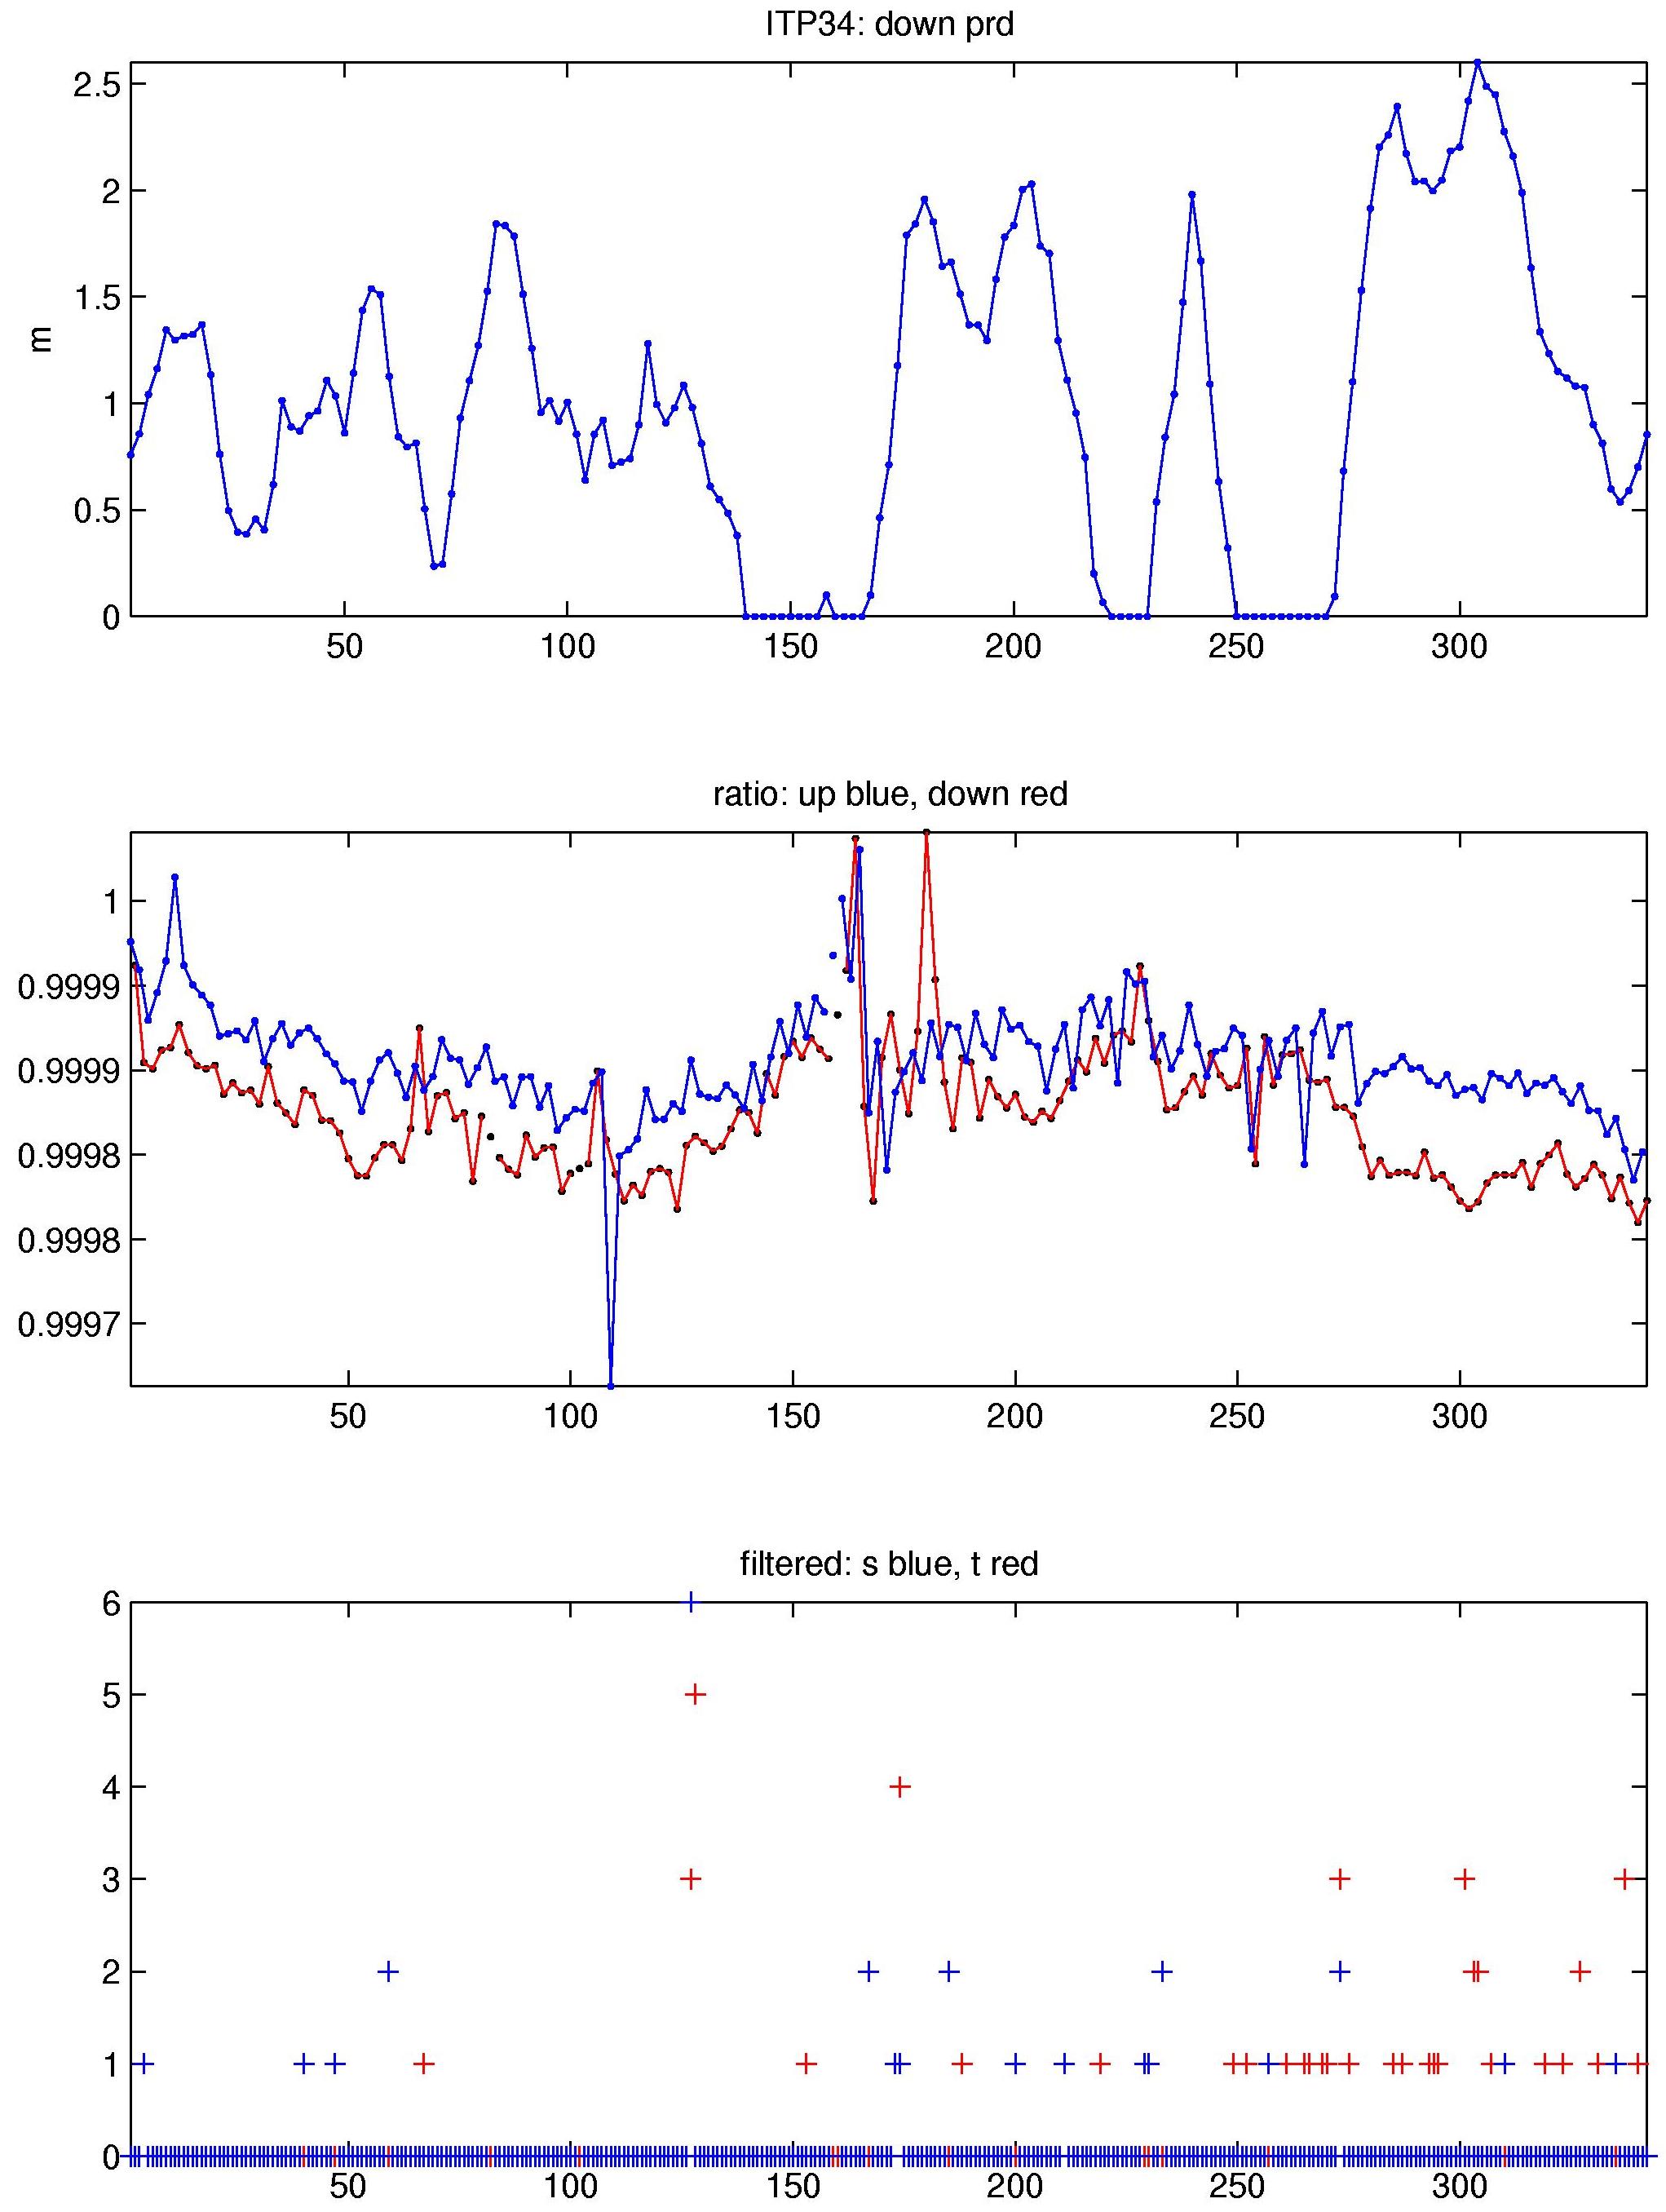
The data were processed according to the procedures described in the ITP Updated Data Processing Procedures. The processing parameters for this ITP are shown in the figures to the right. Buoy drift speeds stayed mostly between 10 and 20 cm/s, with a few isolated spikes exceeding 40 cm/s. As usual, some conductivity (salinity) data were affected by biofouling or similar glitches. However, they were relatively few here, most were short or even single bins, and none lasted over several profiles.
Well defined thermohaline staircases were present over the first half of the time series, enabling CTD lag corrections. The lags were in the typical range found for previous systems. During manual editing, thermal lag corrections were dialed back somewhat to remove overcompensation. The combination of Alpha = 0.11 and Tao = 4.5 worked well in most cases. For the remainder of the record, staircases became very small (in vertical extent) and frequently were absent. Previous settings were maintained here, though these profiles displayed less change when modifying alpha and tao. A few instances of the thermistor lag corrections ("tlag" in the code) were modified to better adjust sharp spikes at the top/bottom of stair cases. The conductivity - temperature time offsets ("cshift") were not modified from those calculated by the processing code.
The conductivity adjustment ("rat") remained fairly flat and close to unity for nearly the whole deployment, interrupted only by two short periods of larger adjustments for a small set of profiles ("rat spikes"). Presumably these adjustments were triggered by conductivity cell contaminations. Here, the spike extended over just one (profile 81) or two (profiles 159, 160) profiles. After inspecting both cases repeatedly, it was decided to wipe the complete profiles since the conductivity calibration appeared to change over the course of the profile; i.e., adjusting to deep TS left shallower portions as outliers.
See the Data Products tab to the left for descriptions of the three levels (I, II, III) of data processing and to access all data.
