ITP28 Data Processing
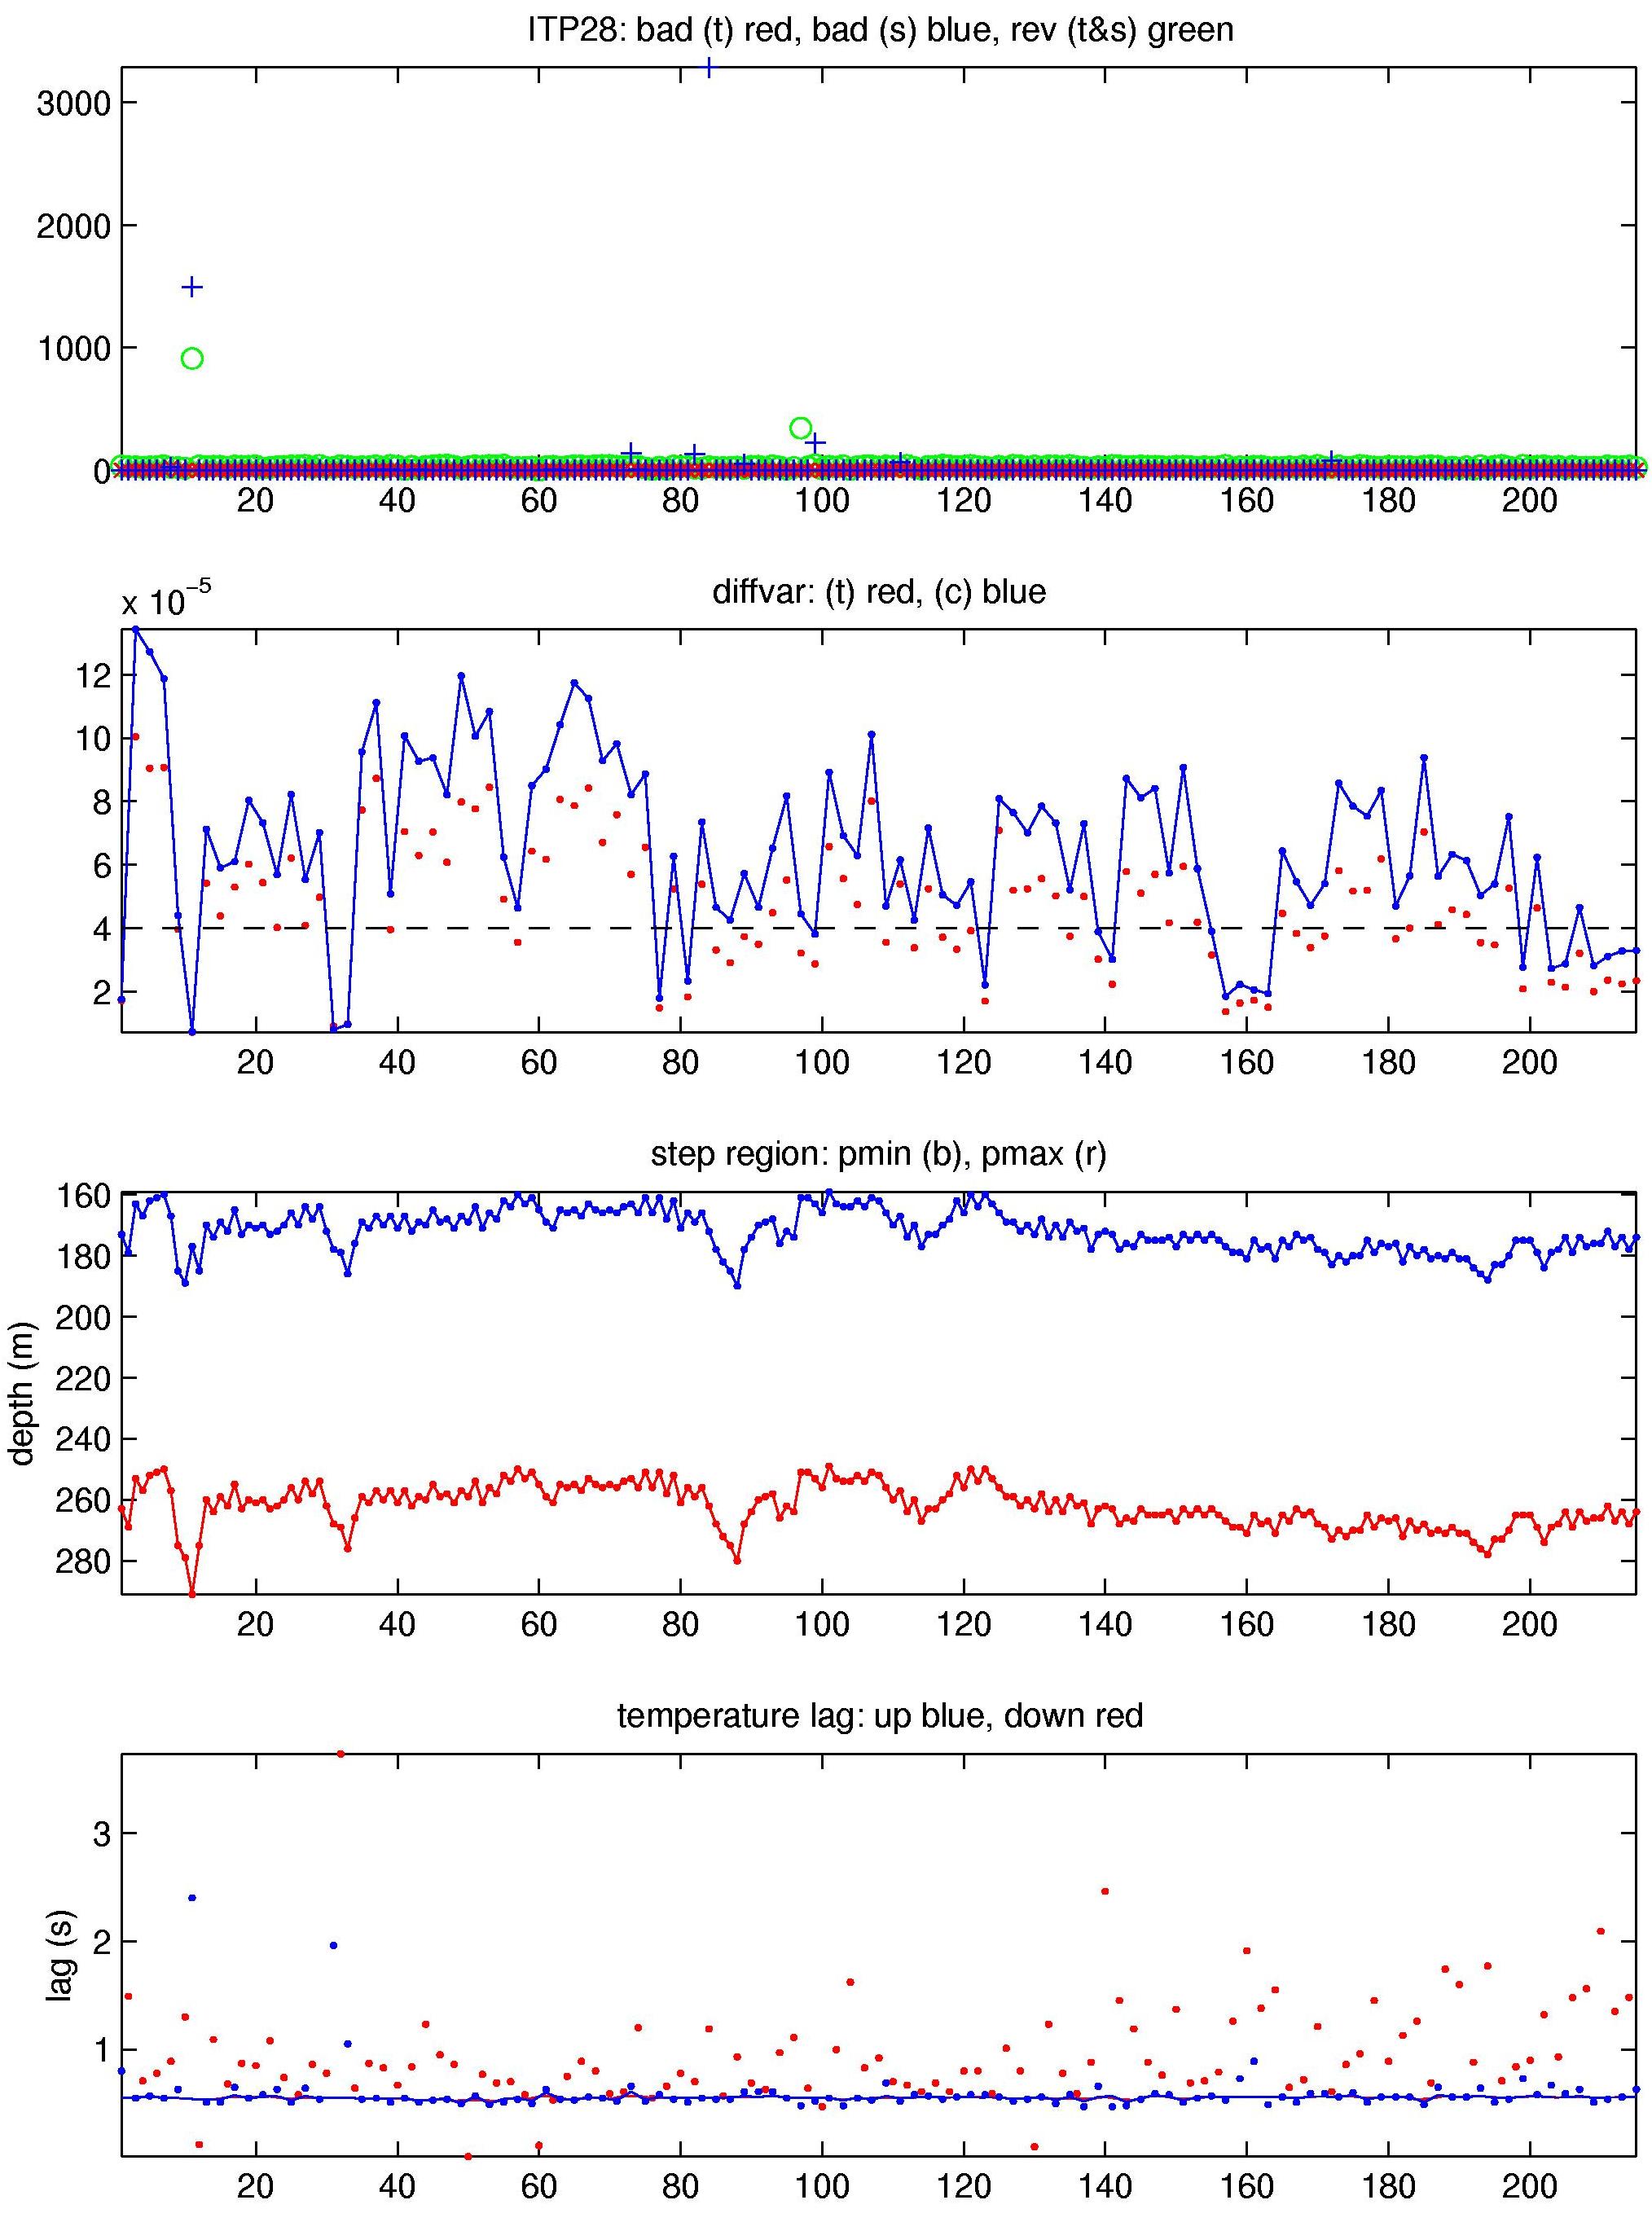
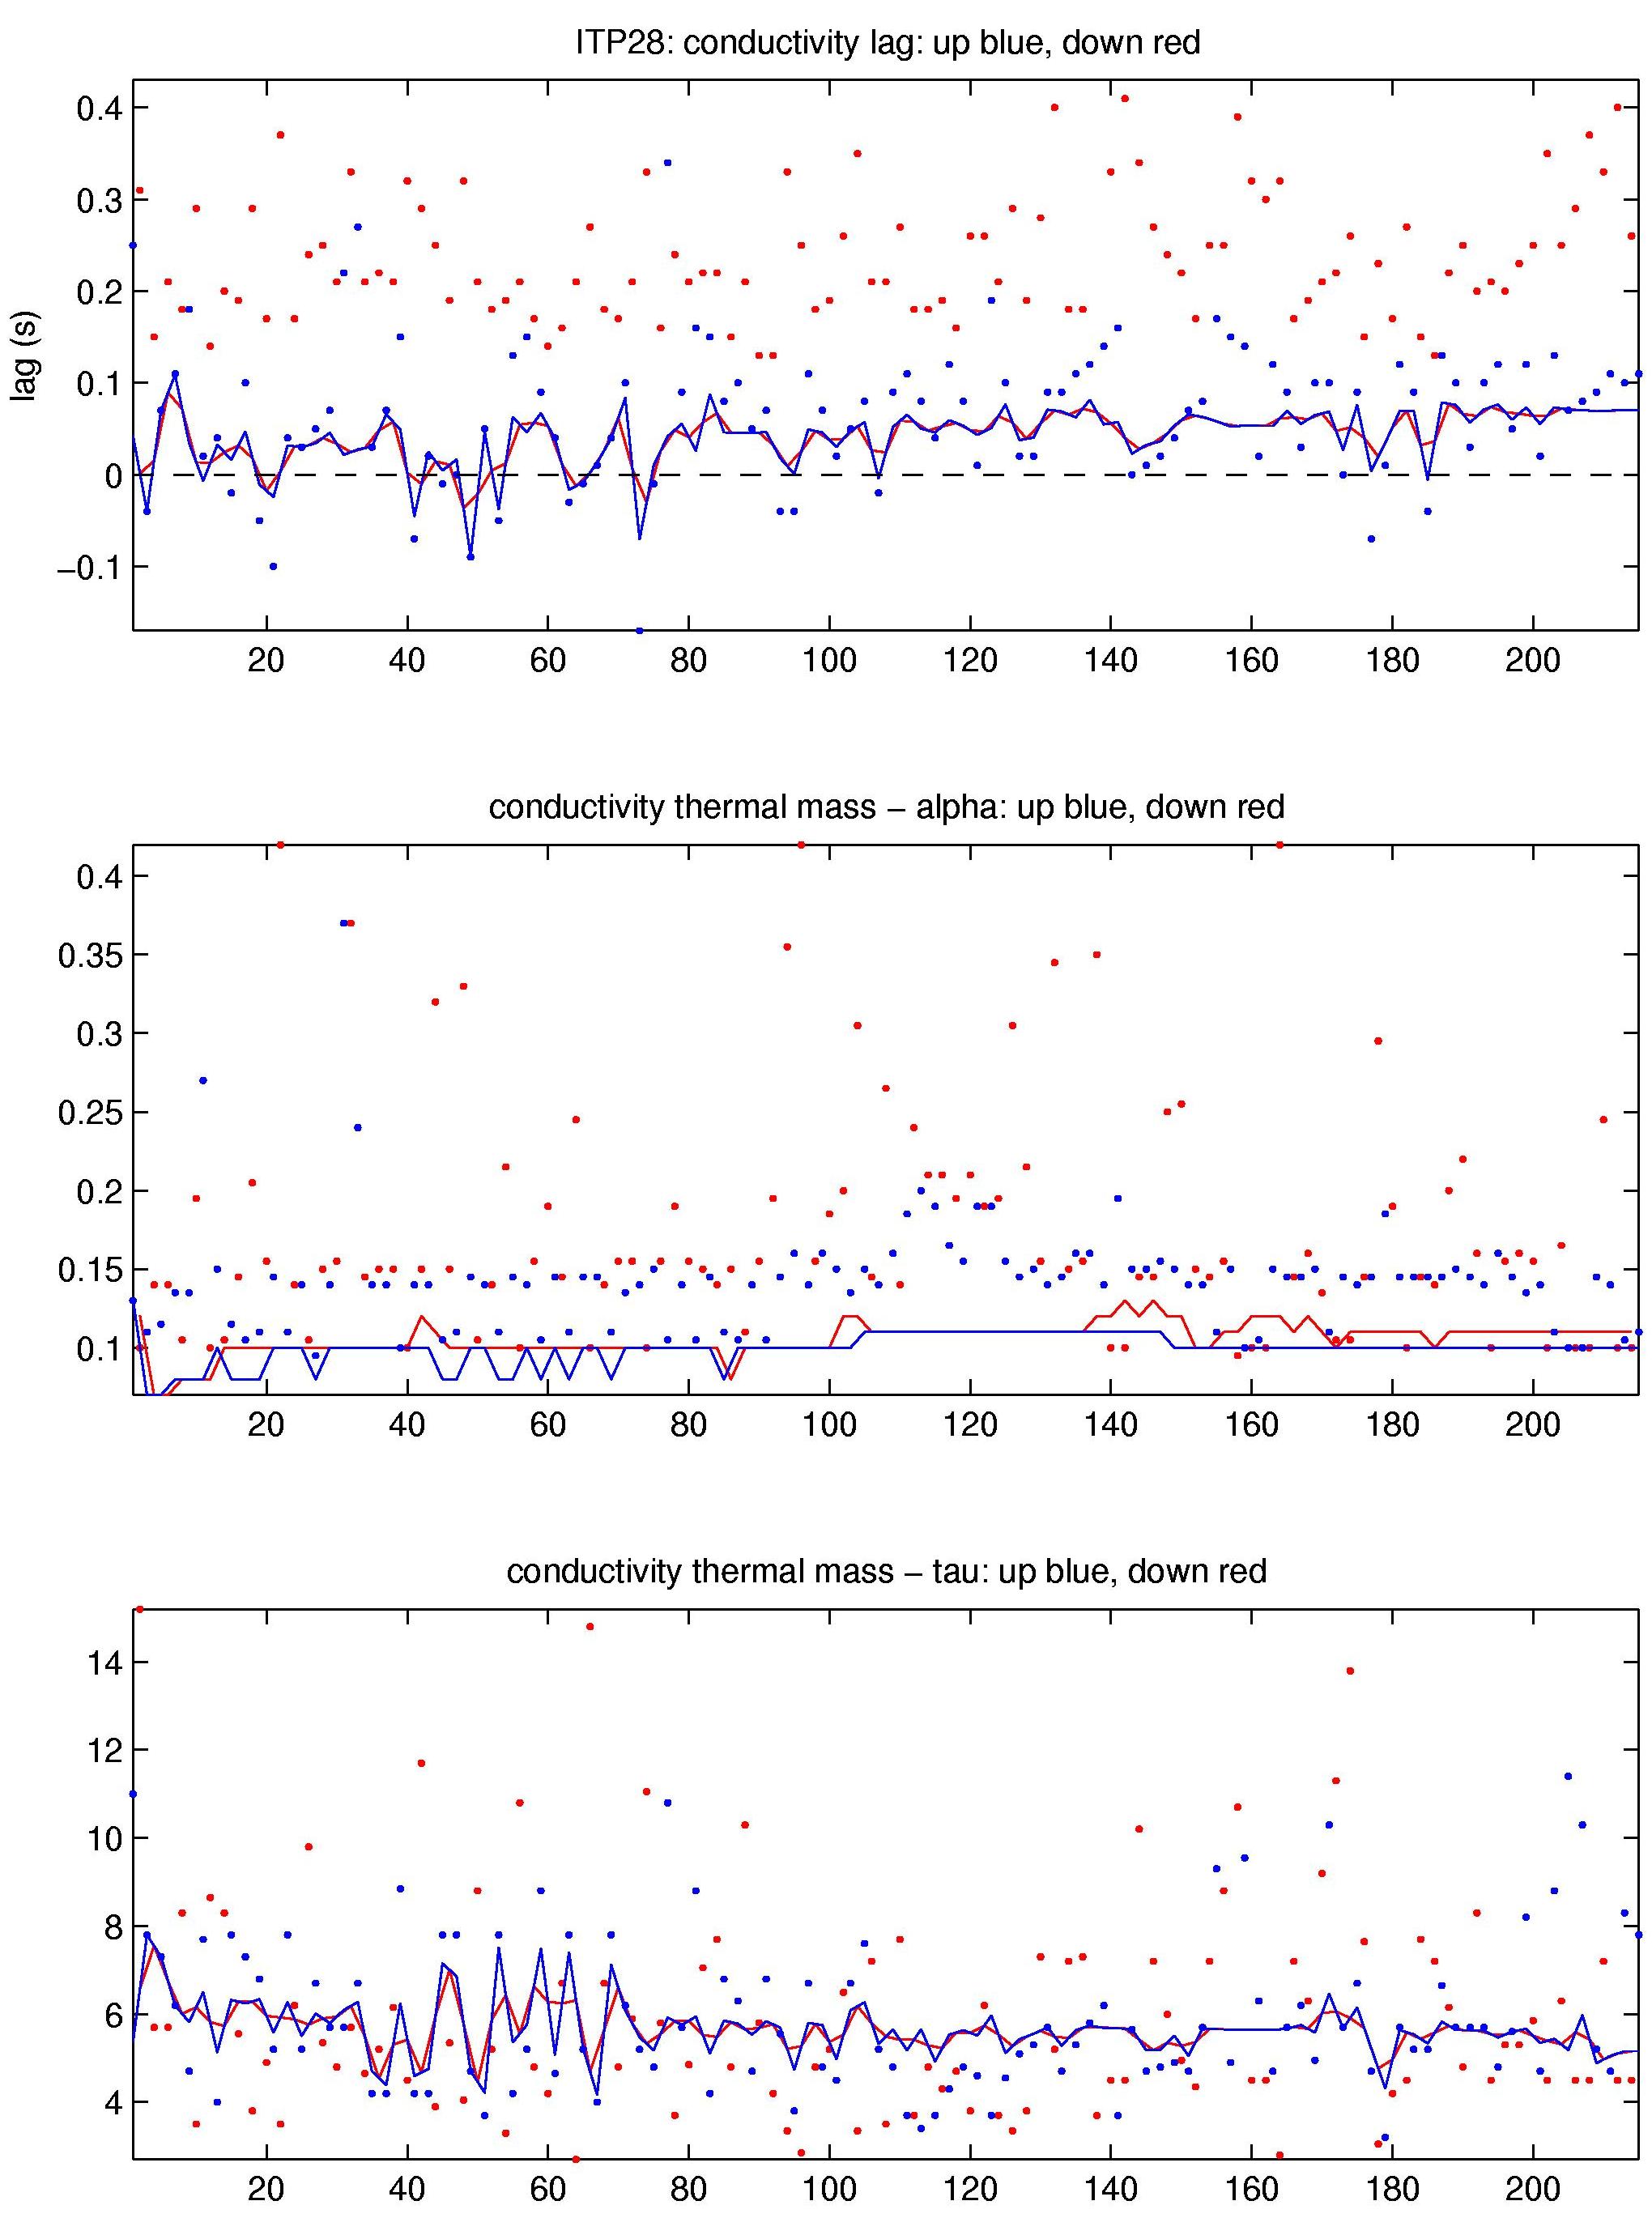
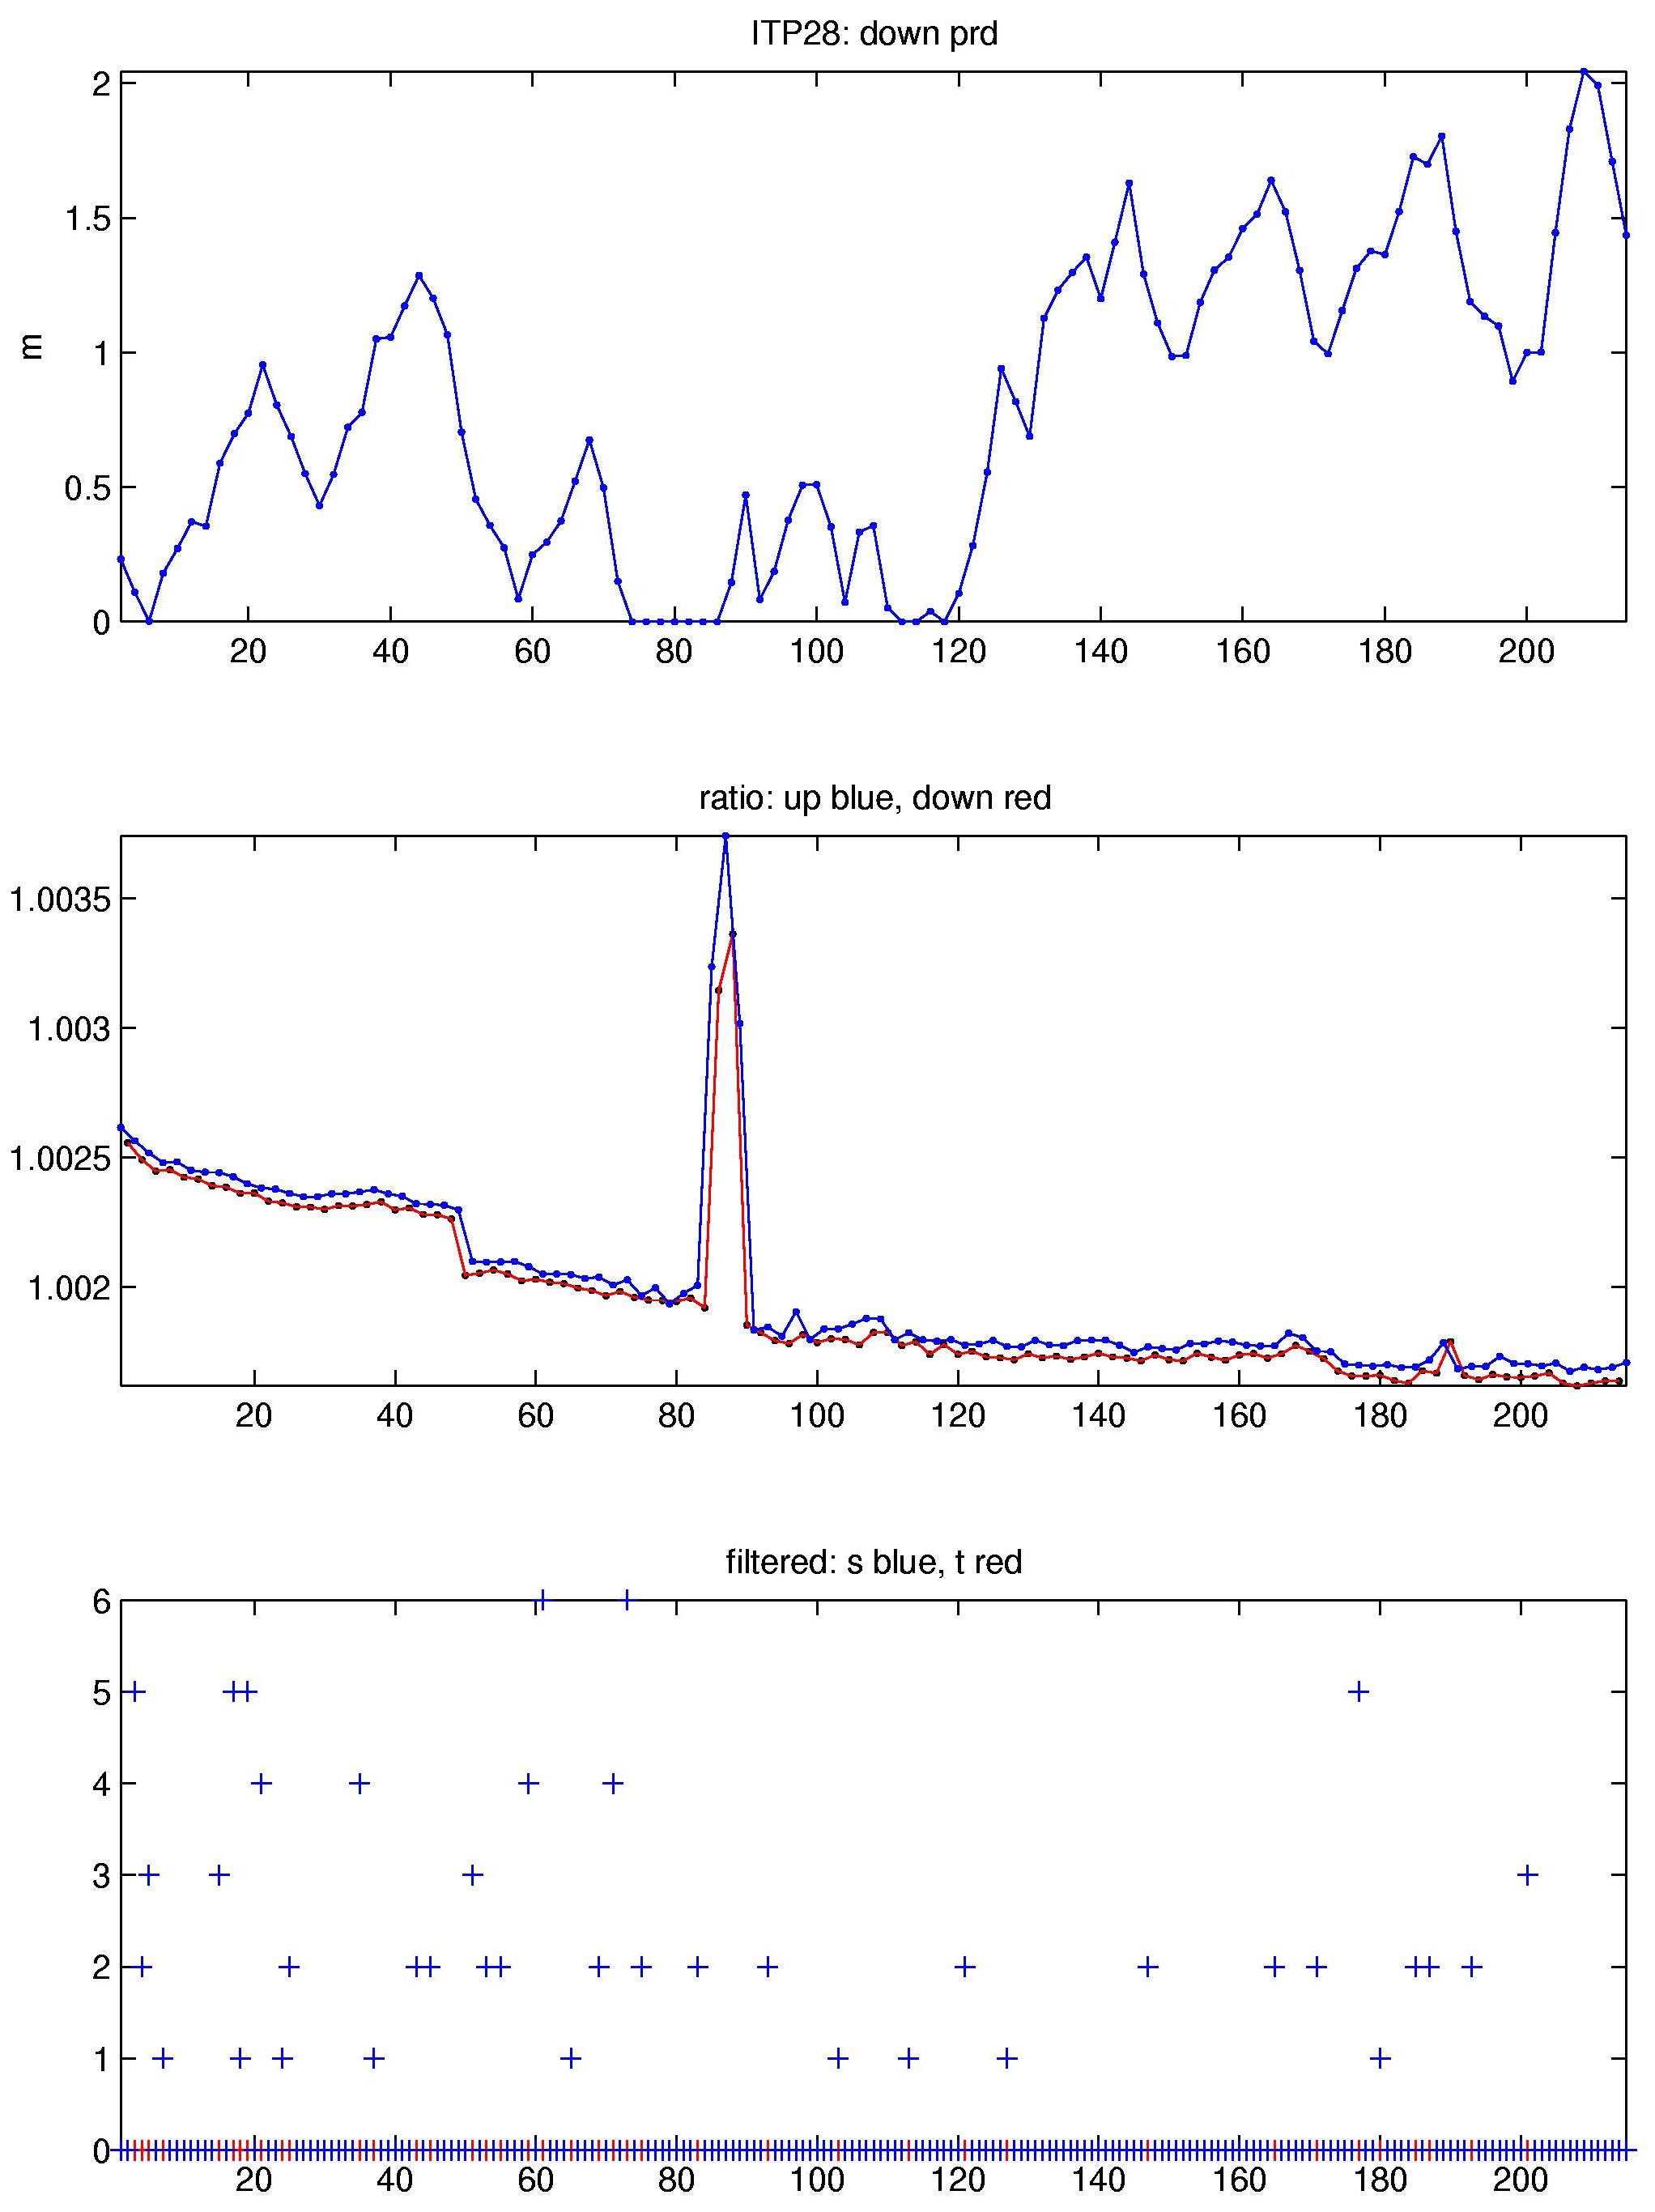
The 215 profiles that were obtained from the ITP were processed according to the procedures described in the ITP Updated Data Processing Procedures. The processing parameters for ITP 28 are shown in the figures to the right.
As usual, some conductivity (salinity) data were affected by biofouling or similar glitches. However, they were relatively few here, and none lasting over several profiles (though, of course, with 215 profiles this record was also relatively short). Thermohaline staircases were present for a large portion of the time series, enabling CTD lag corrections. The lags were in the typical range found for previous systems. During manual editing, thermal lag corrections were dialed back somewhat to remove overcompensation. Other parameters such as the thermistor lag corrections ("tlag" in the code) and the conductivity- temperature time offsets ("cshift") were not modified from those calculated by the processing code.
The conductivity adjustment ("rat") showed a somewhat unusual pattern for this ITP: while typicall around 1 (no adjustment) with occasional outliers related to minor conductivity contaminations, it showed a gradual decline from 1.0026 to 1.0017over the course of the CTD record. One short outlier region reached over 1.0036 (profiles 85:89). There were no other obvious deviations or glitches noted for these profiles, and after making the adjustment they followed nearby profiles very closely in TS and density. As a check, applying the adjustment of 1.002 found just outside of the "rat" spike produced clear outliers.
The plots to the right are of the final, calibrated, edited data (as opposed to the raw data presented on the active instrument pages).
See the Data Products tab to the left for descriptions of the three levels (I, II, III) of data processing and to access all data.
