ITP32 Data Processing
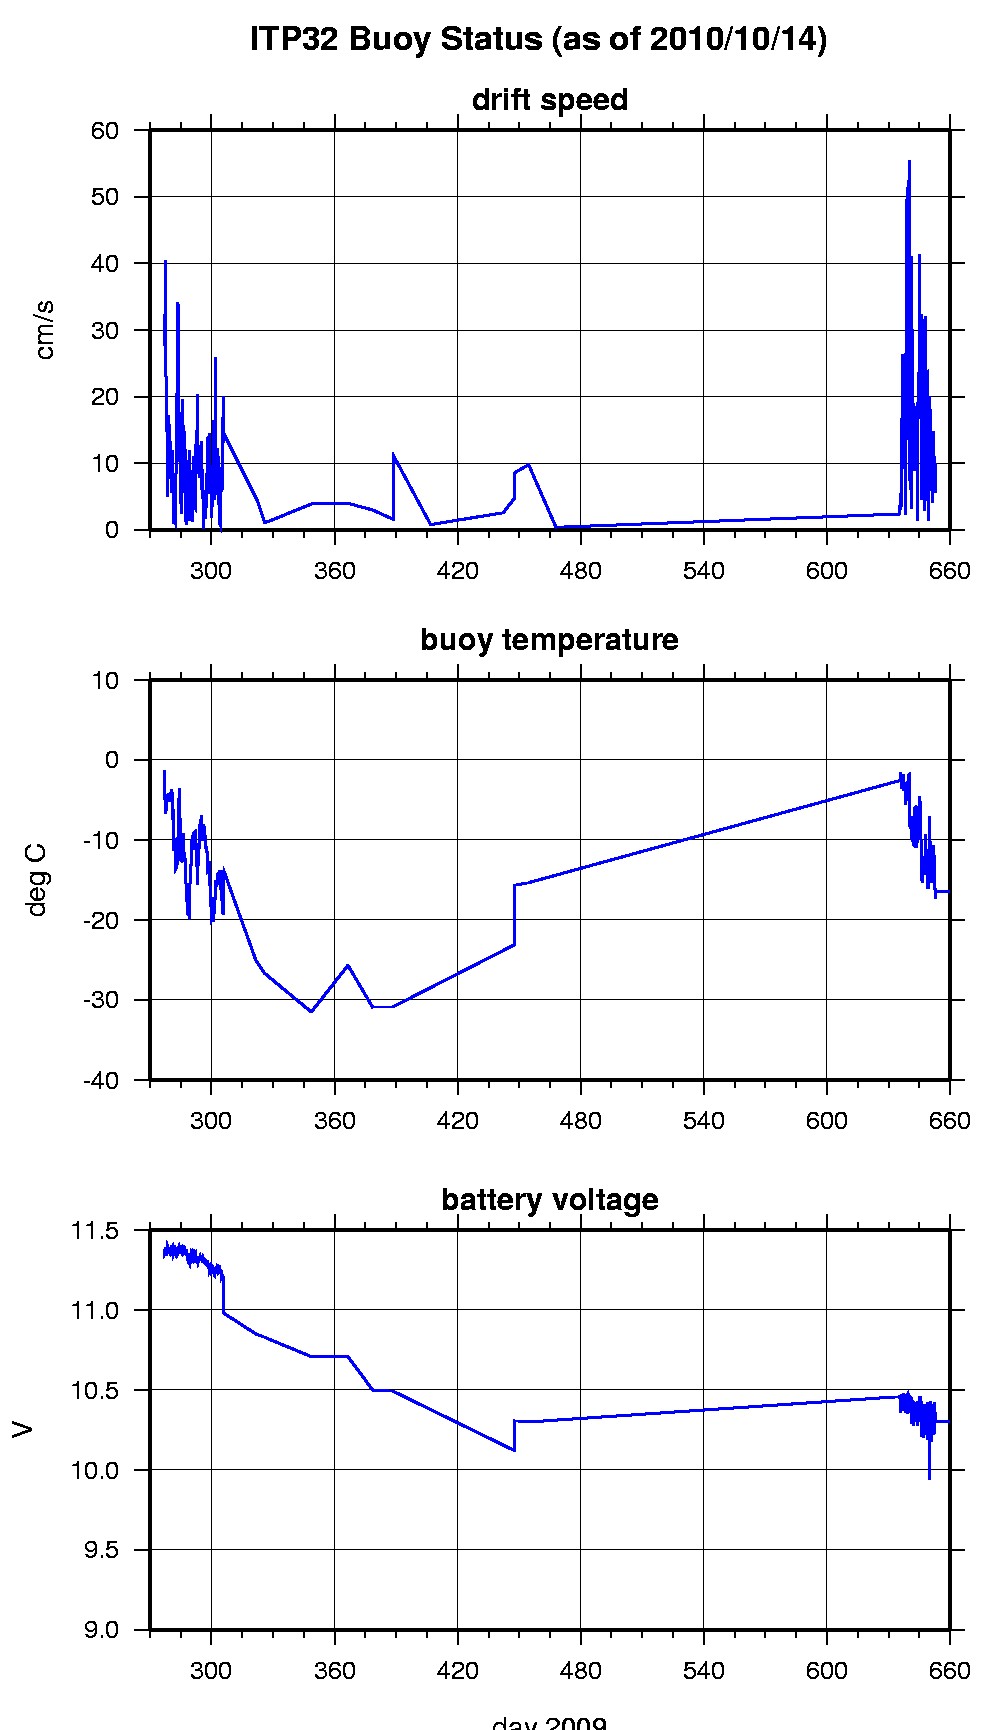
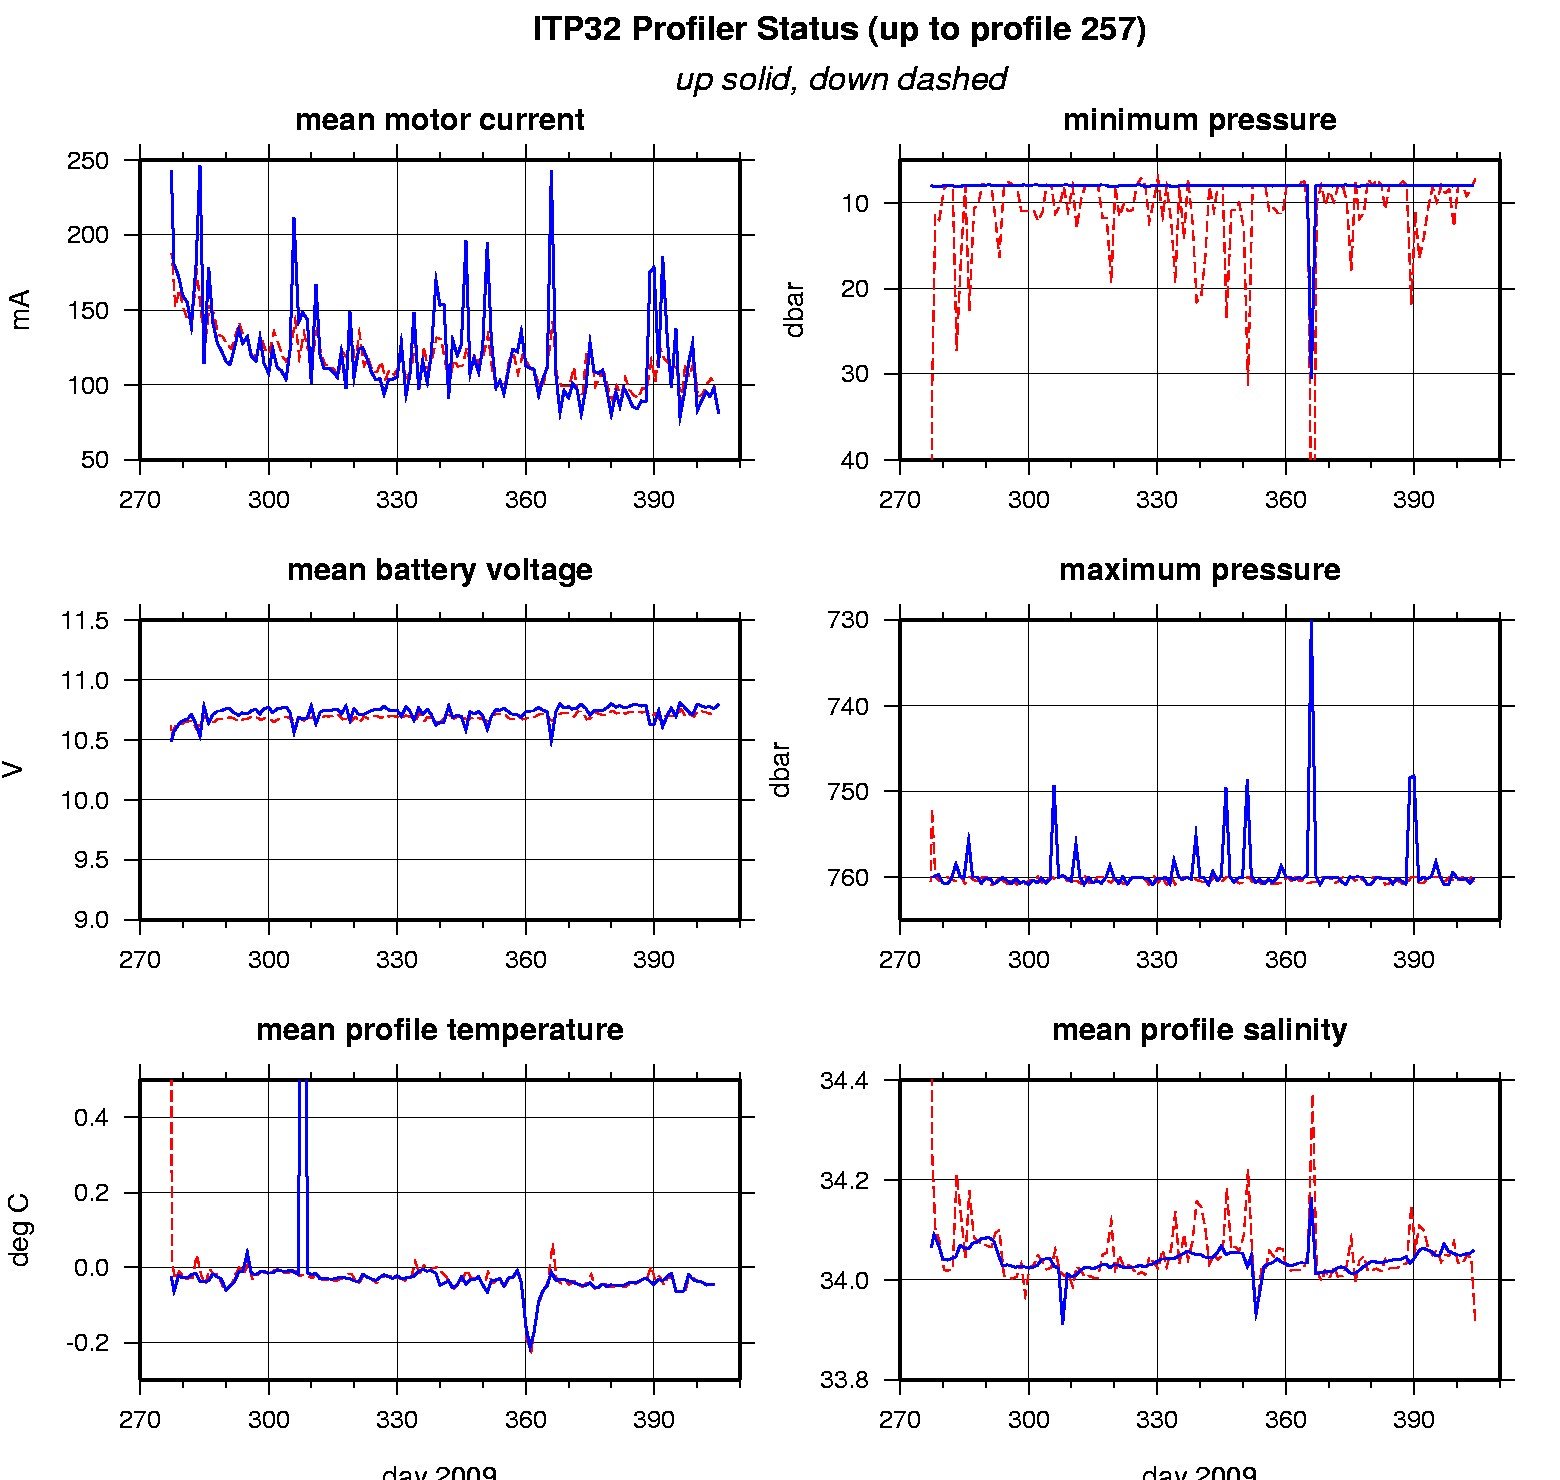
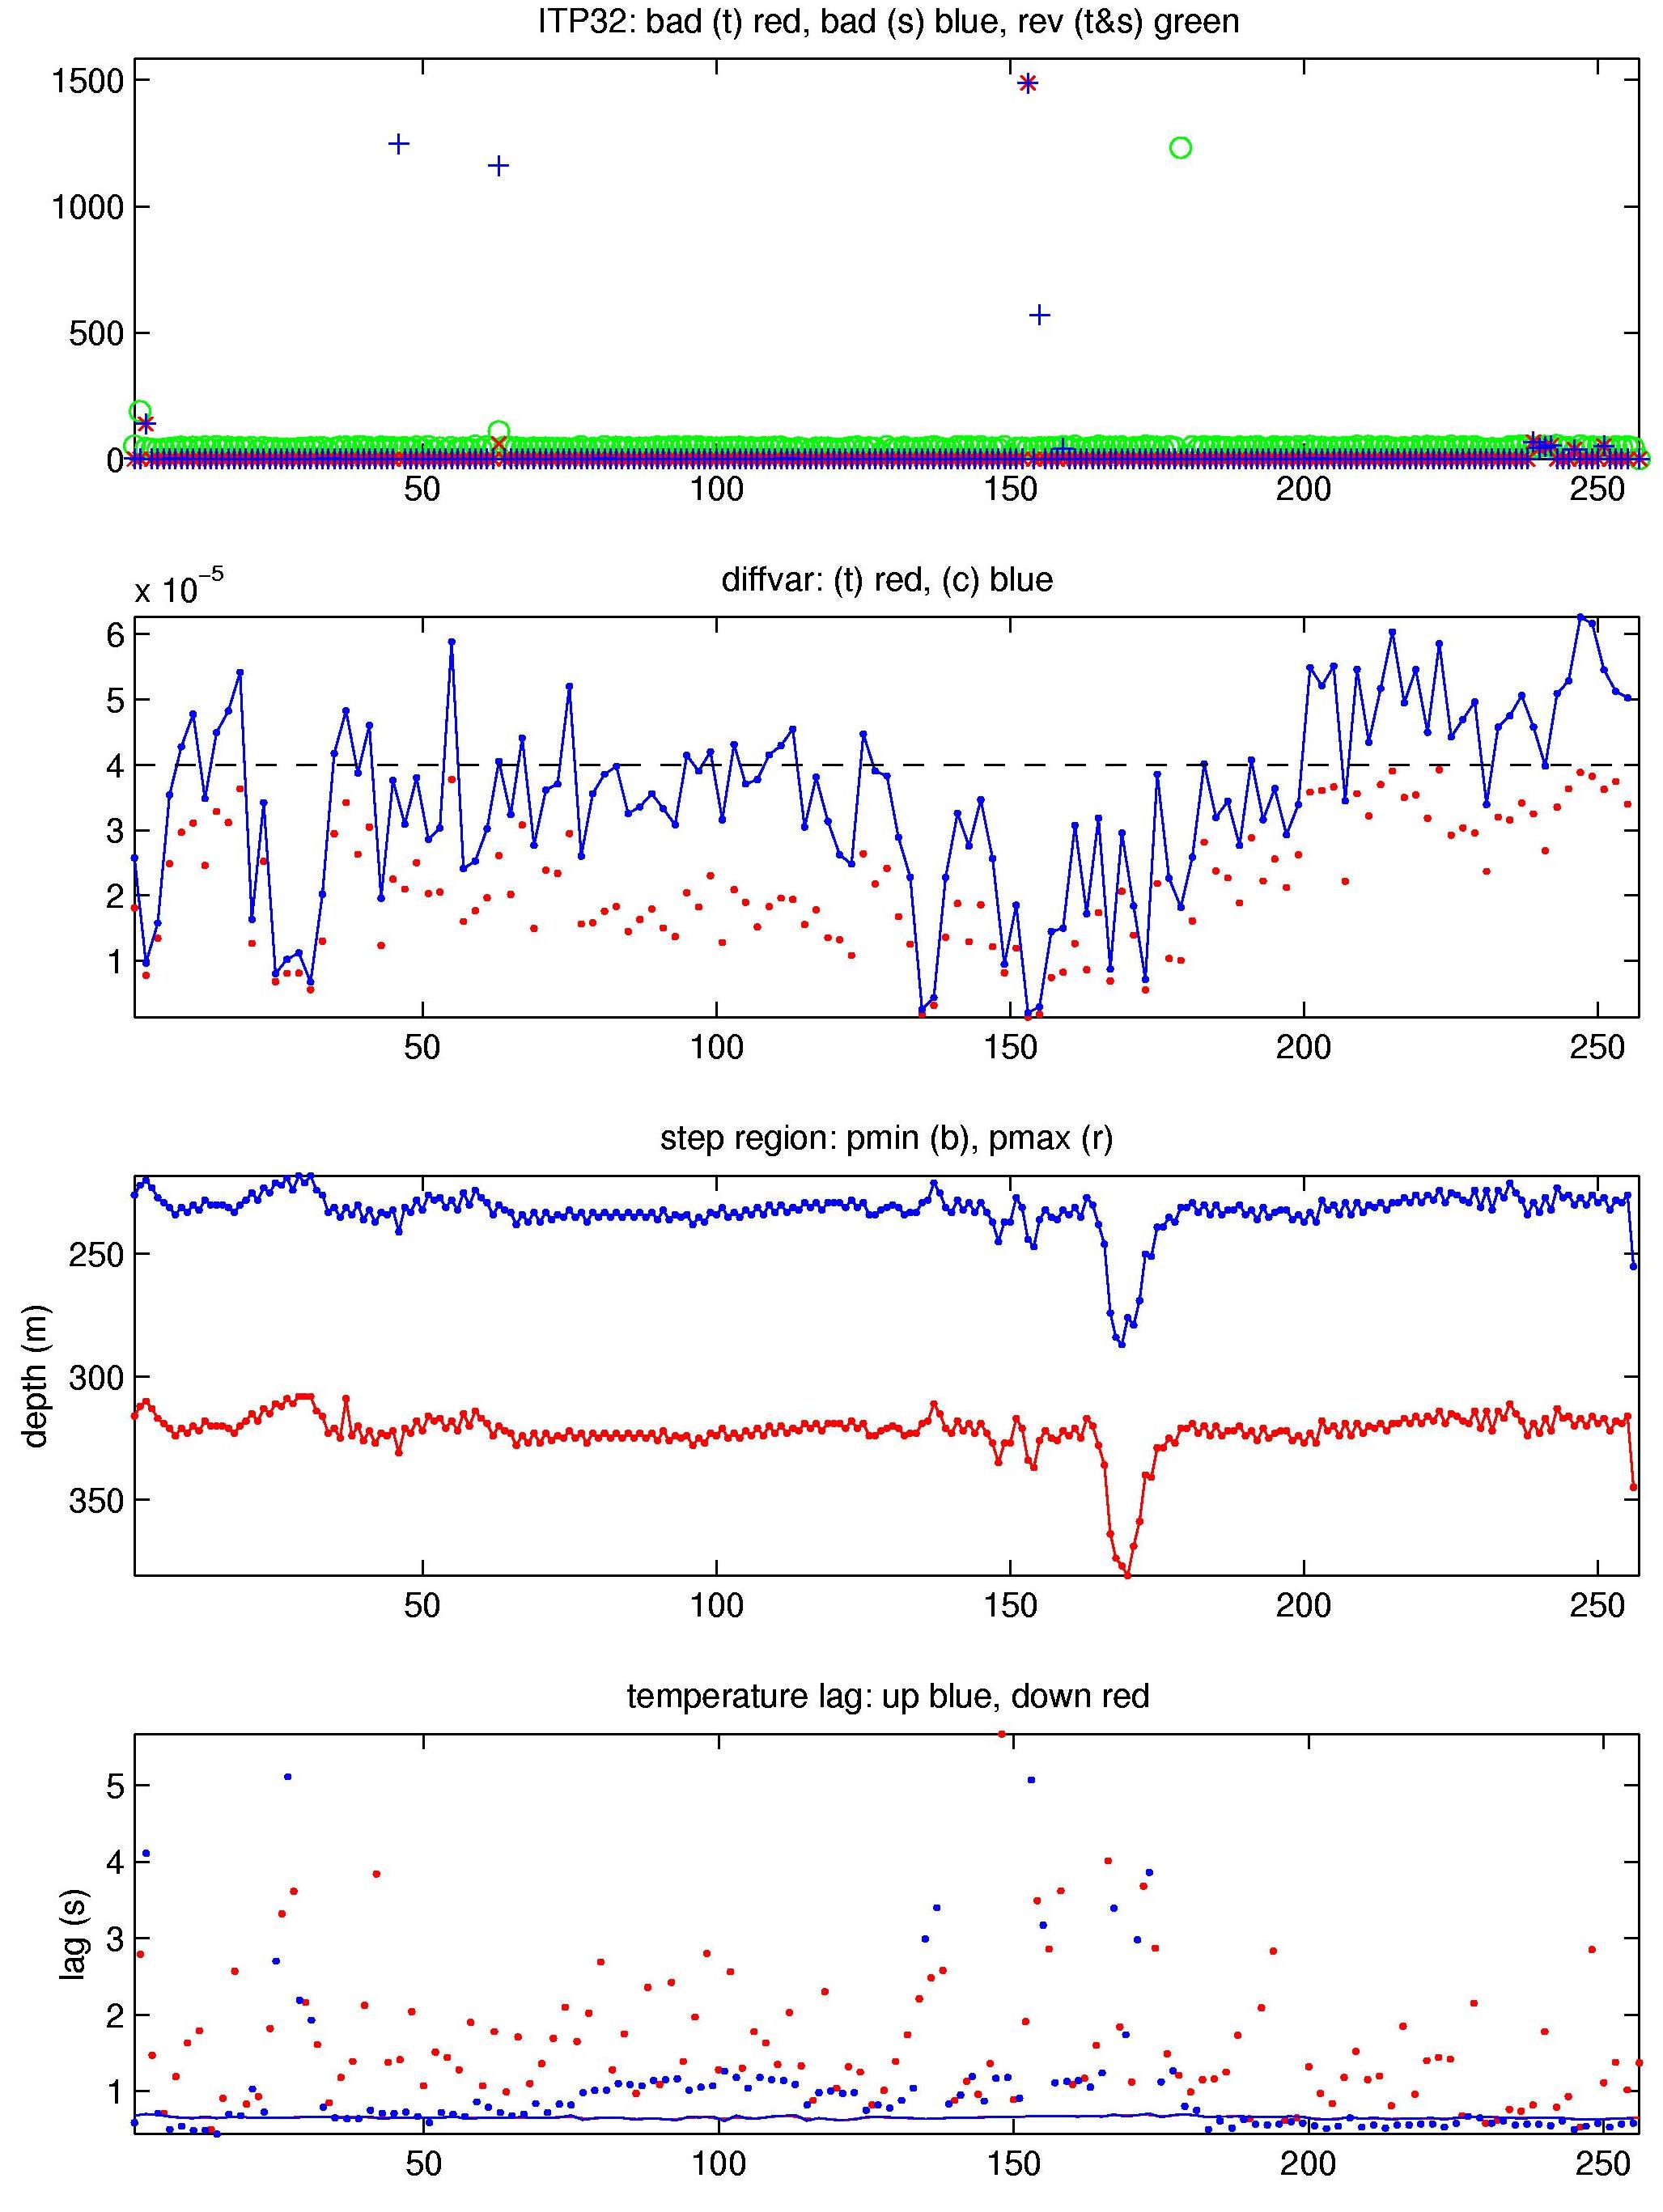
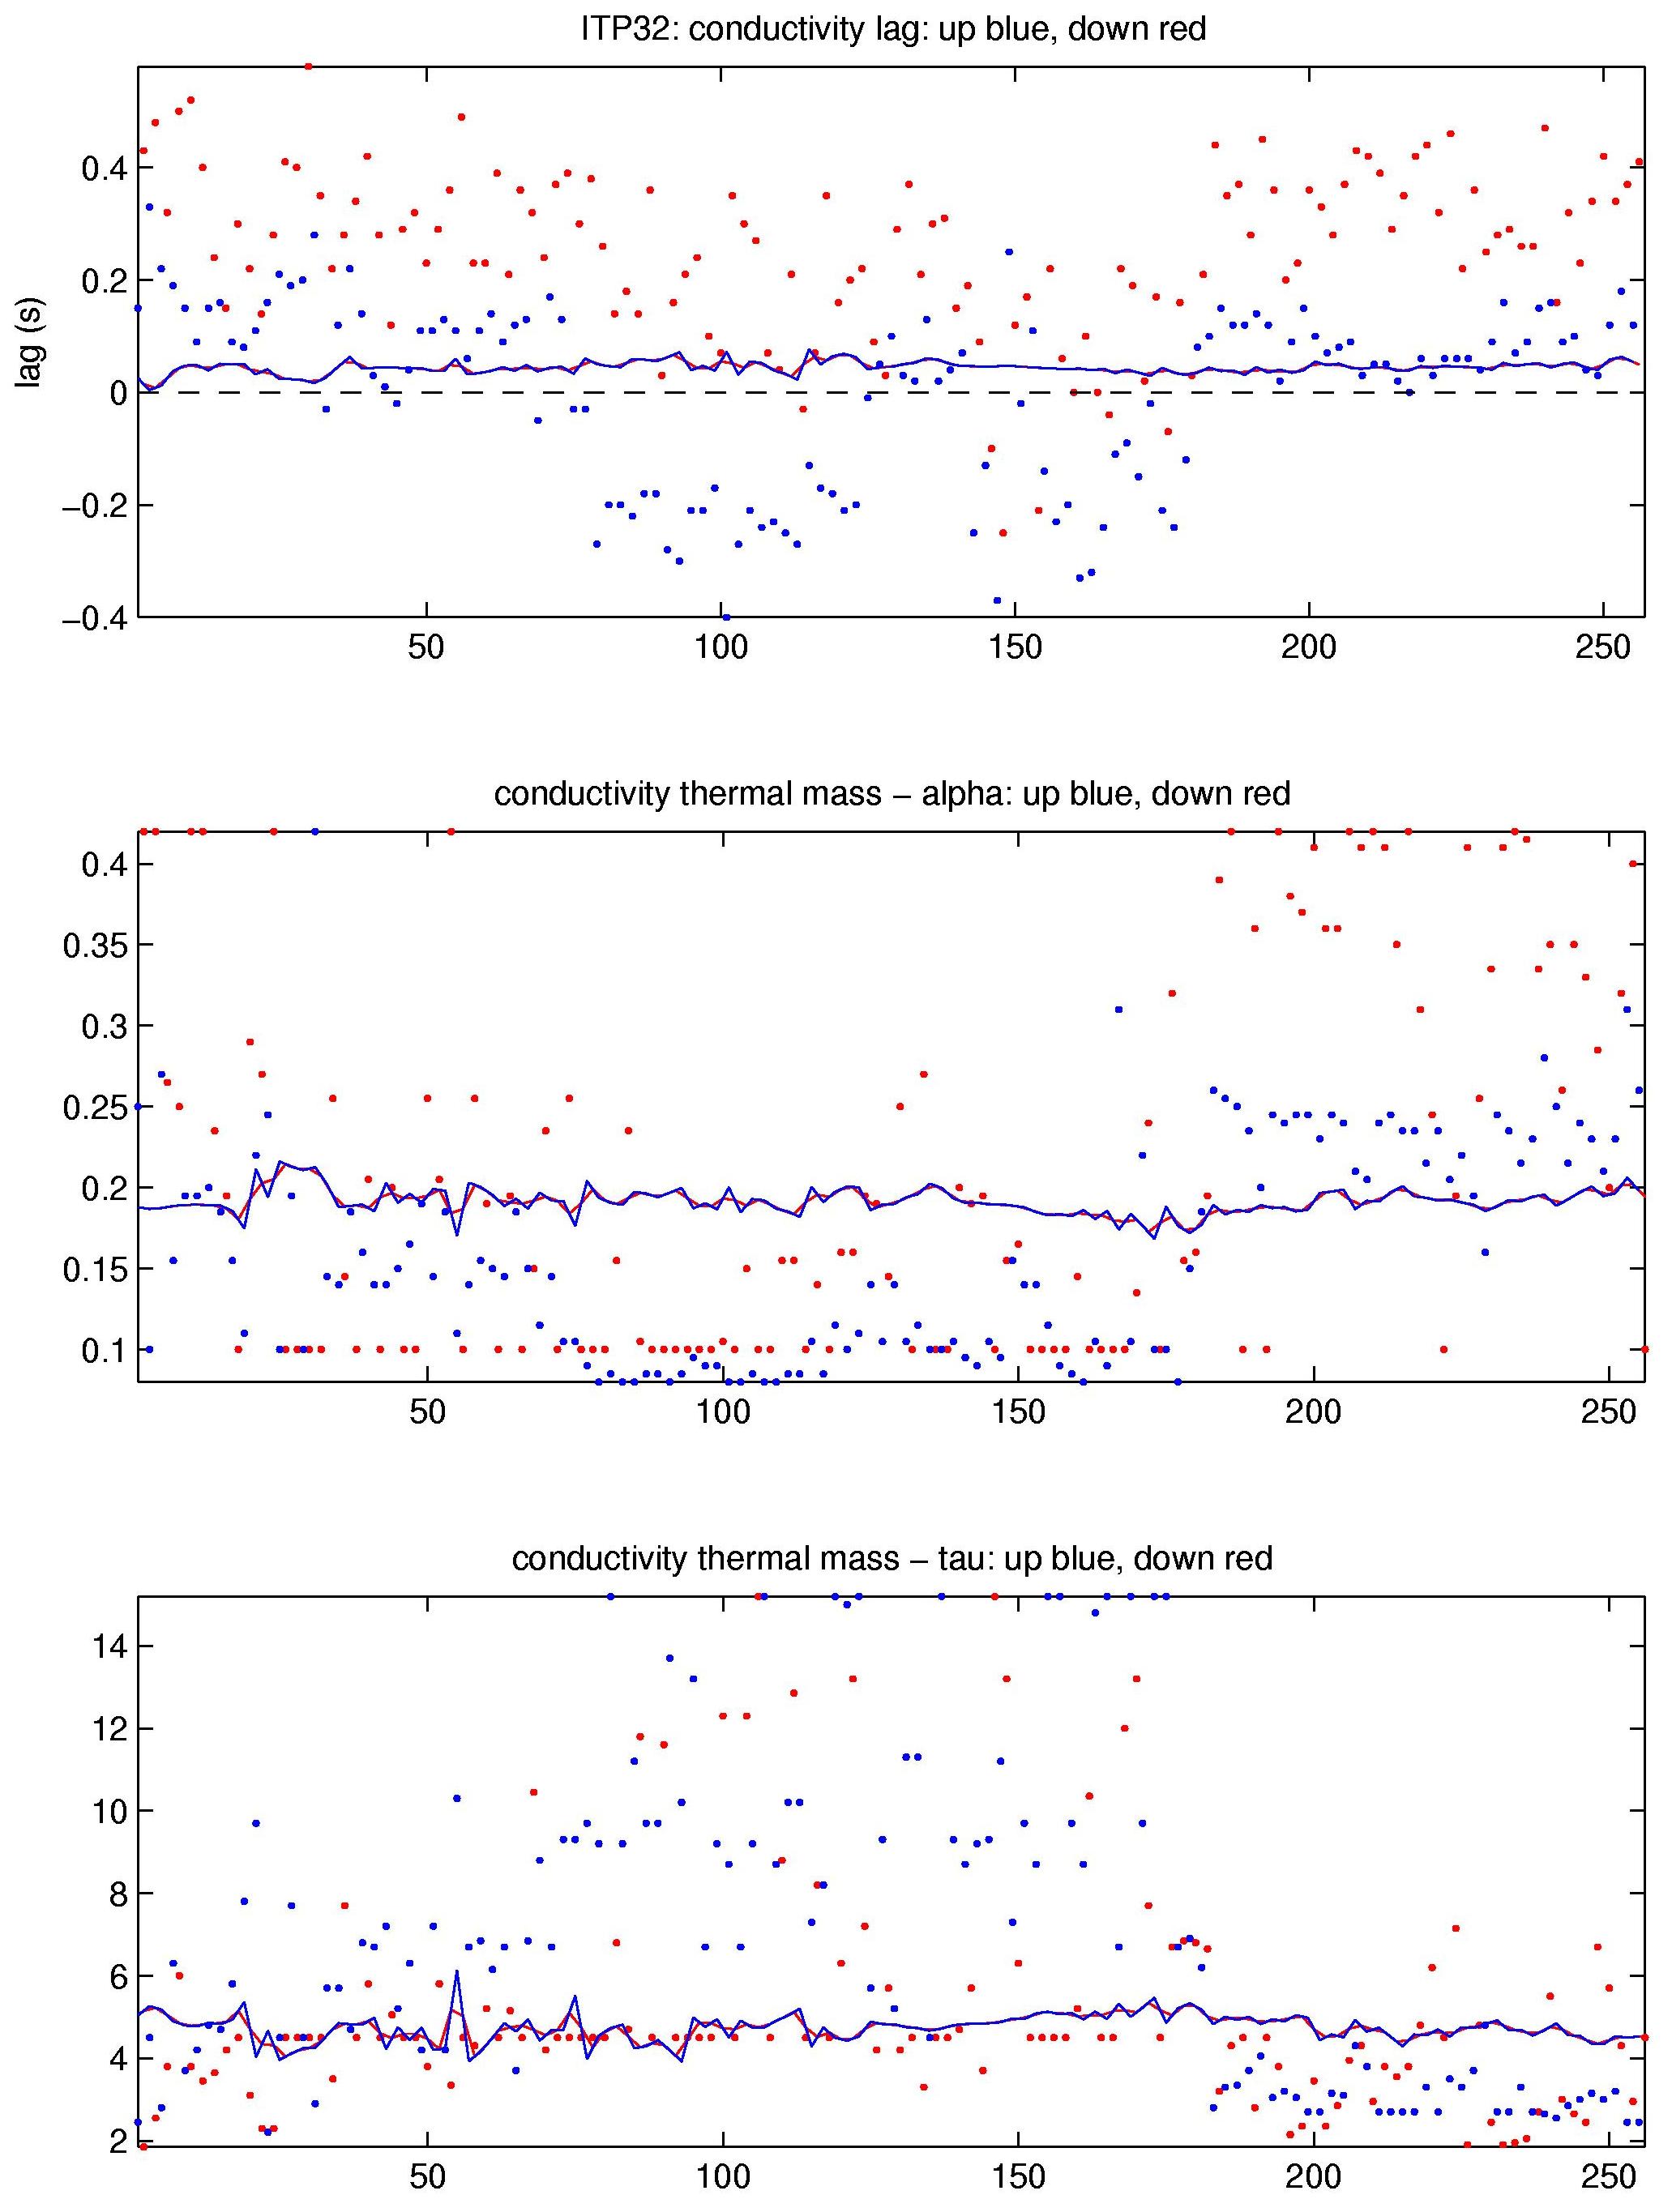
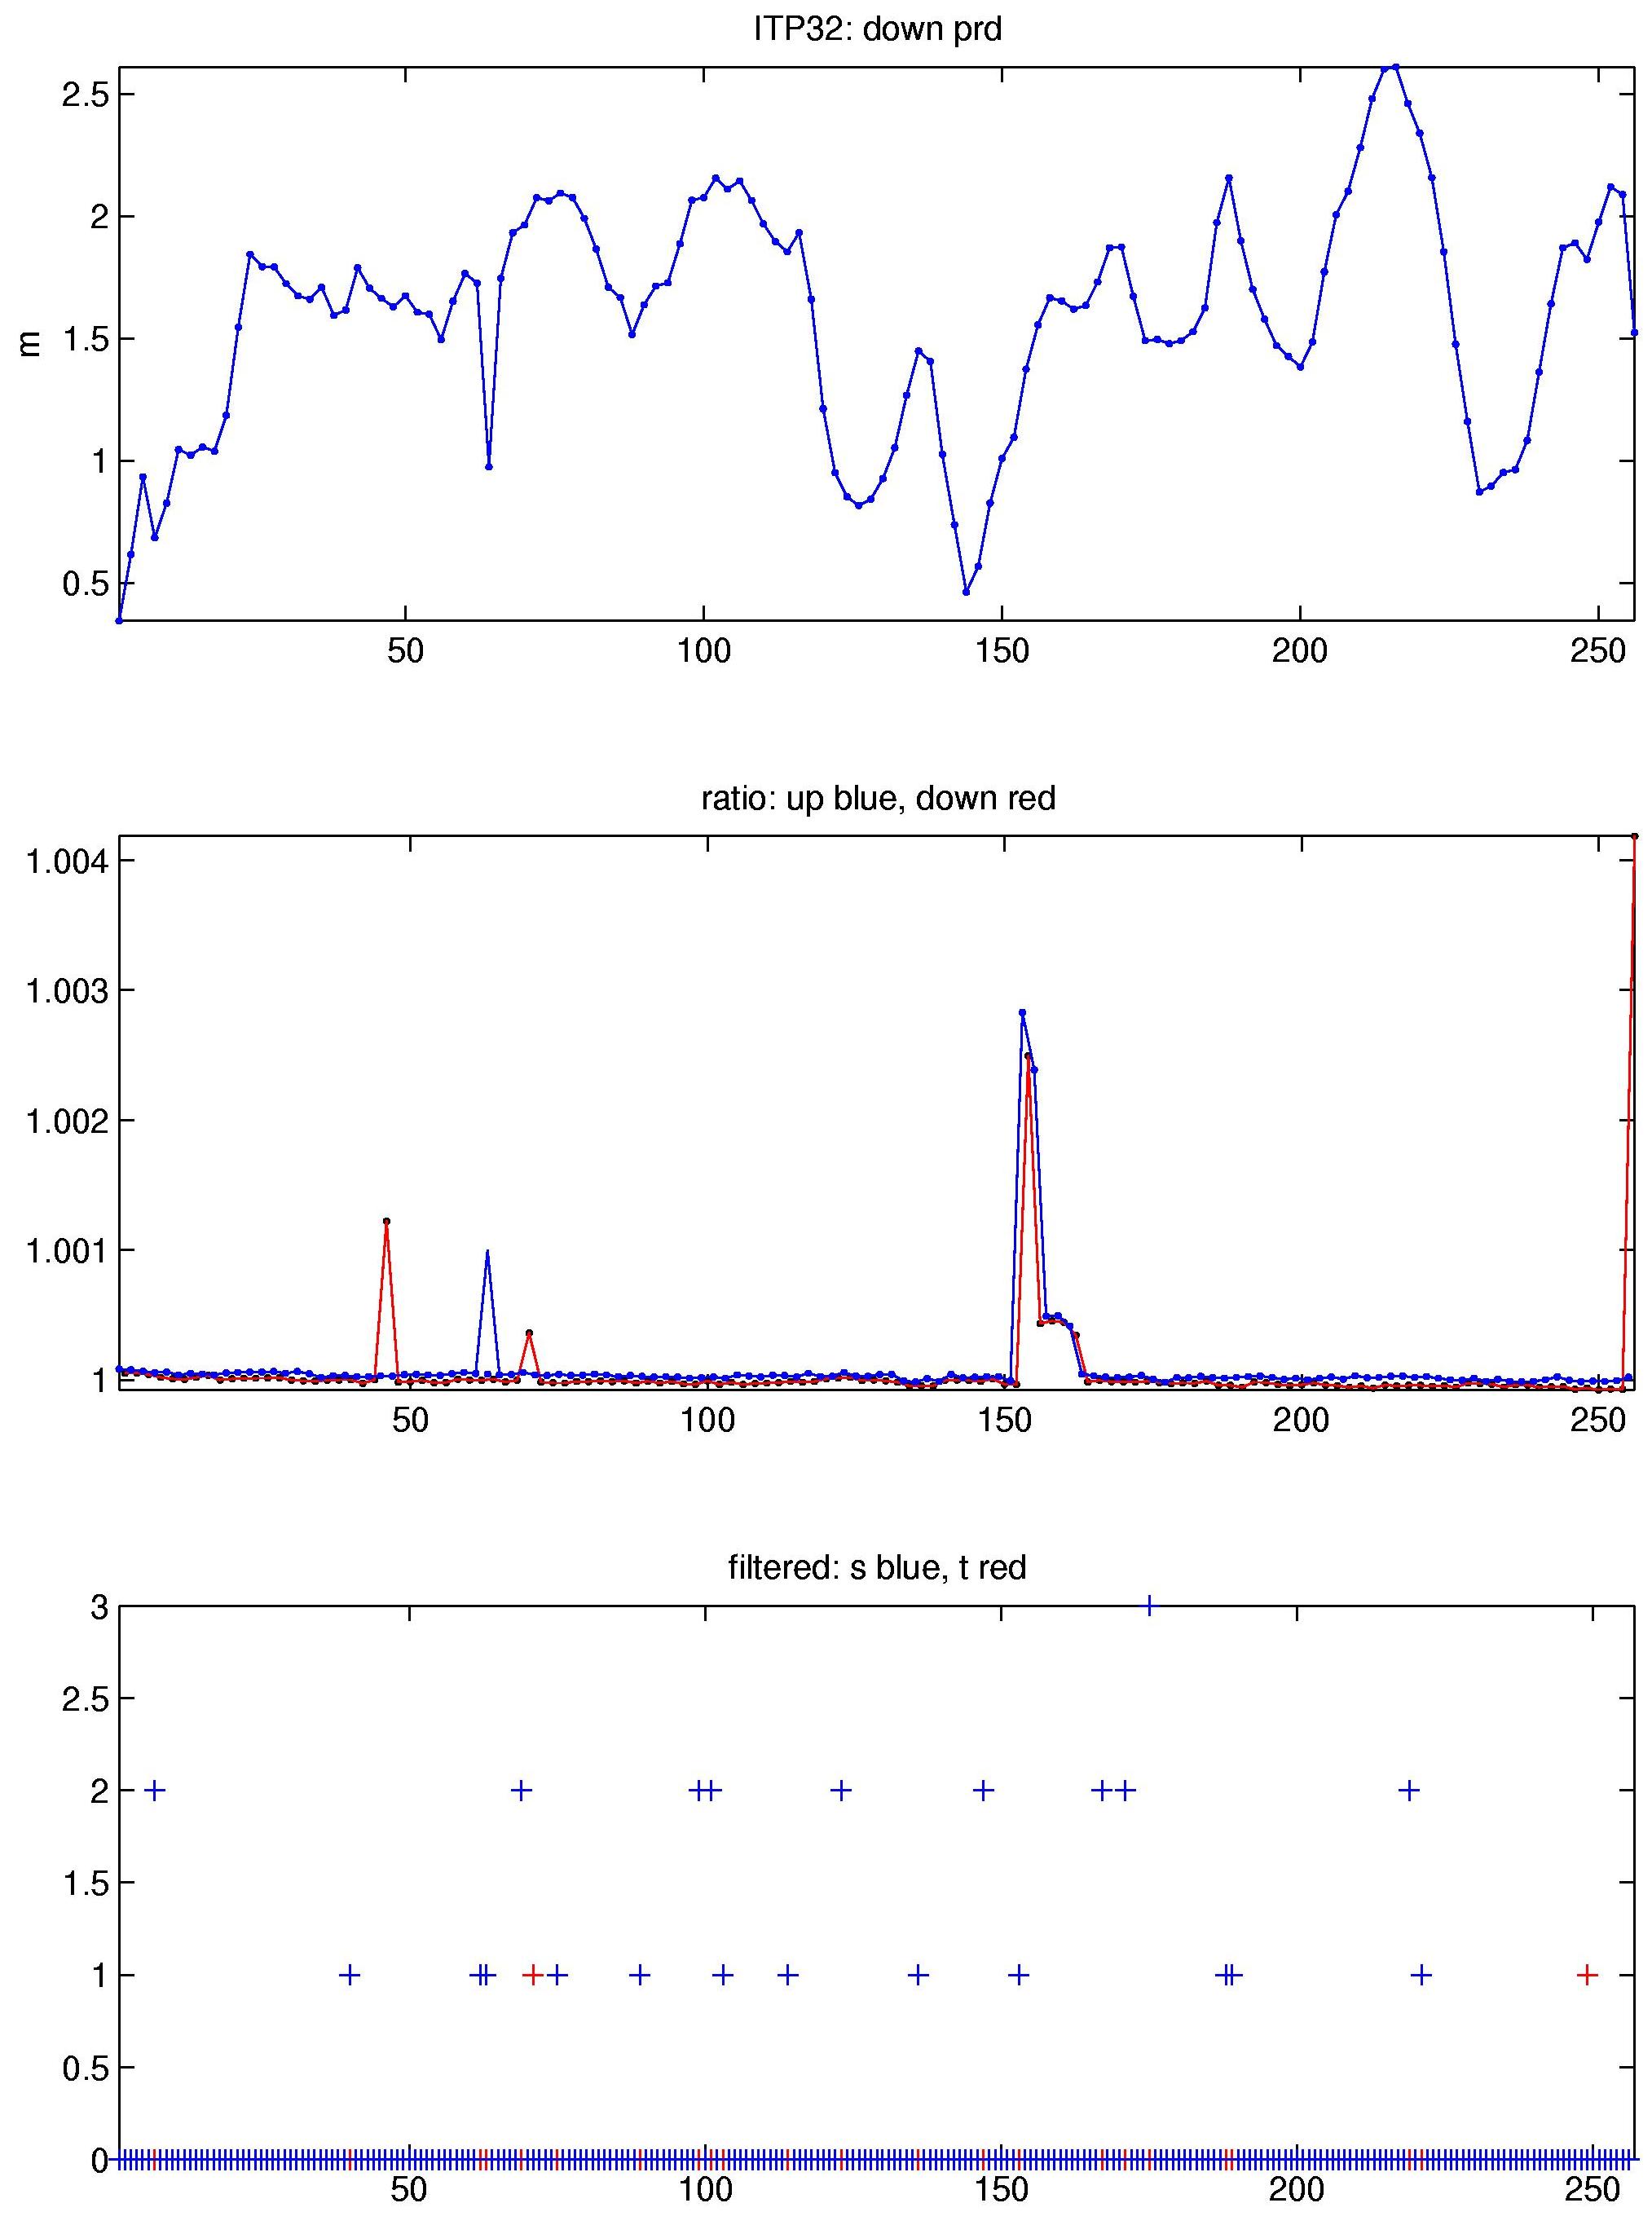
The 257 profiles that were recovered from the ITP were processed according to the procedures described in the ITP Updated Data Processing Procedures. The processing parameters for ITP 32 are shown in the figures to the right. After November 2, 2009 profile locations are interpolated using Fowler and Tschudi (2003, updated 2013) sea ice motion vectors to infer drift, due to the absence of GPS locations from the buoy. While there were a few occurrences where the drift speed exceeded 30 cm/s causing the profiler trouble climbing the wire, over 98% of the profiles spanned greater than 700 m.
Thermohaline staircases were present throughout most the time series, enabling CTD lag corrections. The vertical extent of the step region remained largely constant and the sensor lags varied little. The were several instances where the potential conductivity exhibits some temporary shifts, but the dataset was largely absent of fouling.
Fowler, C. and M. Tschudi, 2003, updated 2013. Polar Pathfinder Daily 25 km EASE-Grid Sea Ice Motion Vectors. Boulder, Colorado USA: National Snow and Ice Data Center. Digital media. https://nsidc.org/data/nsidc-0116.html
See the Data Products tab to the left for descriptions of the three levels (I, II, III) of data processing and to access all data.
