ITP54 Data Processing
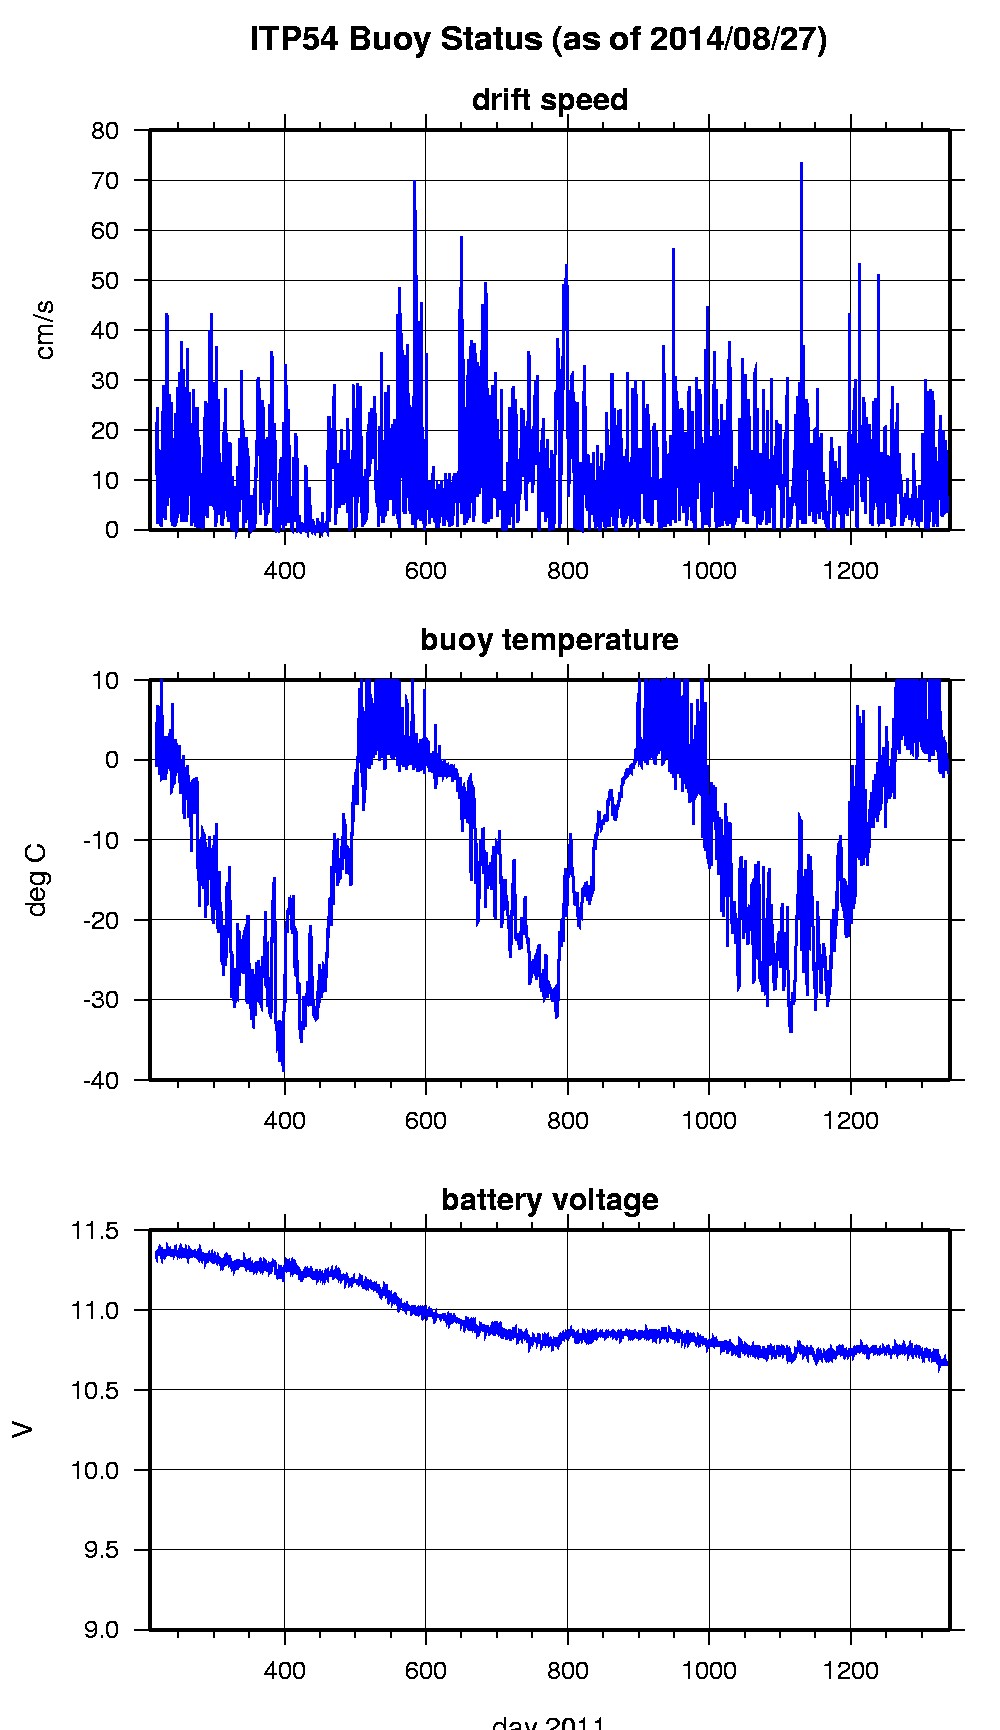
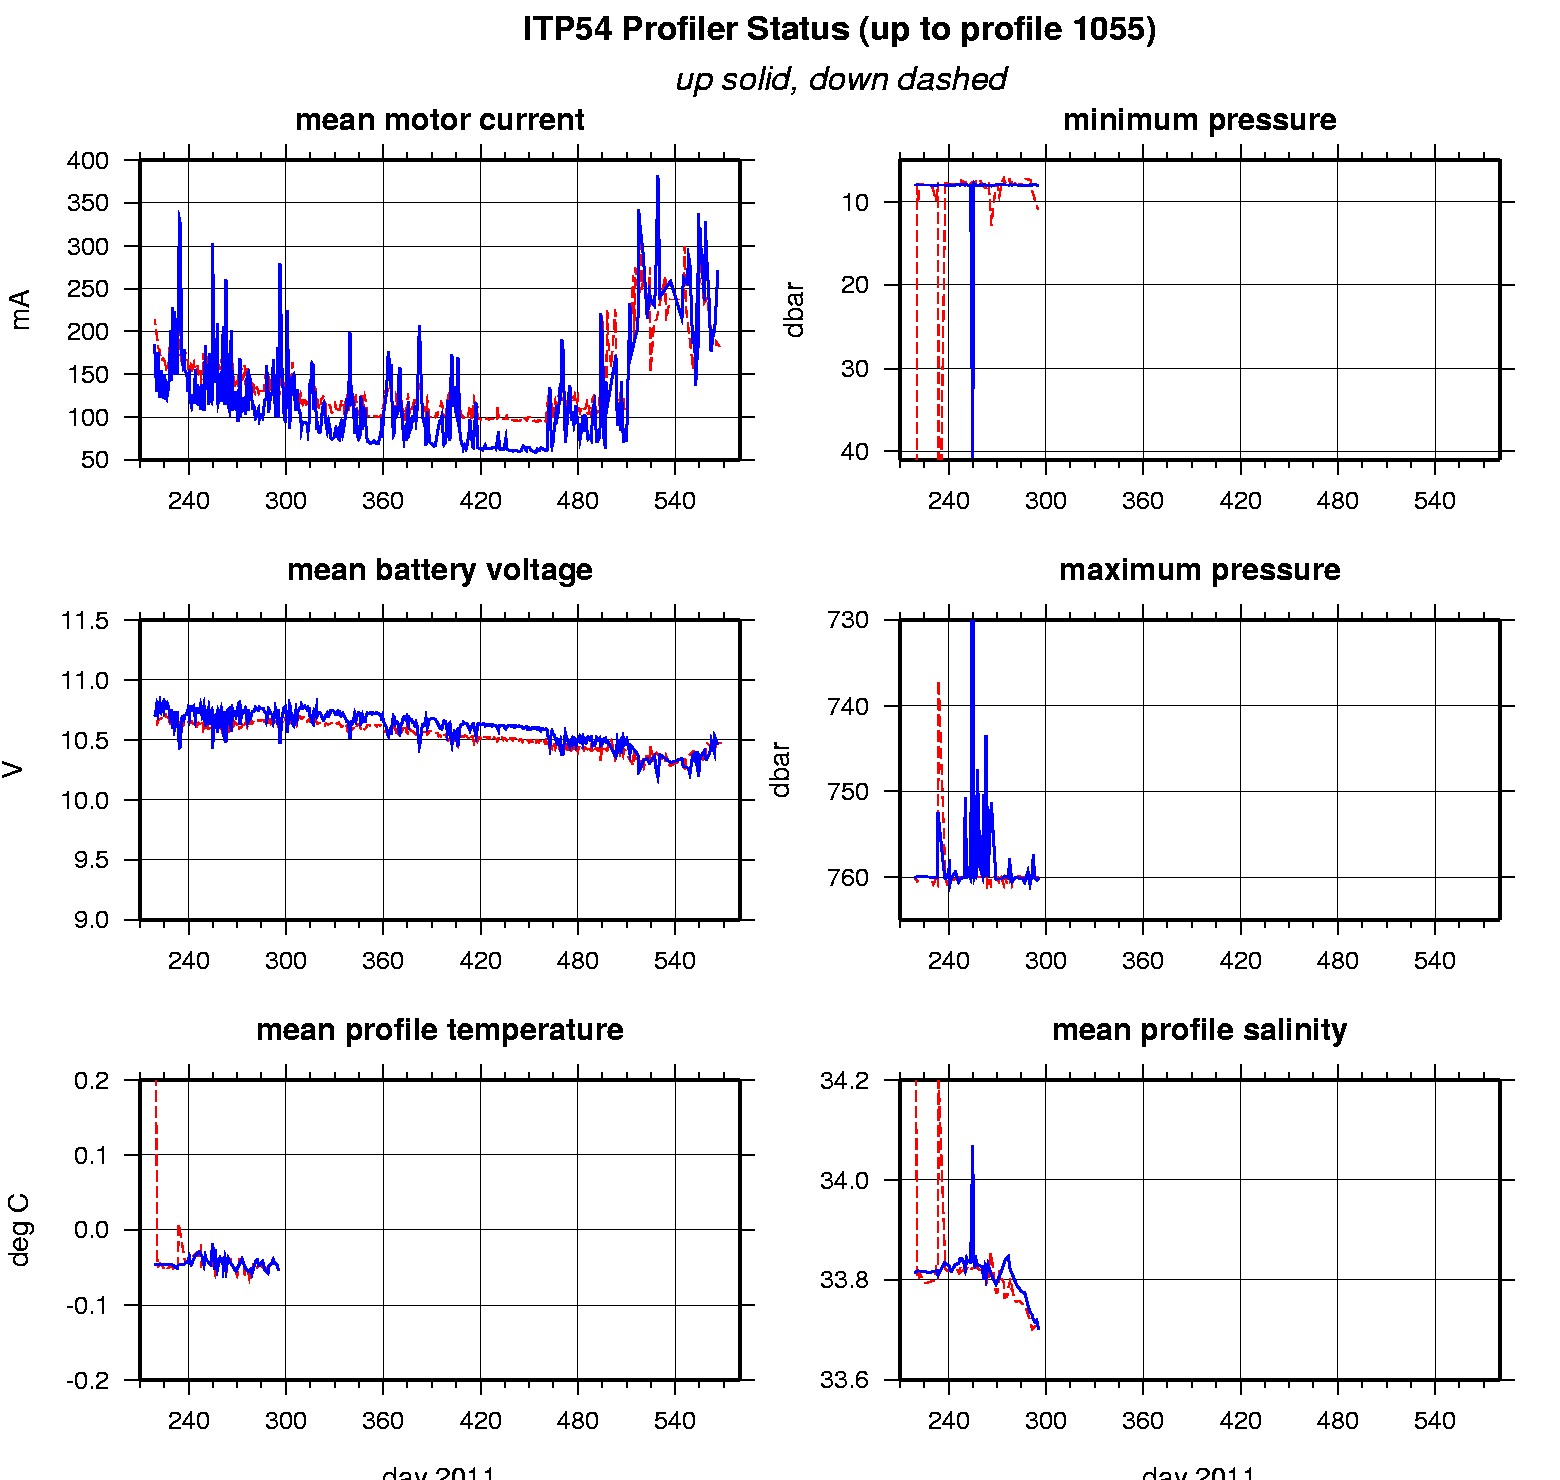
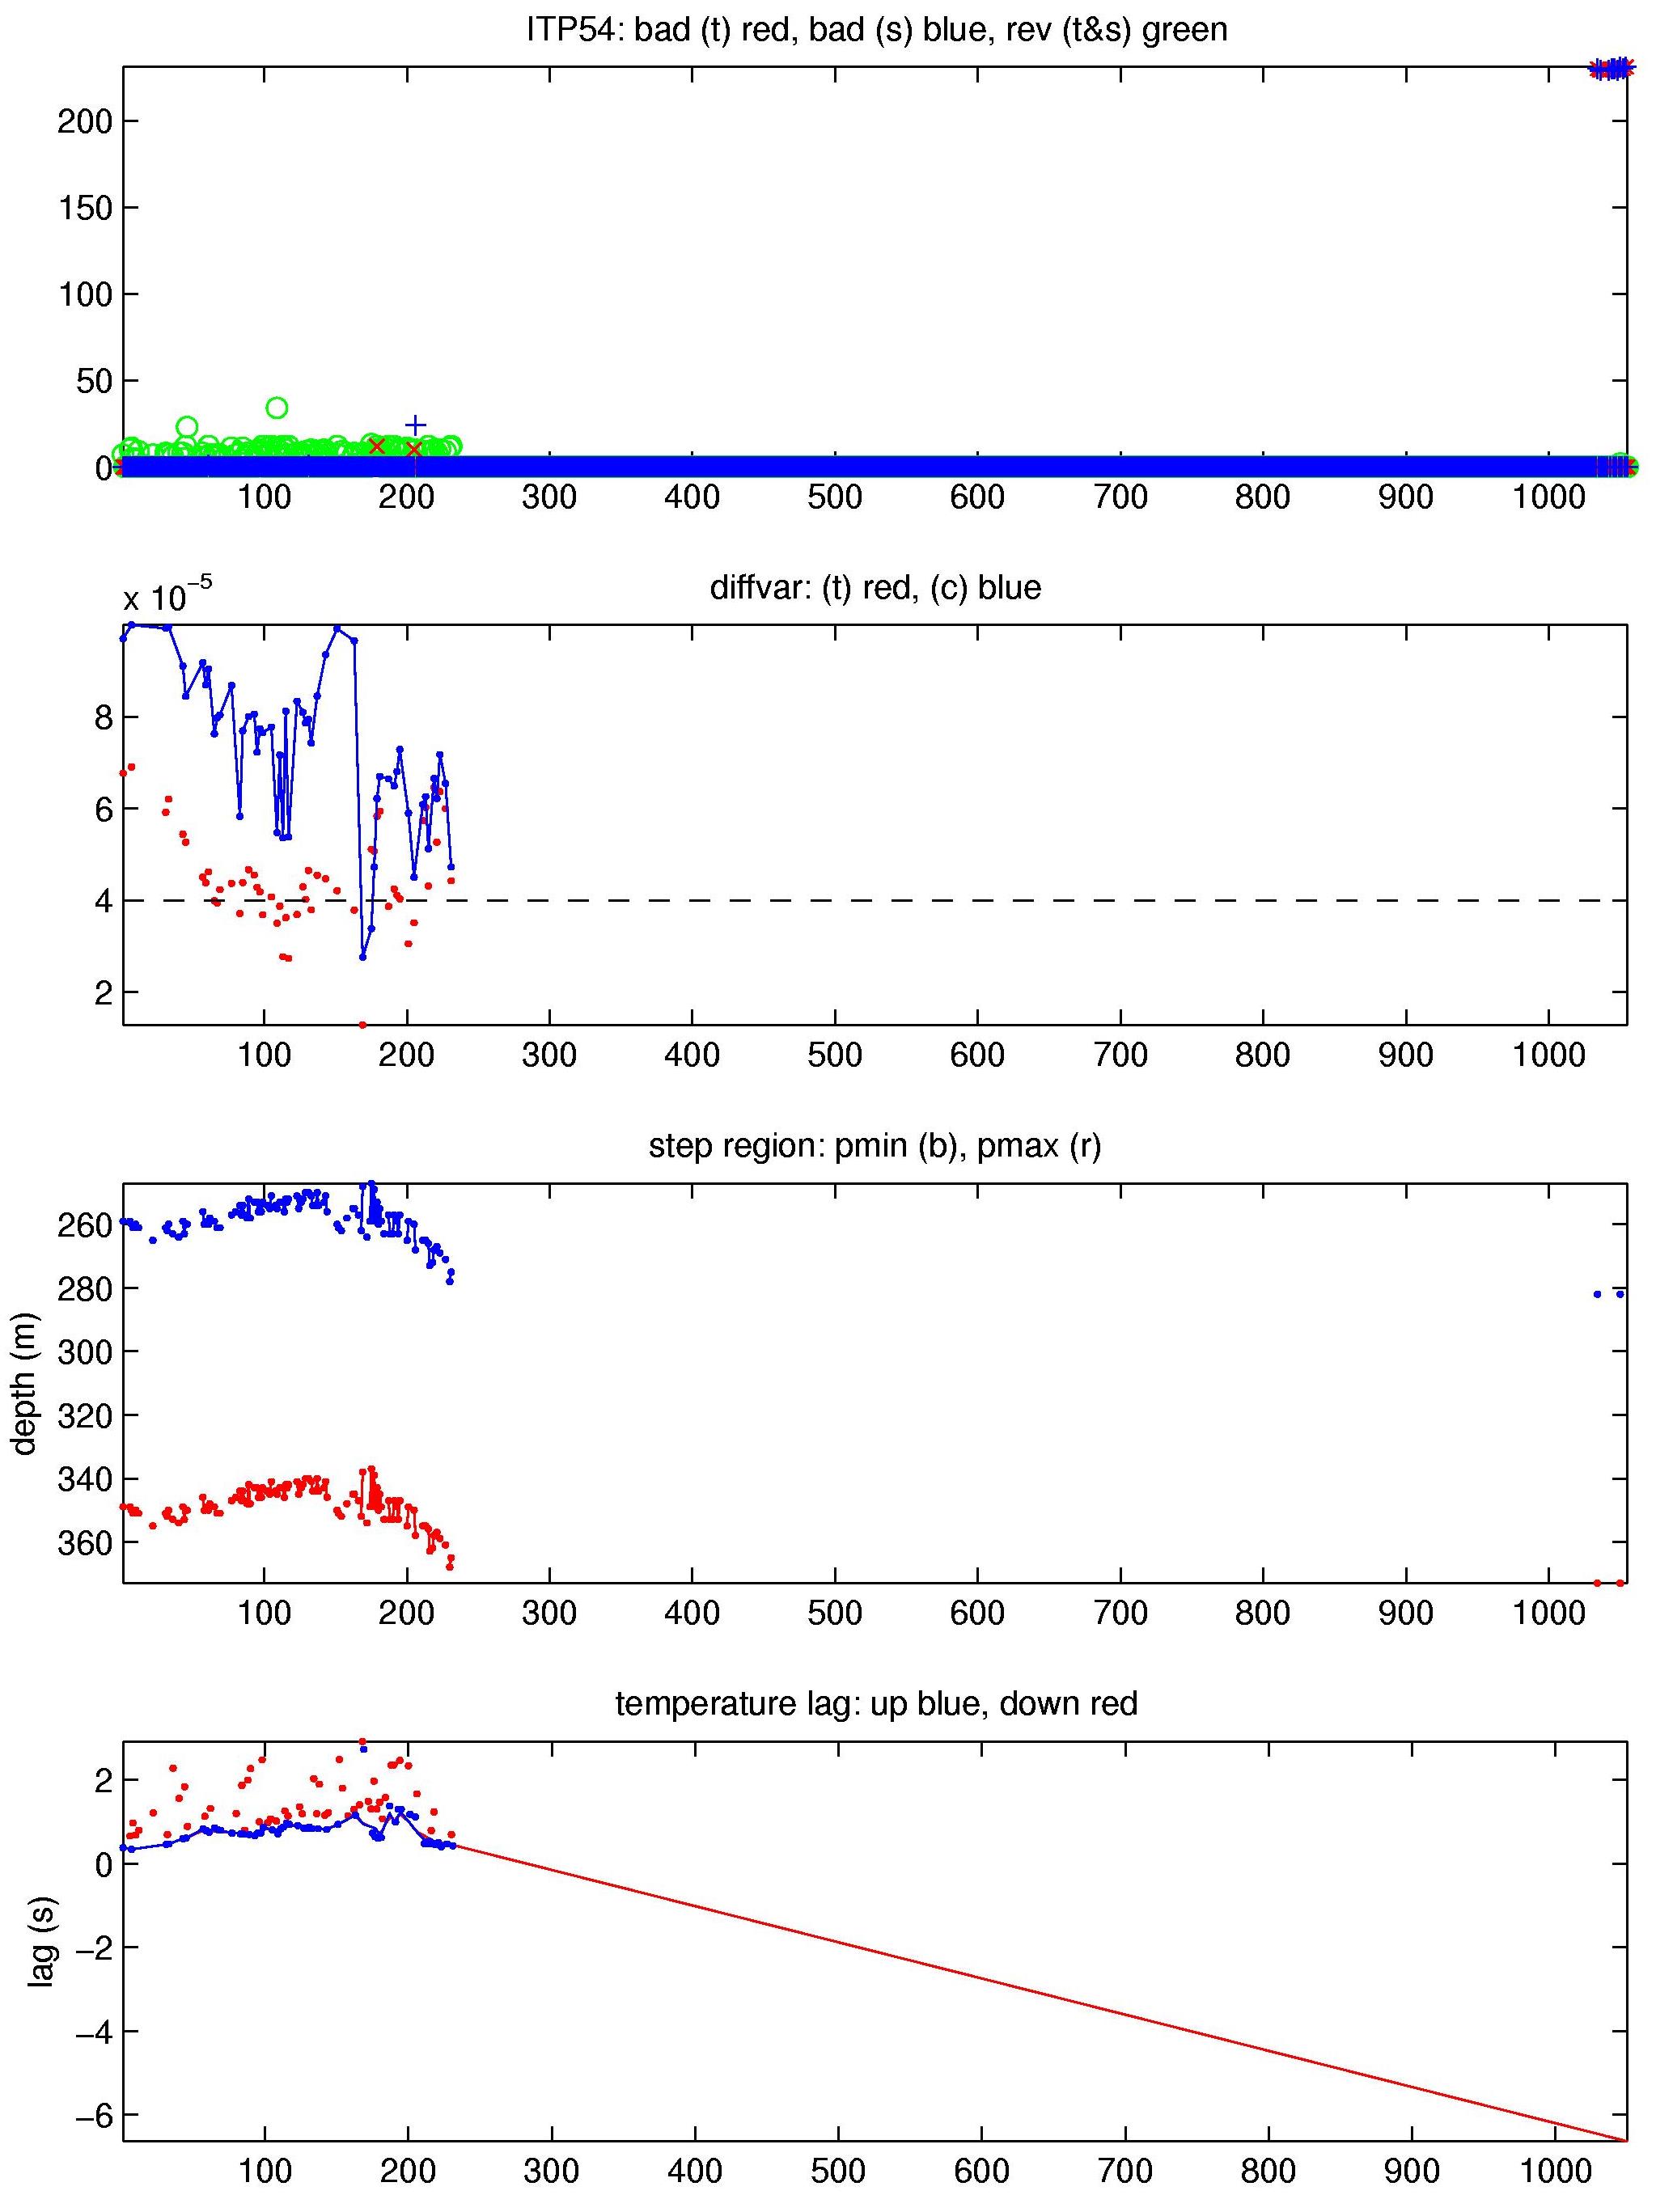
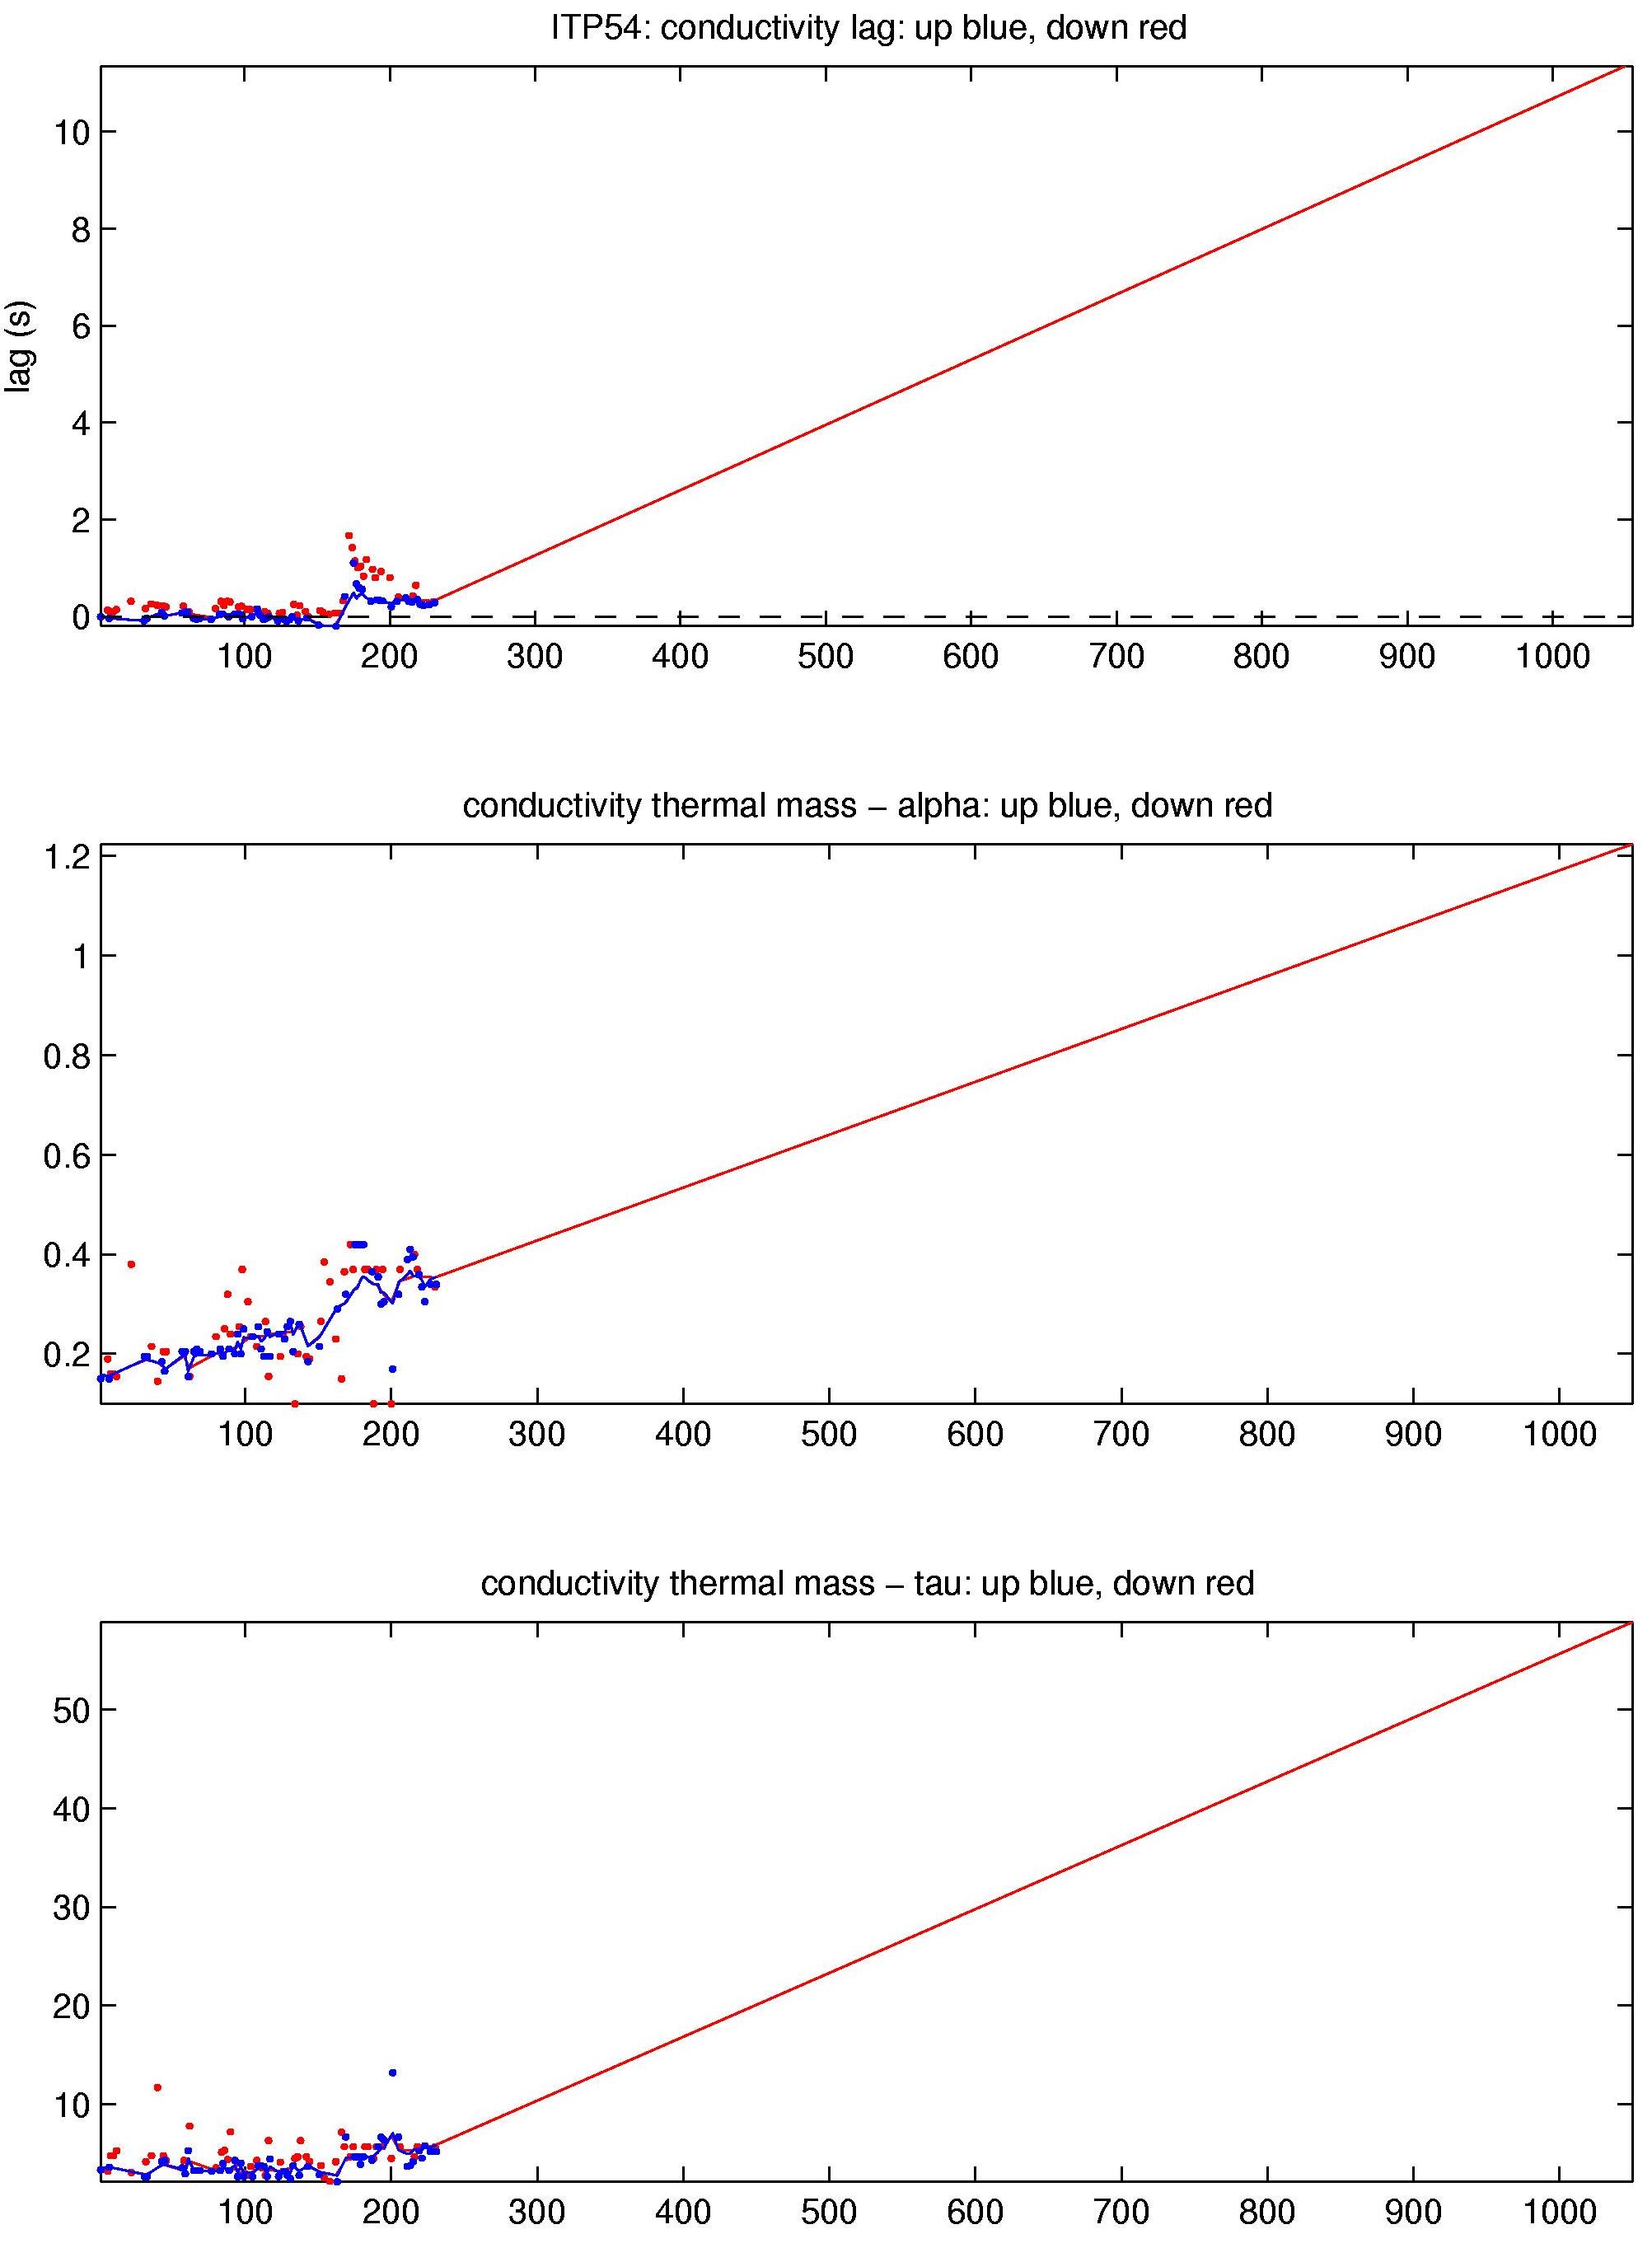
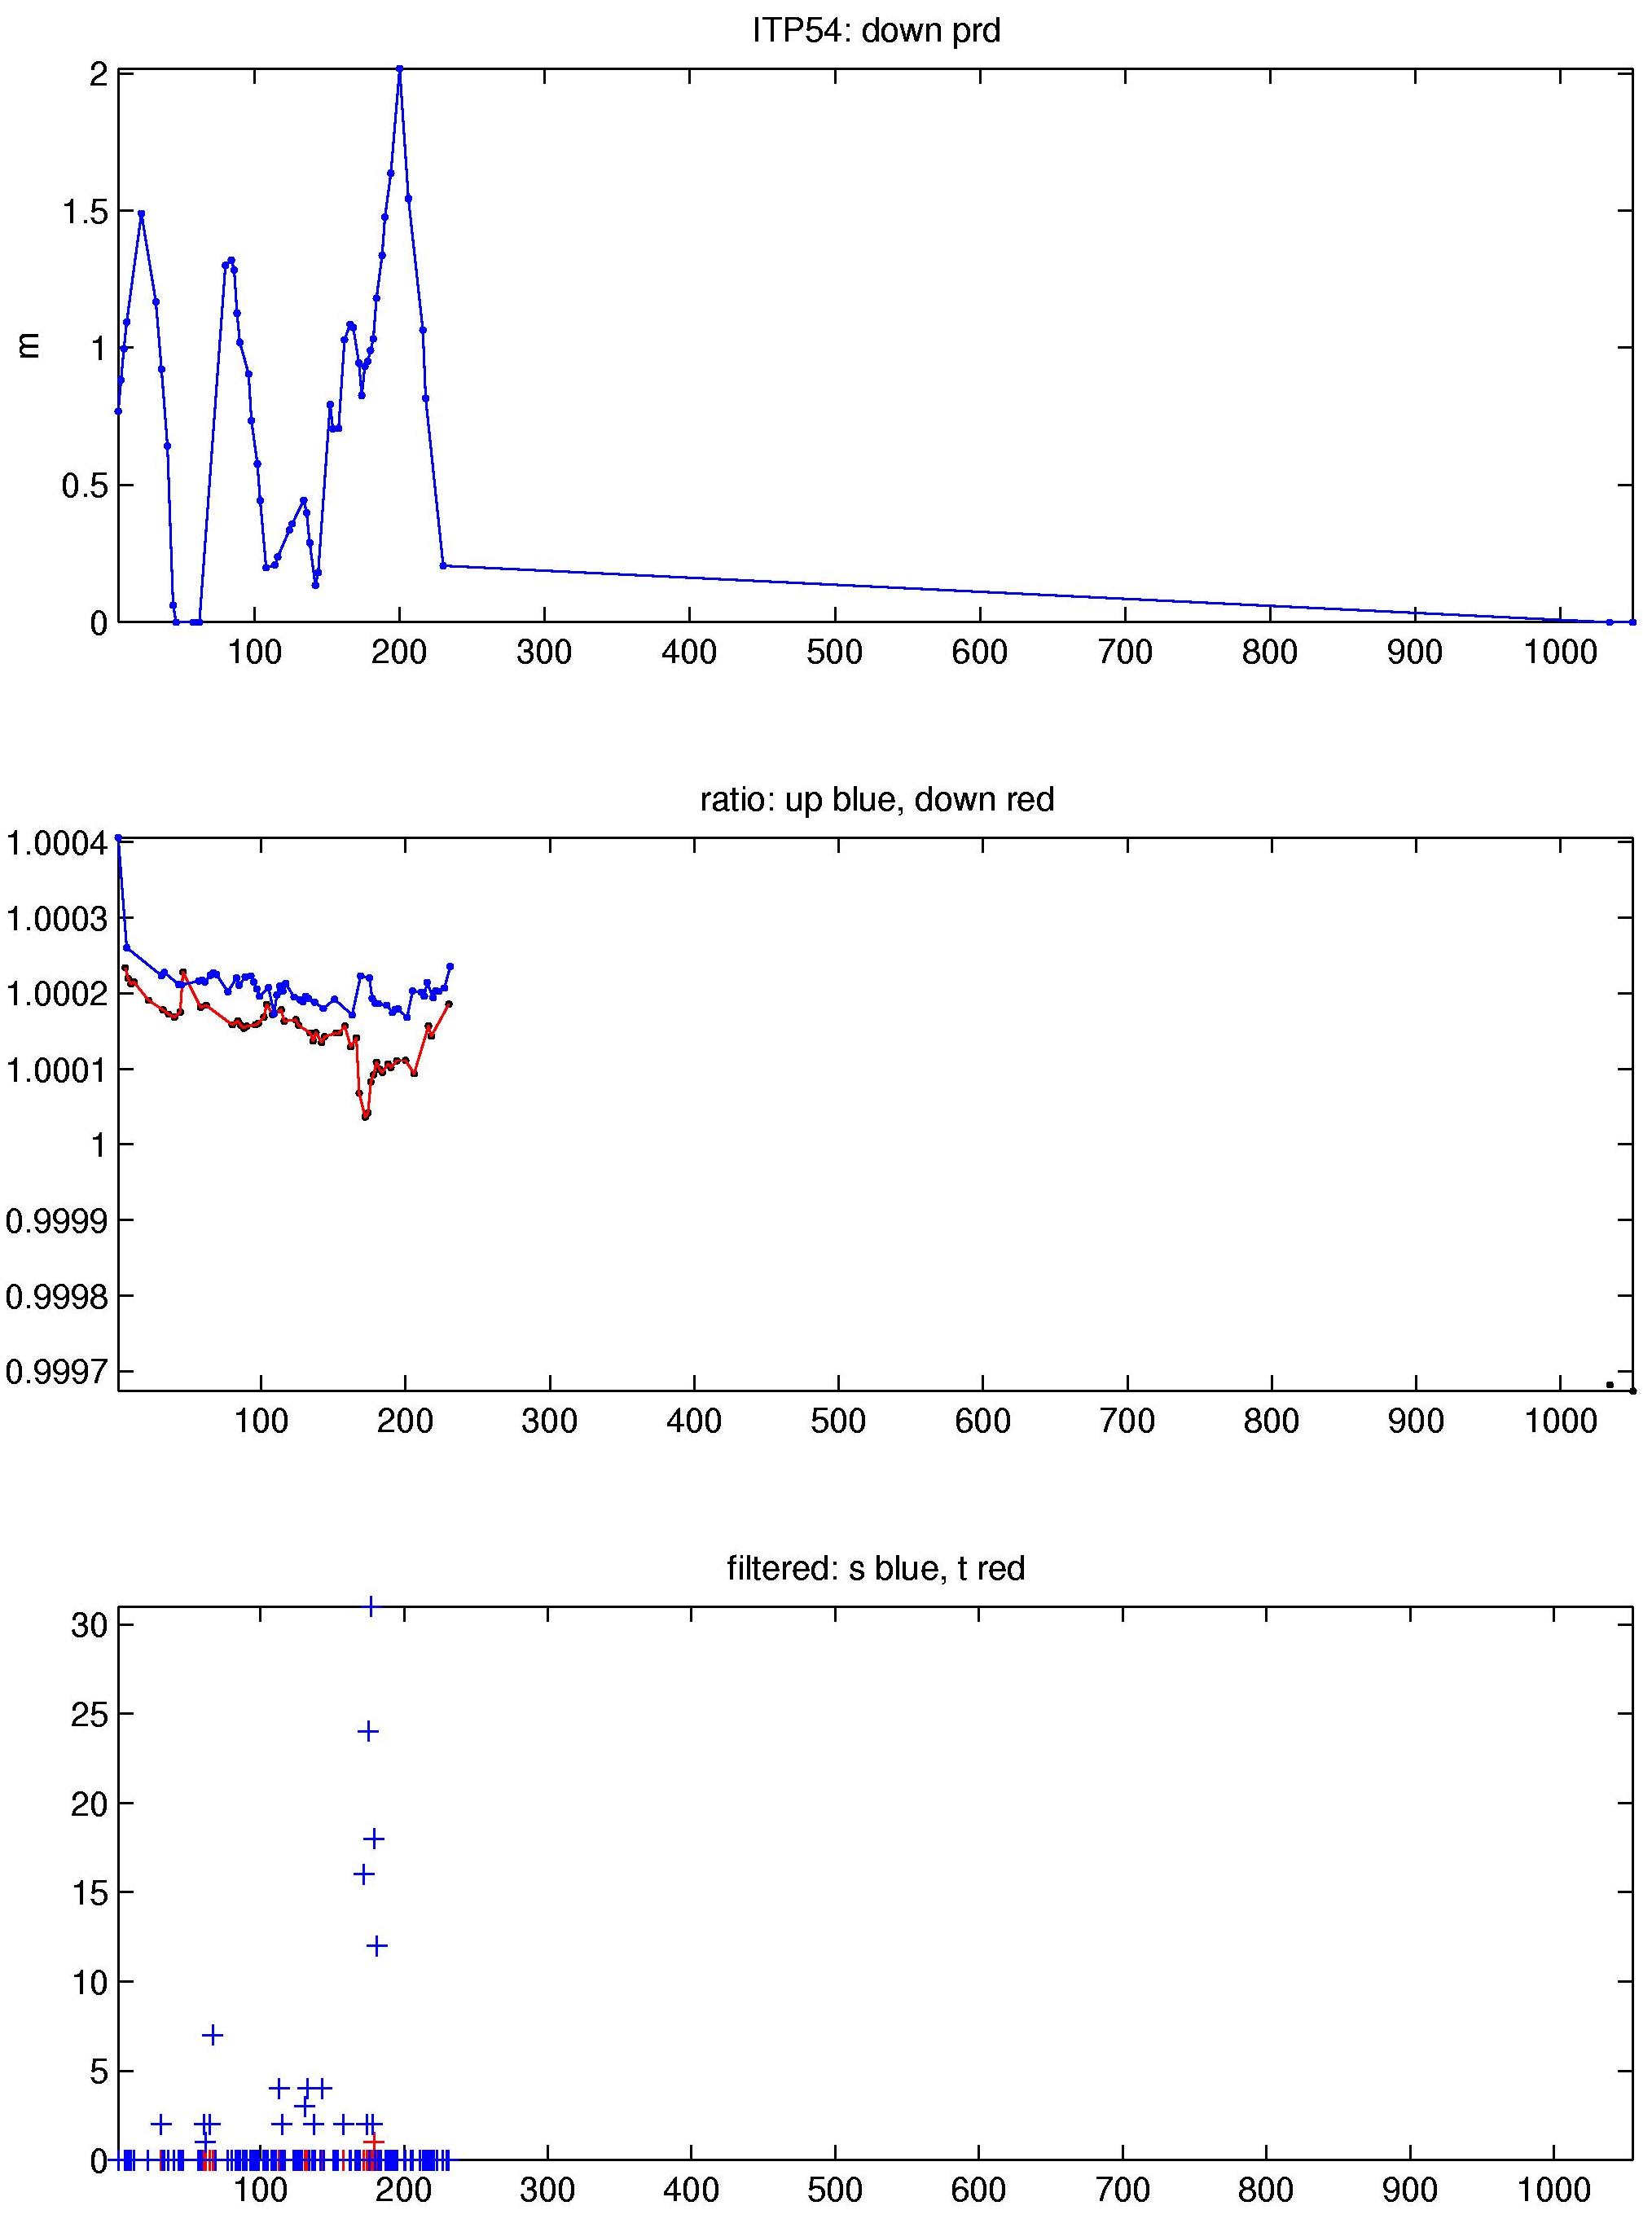
Out of the 1055 profiles that were apparently performed by the ITP profiler, software problems with the inductive modem circuit prevented all except for 106 of the CTD profiles from being received by the surface package which were subsequently telemetered. These were processed according to the procedures described in the ITP Updated Data Processing Procedures. The processing parameters for are shown in the figures to the right. Of the profiles communicated to the surface package, buoy drift speeds were almost always less than 30 cm/s so the profiler covered close to the full vertical extent except for a few profiles.
This particular ITP was the first outfit with the newer IMM hardware rather than the SIM/UIM configuration of earlier units in order to allow a Microcat to be added to the tether at a fixed depth and that higher temporal resolution (15 minute) T&S data to also be communicated to the surface package on the same circuit. However, in this prototype the shorter engineering files were able to be conveyed to the surface unit, but the longer CTD files often timed out before being successfully sent. Consequently, the 106 CTD profiles received were within the first 230 profiles that the profiler conducted, but were not all consecutive and included gaps. Thermohaline staircases were present during the time series, enabling CTD lag correction estimates. The lags started in typical ranges but drifted, particularly after profile 163.
Communications between the surface unit and Microcat were better, and all samples were received for the first 170 days (until January 23, 2012). Then there was a gap of over 225 days (until June 5, 2012) until the next samples from the Microcat were received by the surface package. Subsequent gaps occurred between July 12, 2013 and September 8, 2013 (58 days), September 16, 2013 and June 15, 2014 (272 days), and June 23, 2014 and June 25, 2014 (1 day). The last Microcat data were acquired on July 5, 2014. No corrections have been applied to the Microcat T&S data.
See the Data Products tab to the left for descriptions of the three levels (I, II, III) of data processing and to access all data.
