ITP62 Data Processing
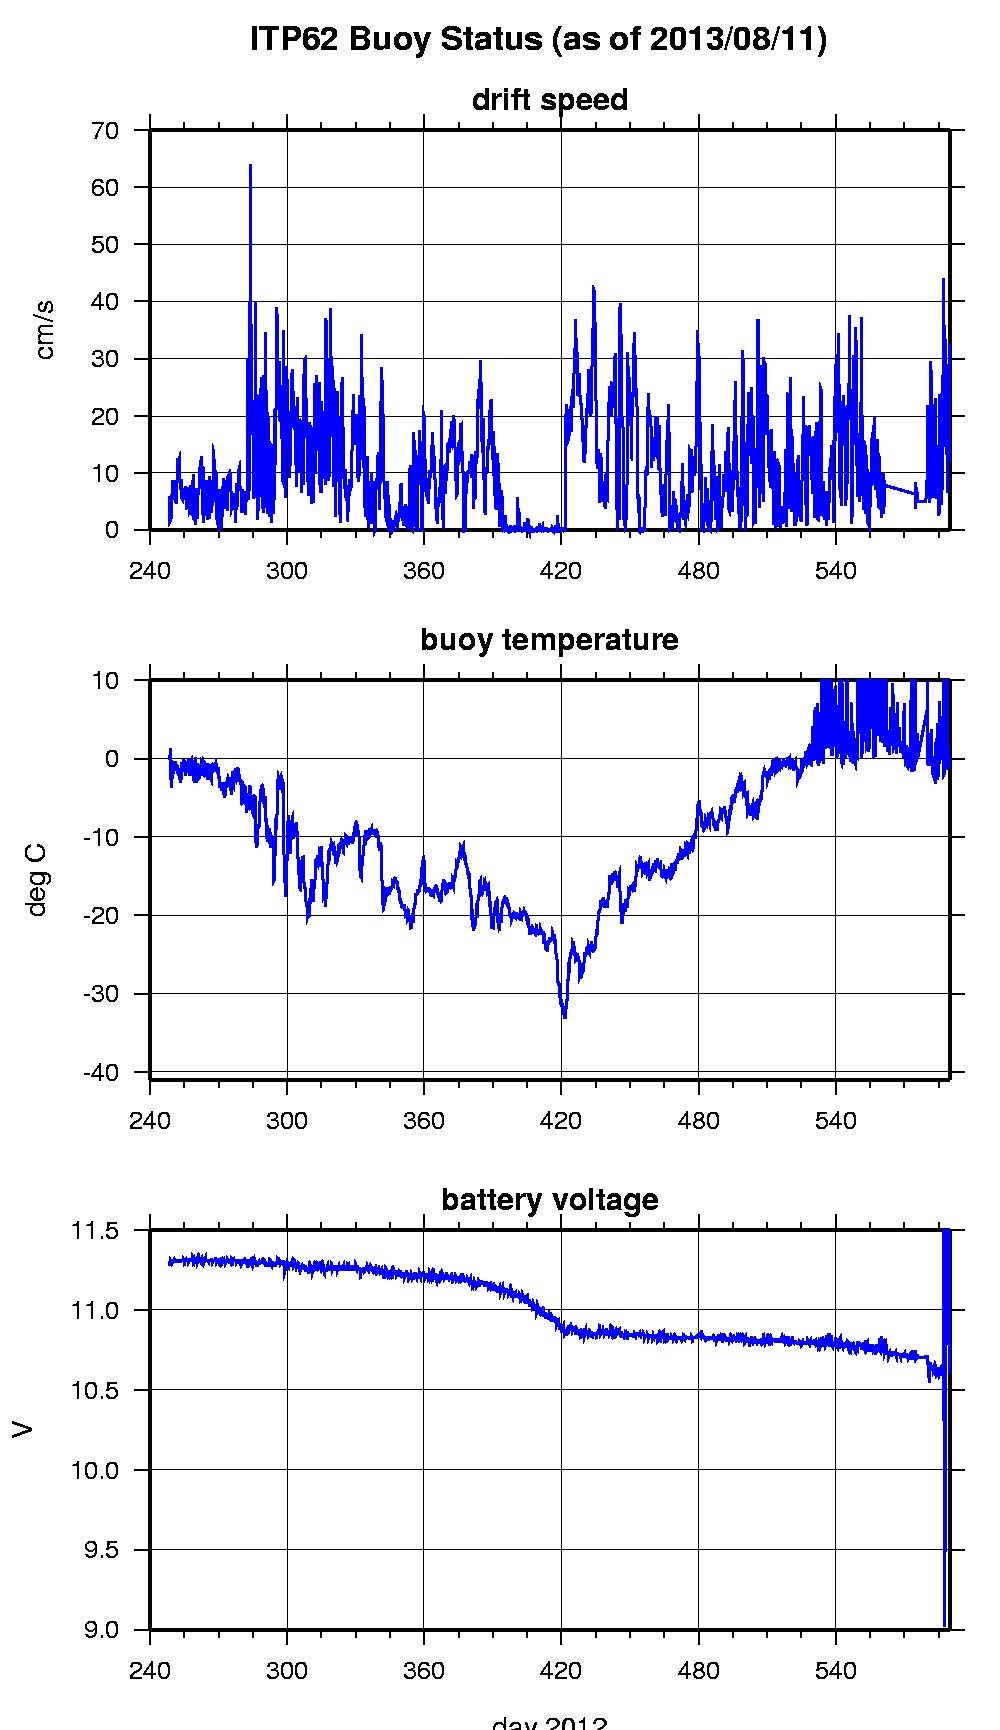
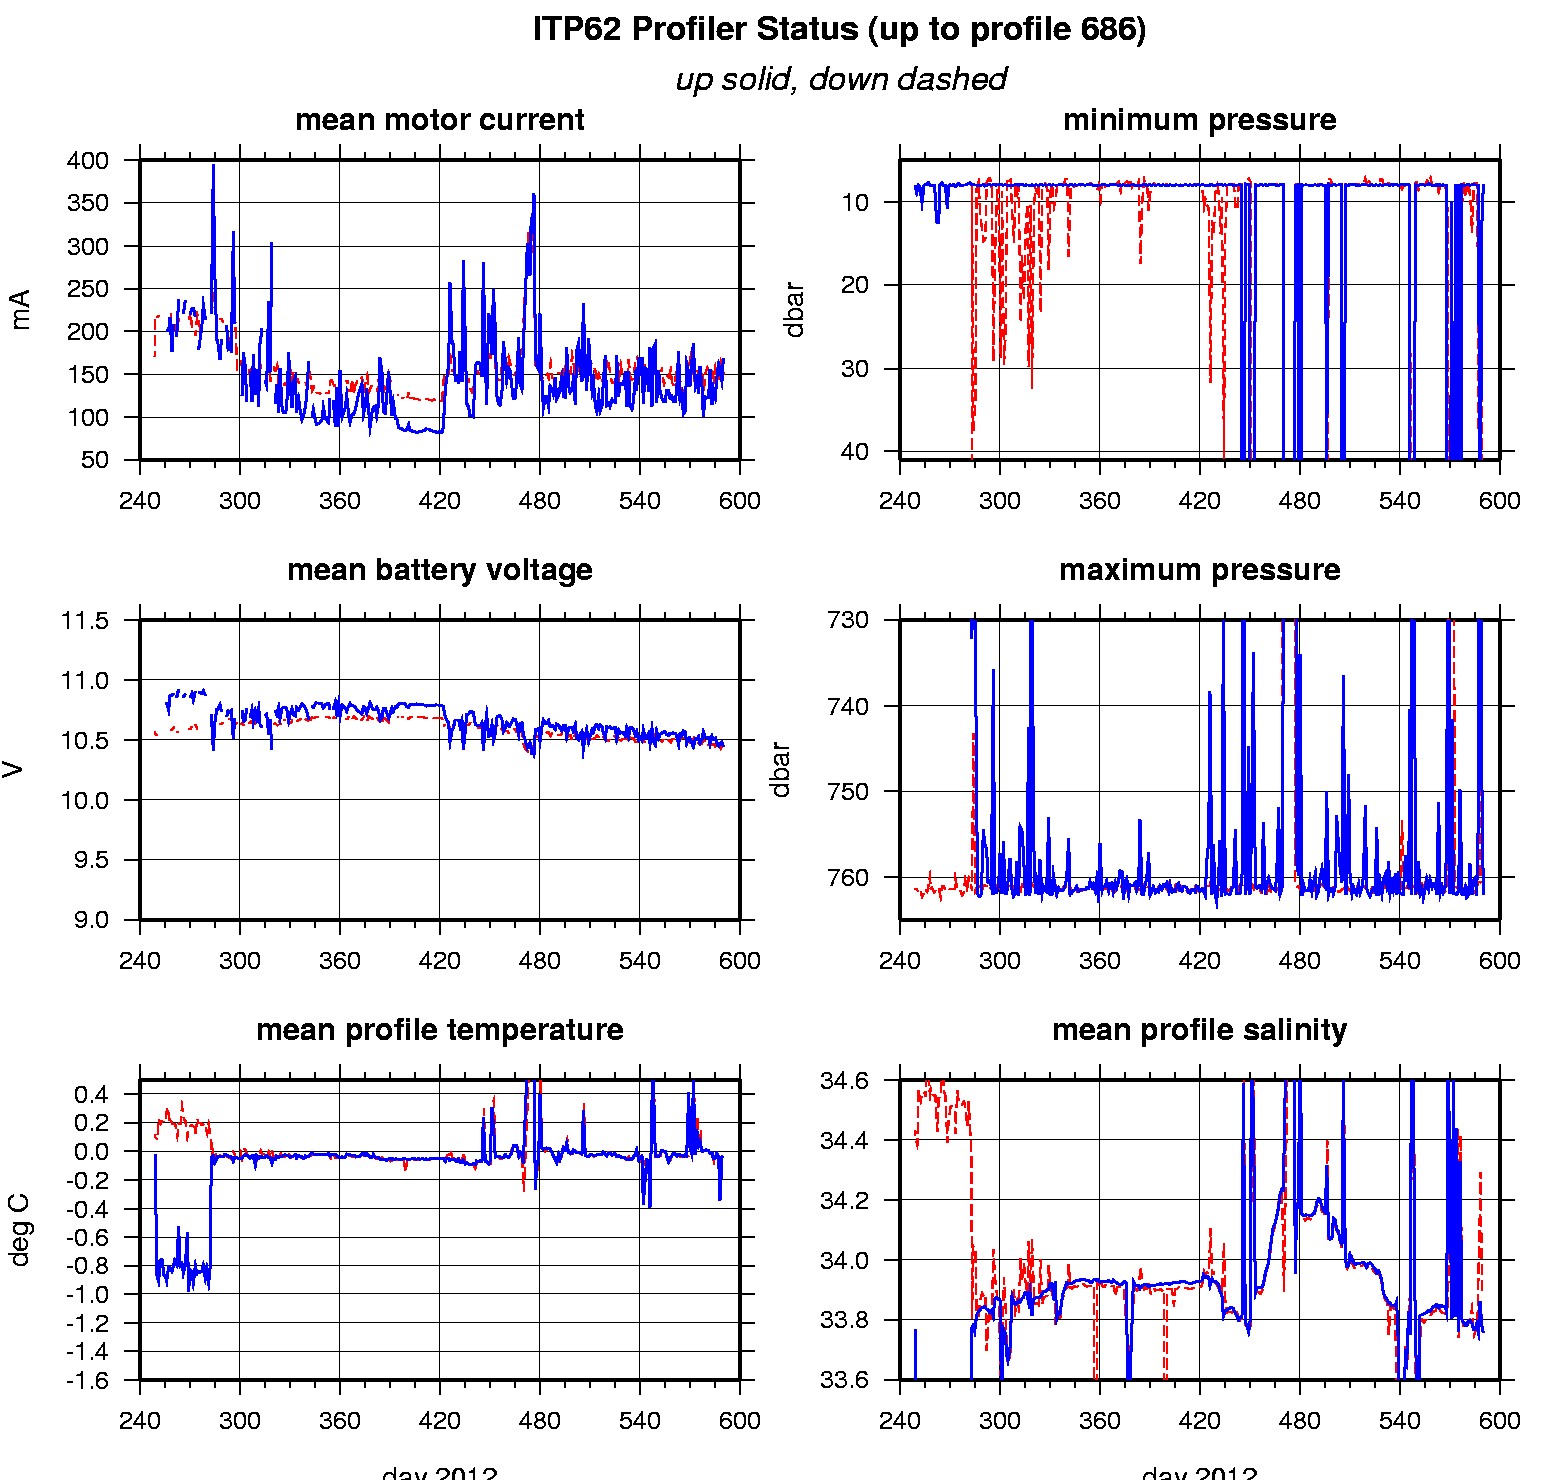
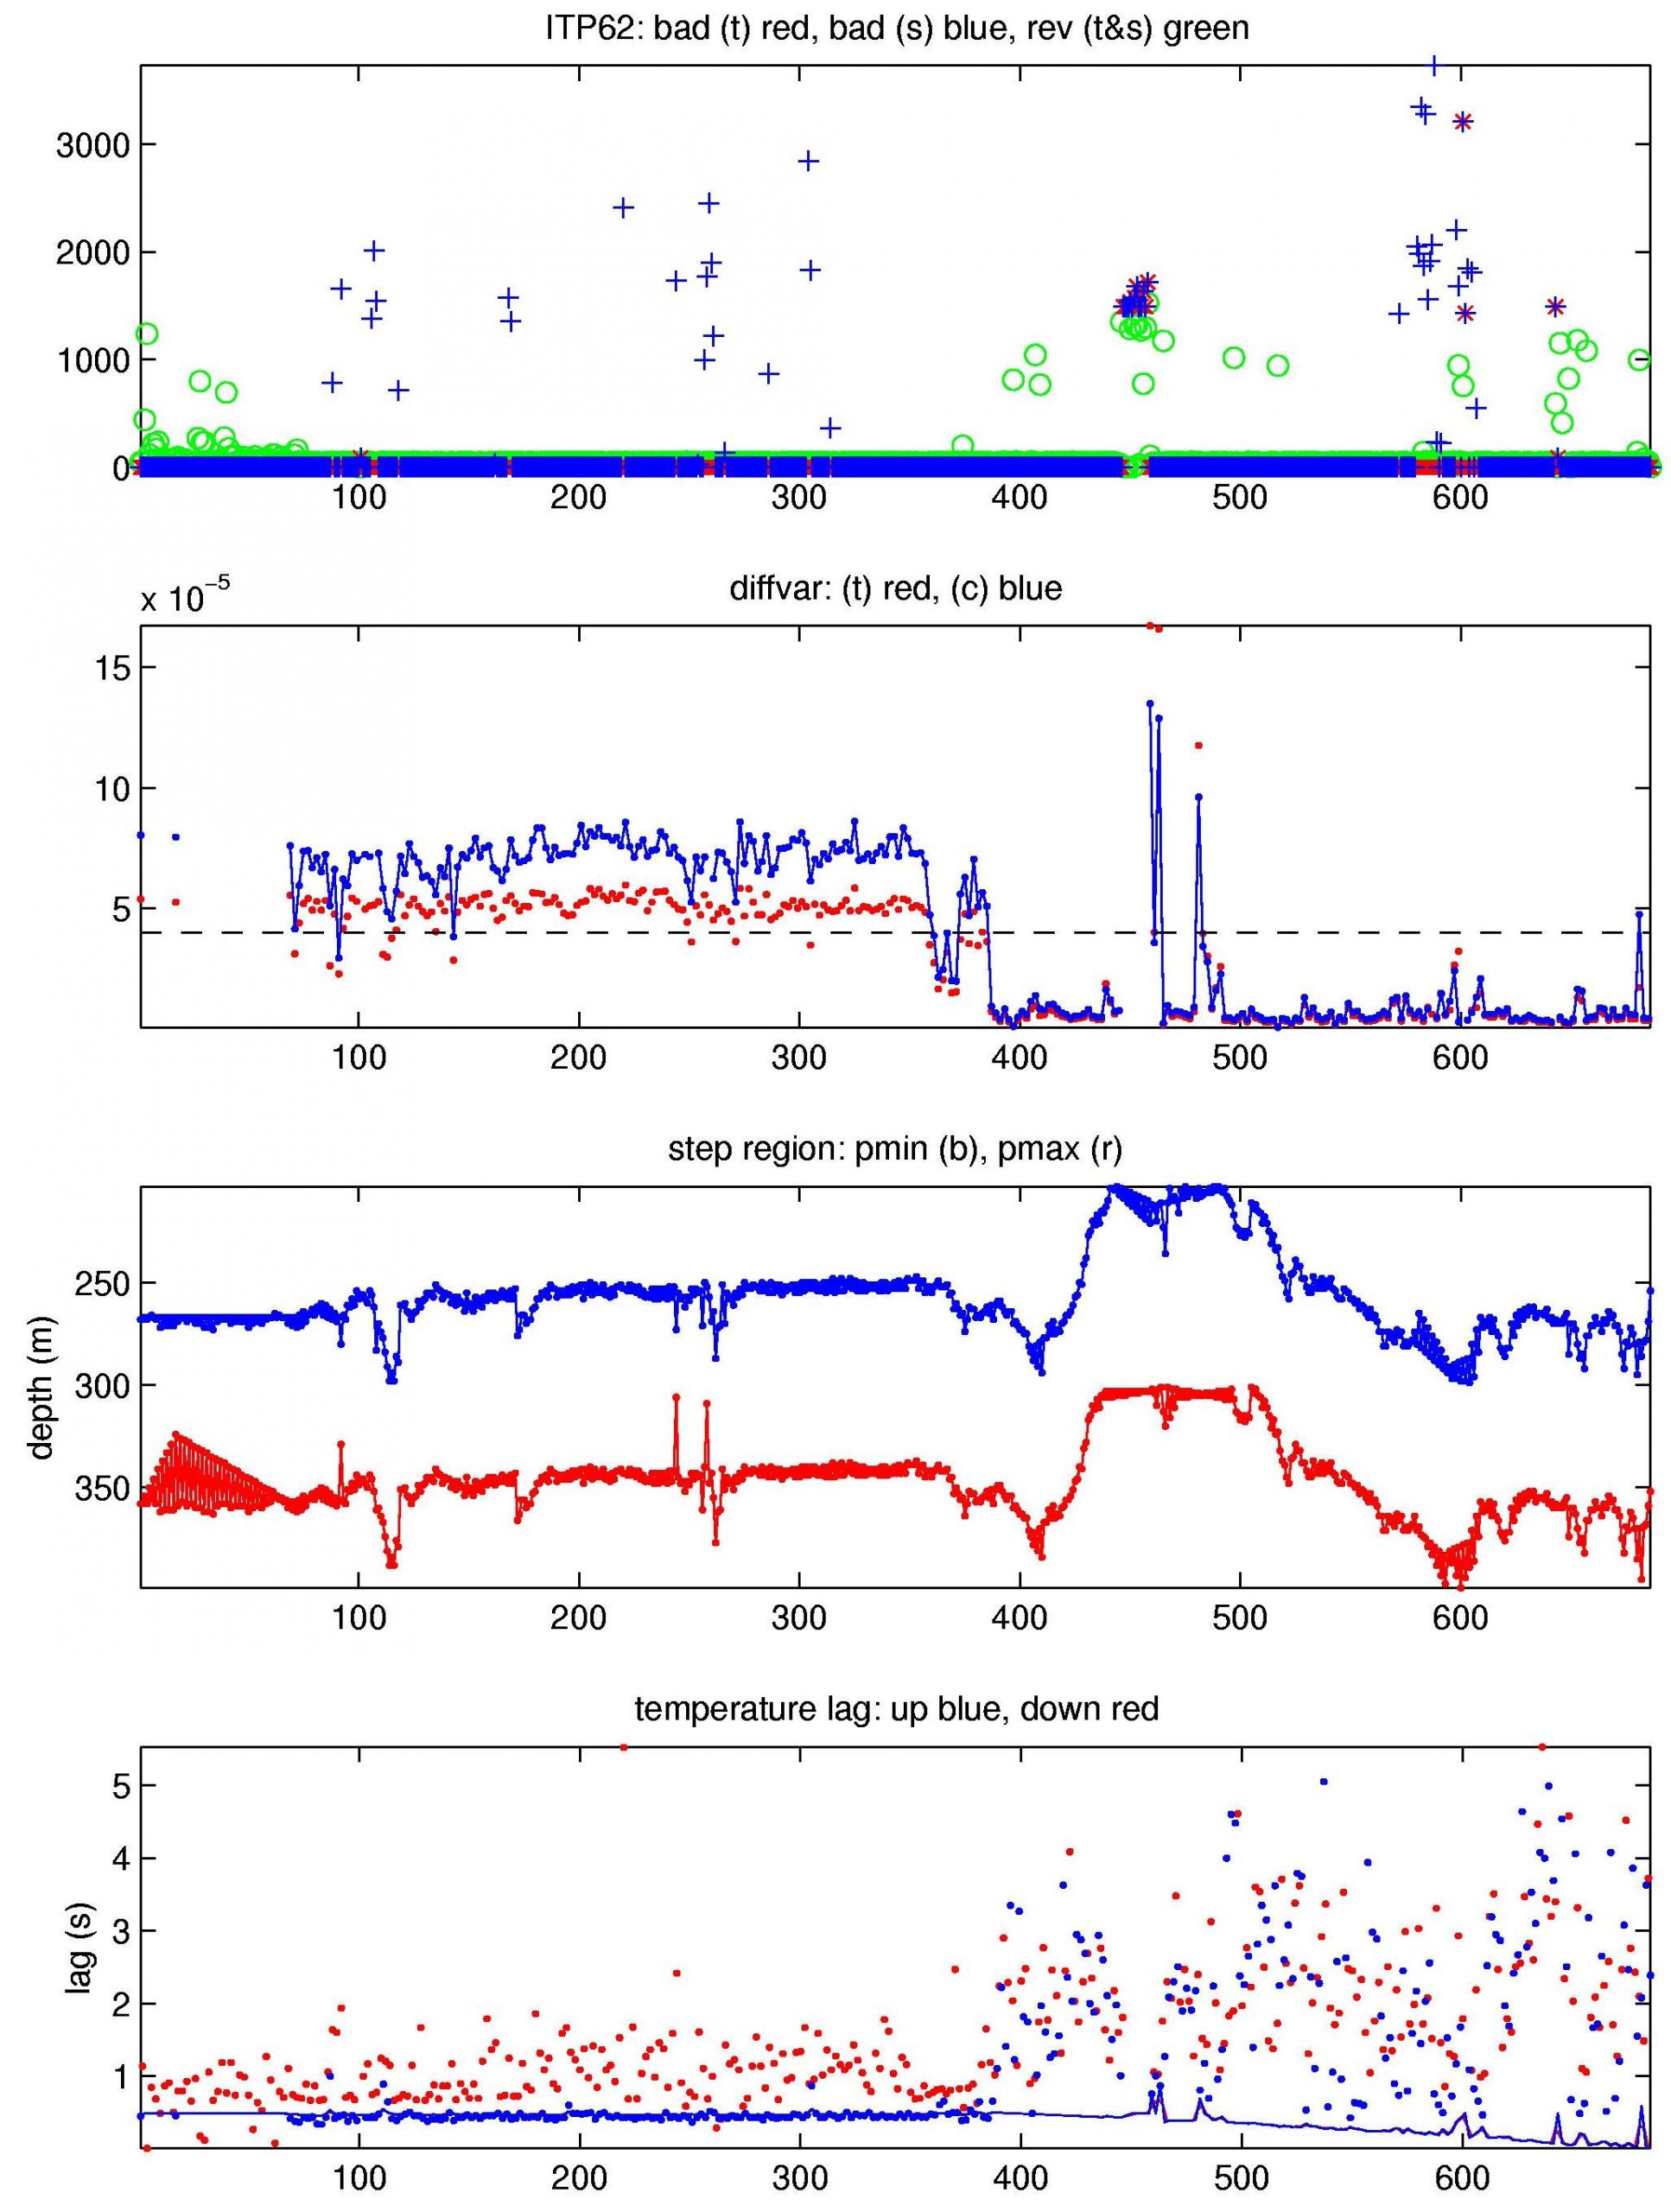
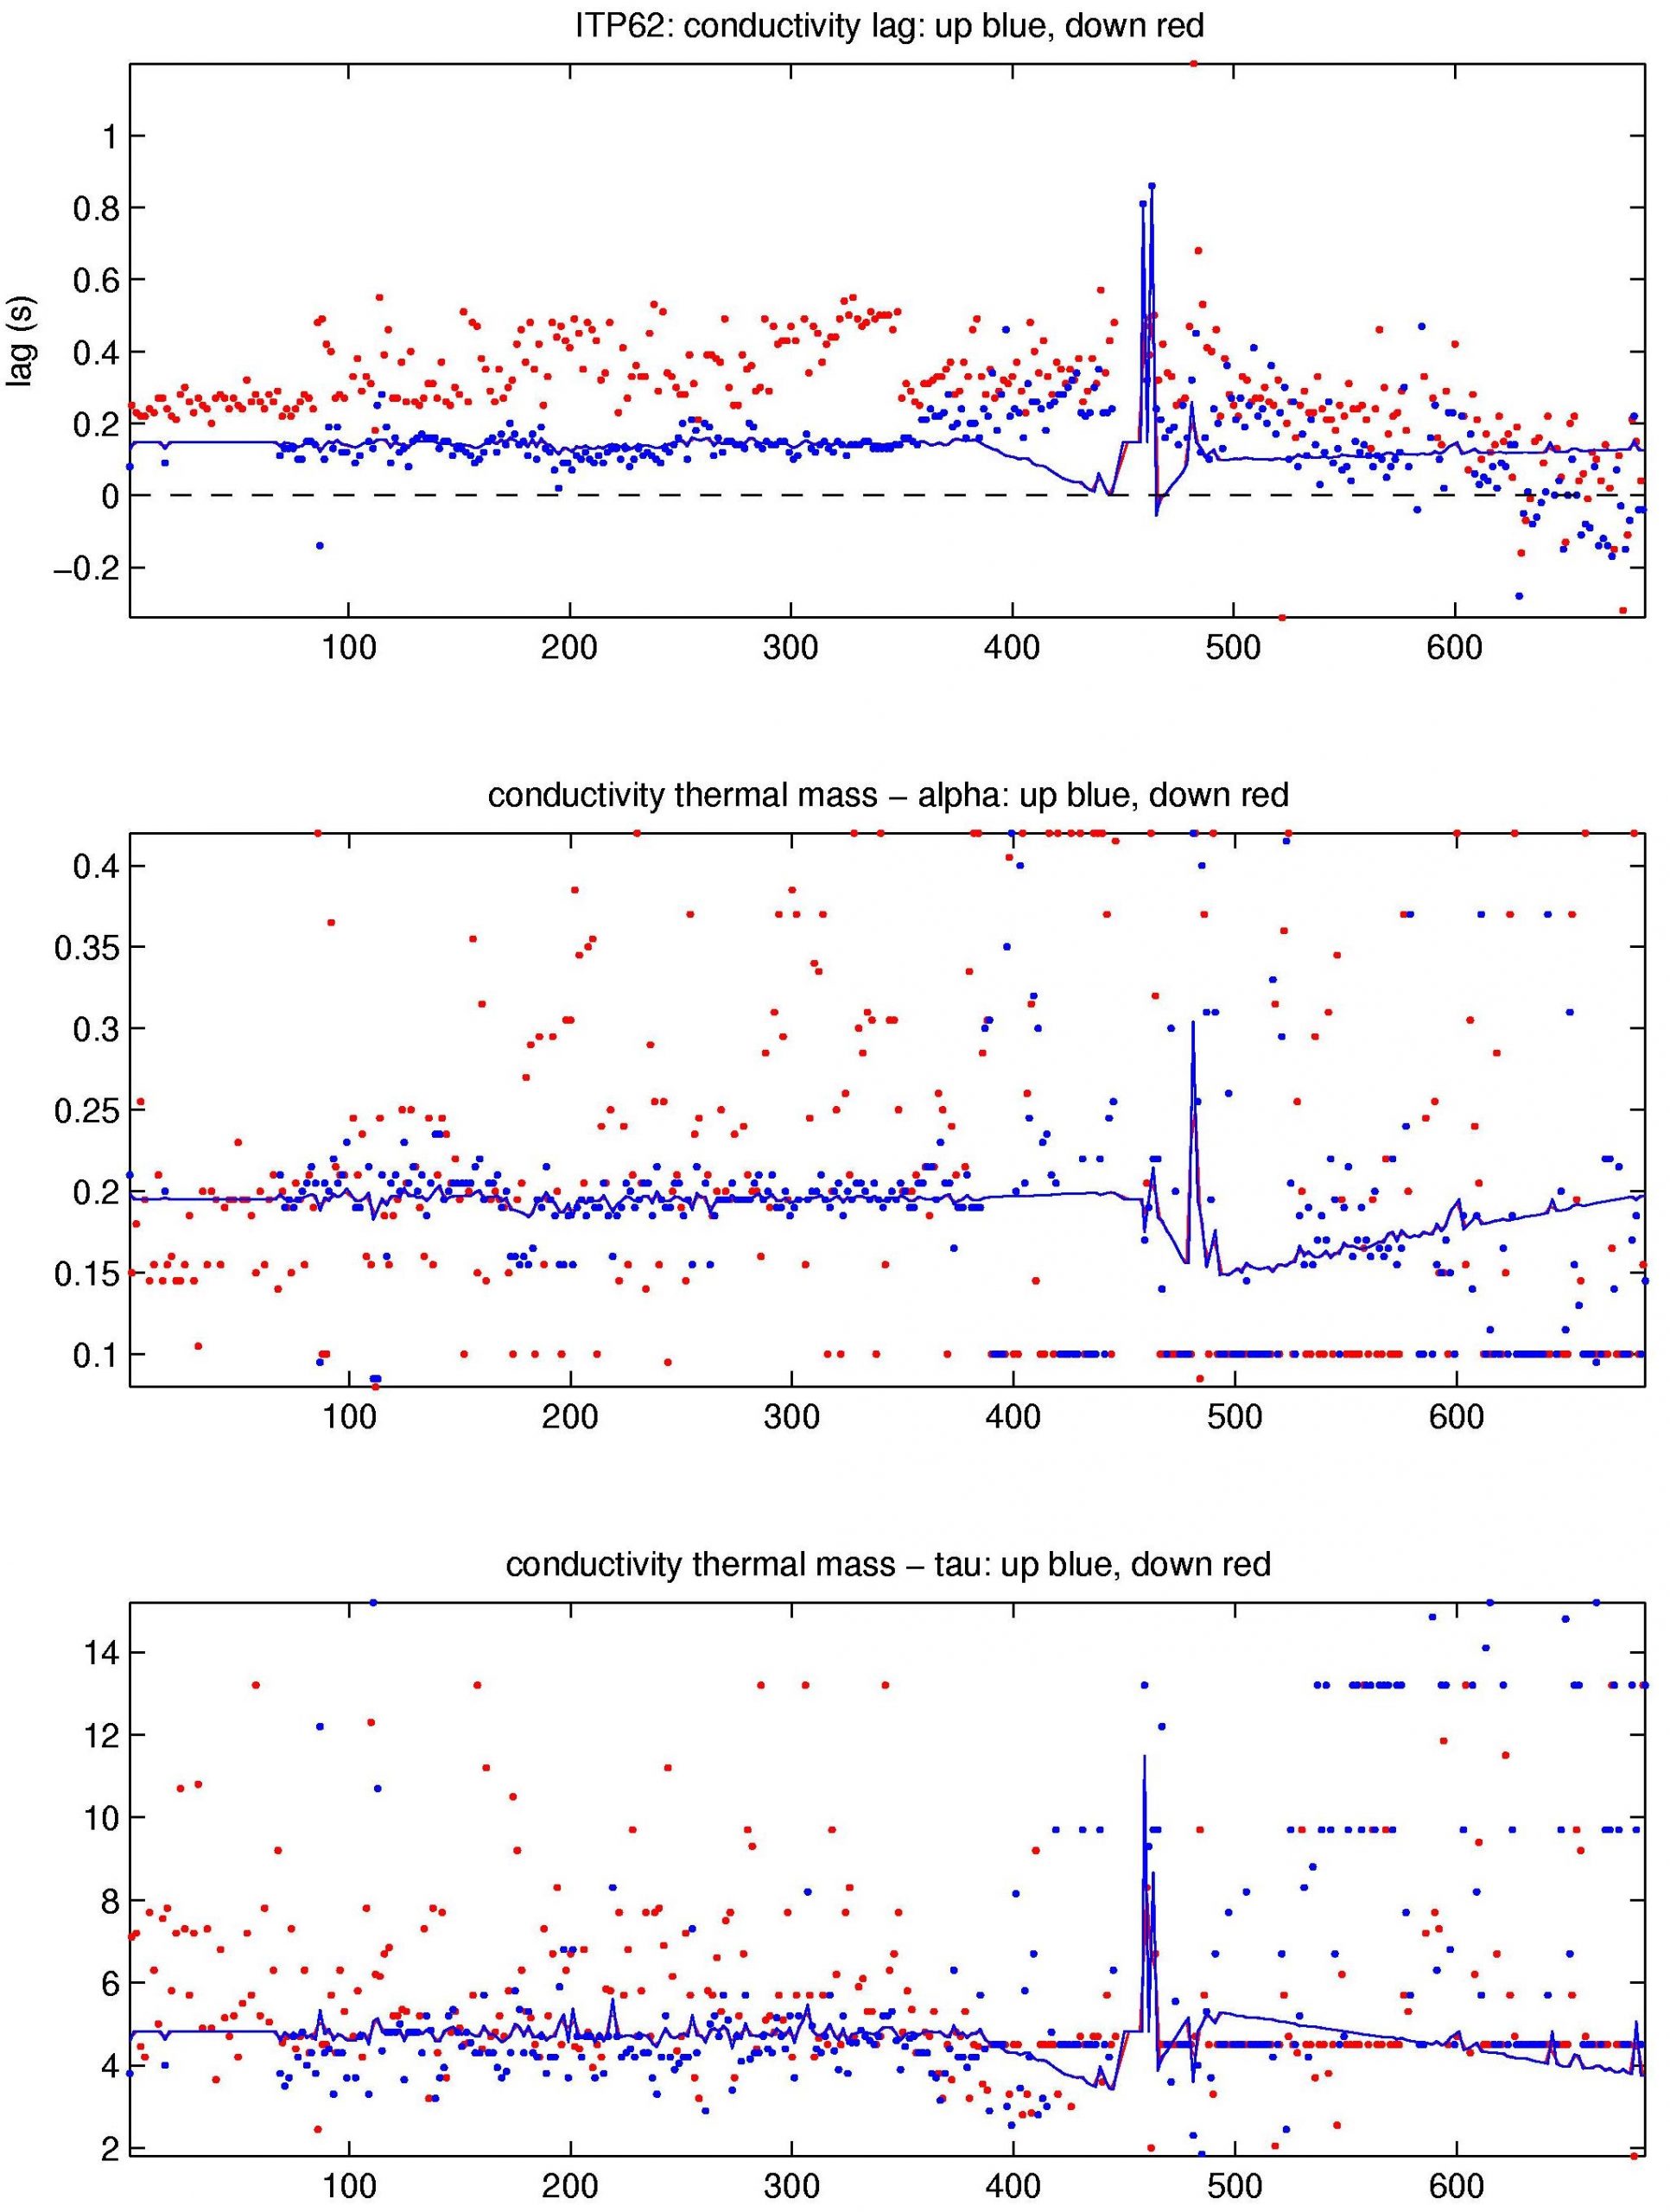
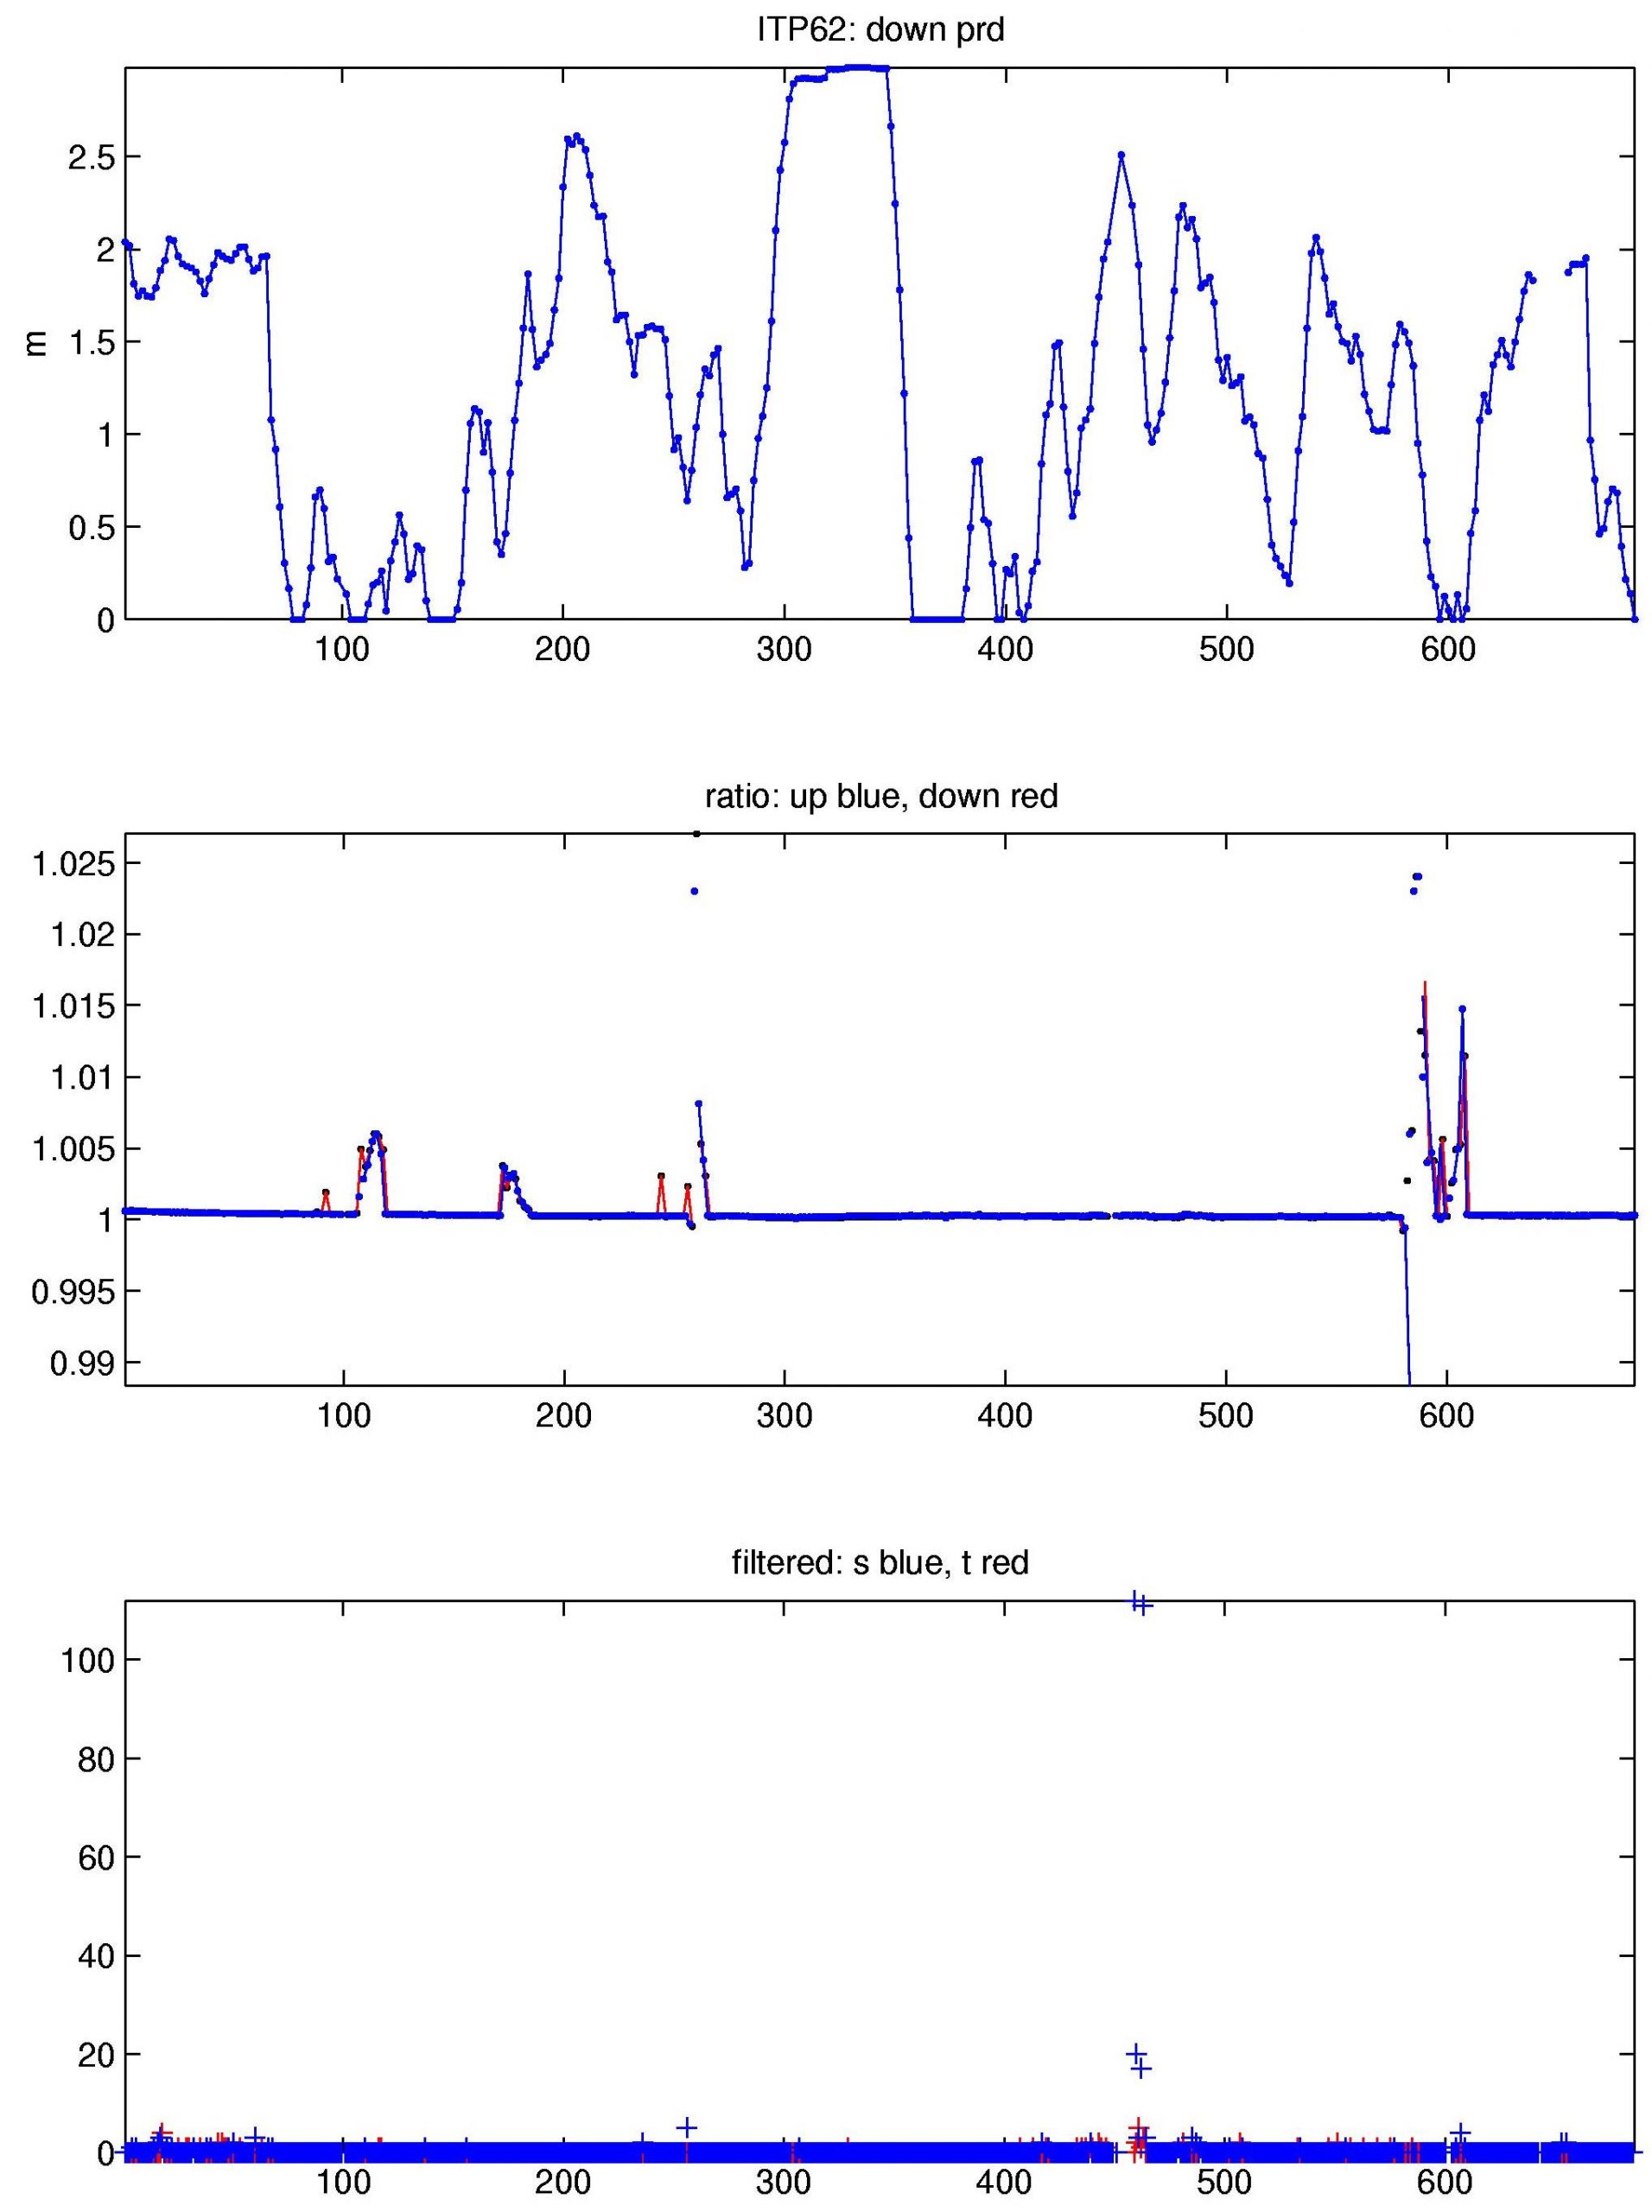
The 686 profiles that were transmitted from the ITP were processed according to the procedures described in the ITP Updated Data Processing Procedures. The processing parameters for are shown in the figures to the right. During the first month after deployment presumably wave motion caused the profiler to move up or down the wire (to neutral buoyancy depth) between profiles so that only partial down or up profiles were acquired. Subsequently when the ice froze in around the buoy, full profiles were obtained. Only few did not traverse the full vertical extent, except during a 5 day period in May 2013 when apparently the mooring anchor dragged on the slope near Barrow Canyon. During this time, slack on the cable left the profiler at mid depth without enough tension to climb, but recovered when the system fortuitously moved off of the shelf with the cable and anchor seemingly intact.
Thermohaline staircases were apparent in the basin, and used to generate initial estimates for CTD lag corrections which were typical. However, both the temperature and conductivity steps diminished after profile 390 and lags had to be extrapolated later.
See the Data Products tab to the left for descriptions of the three levels (I, II, III) of data processing and to access all data.
