ITP61 Data Processing
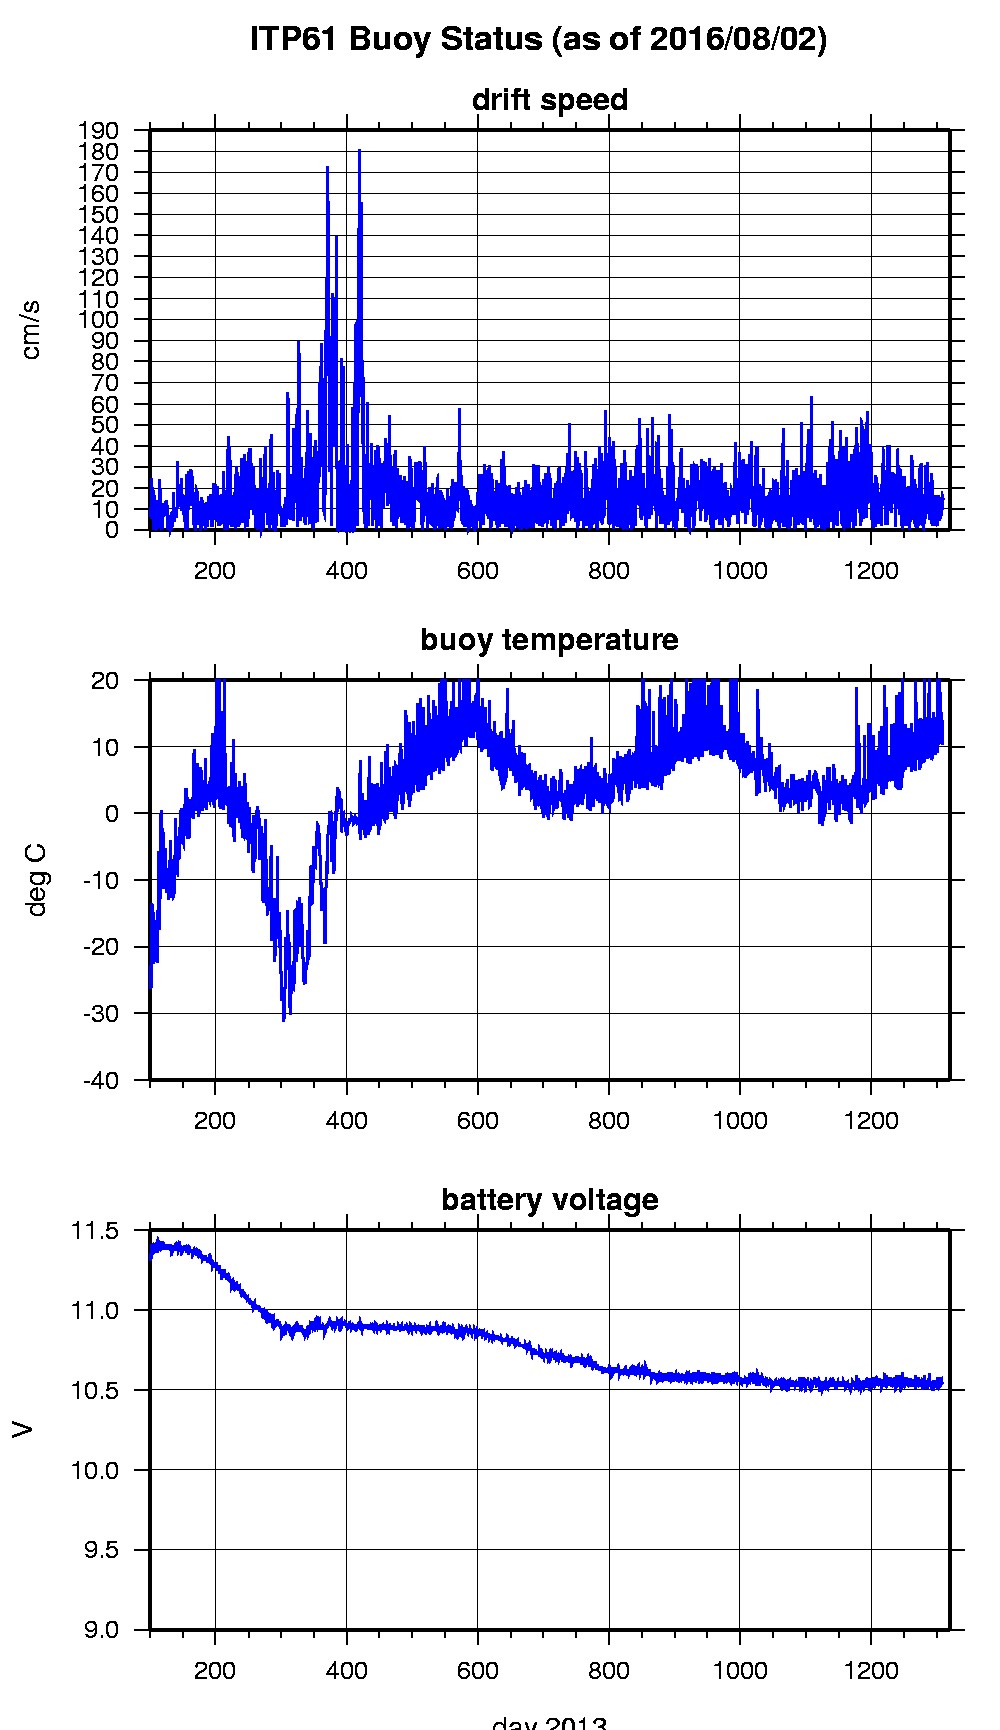
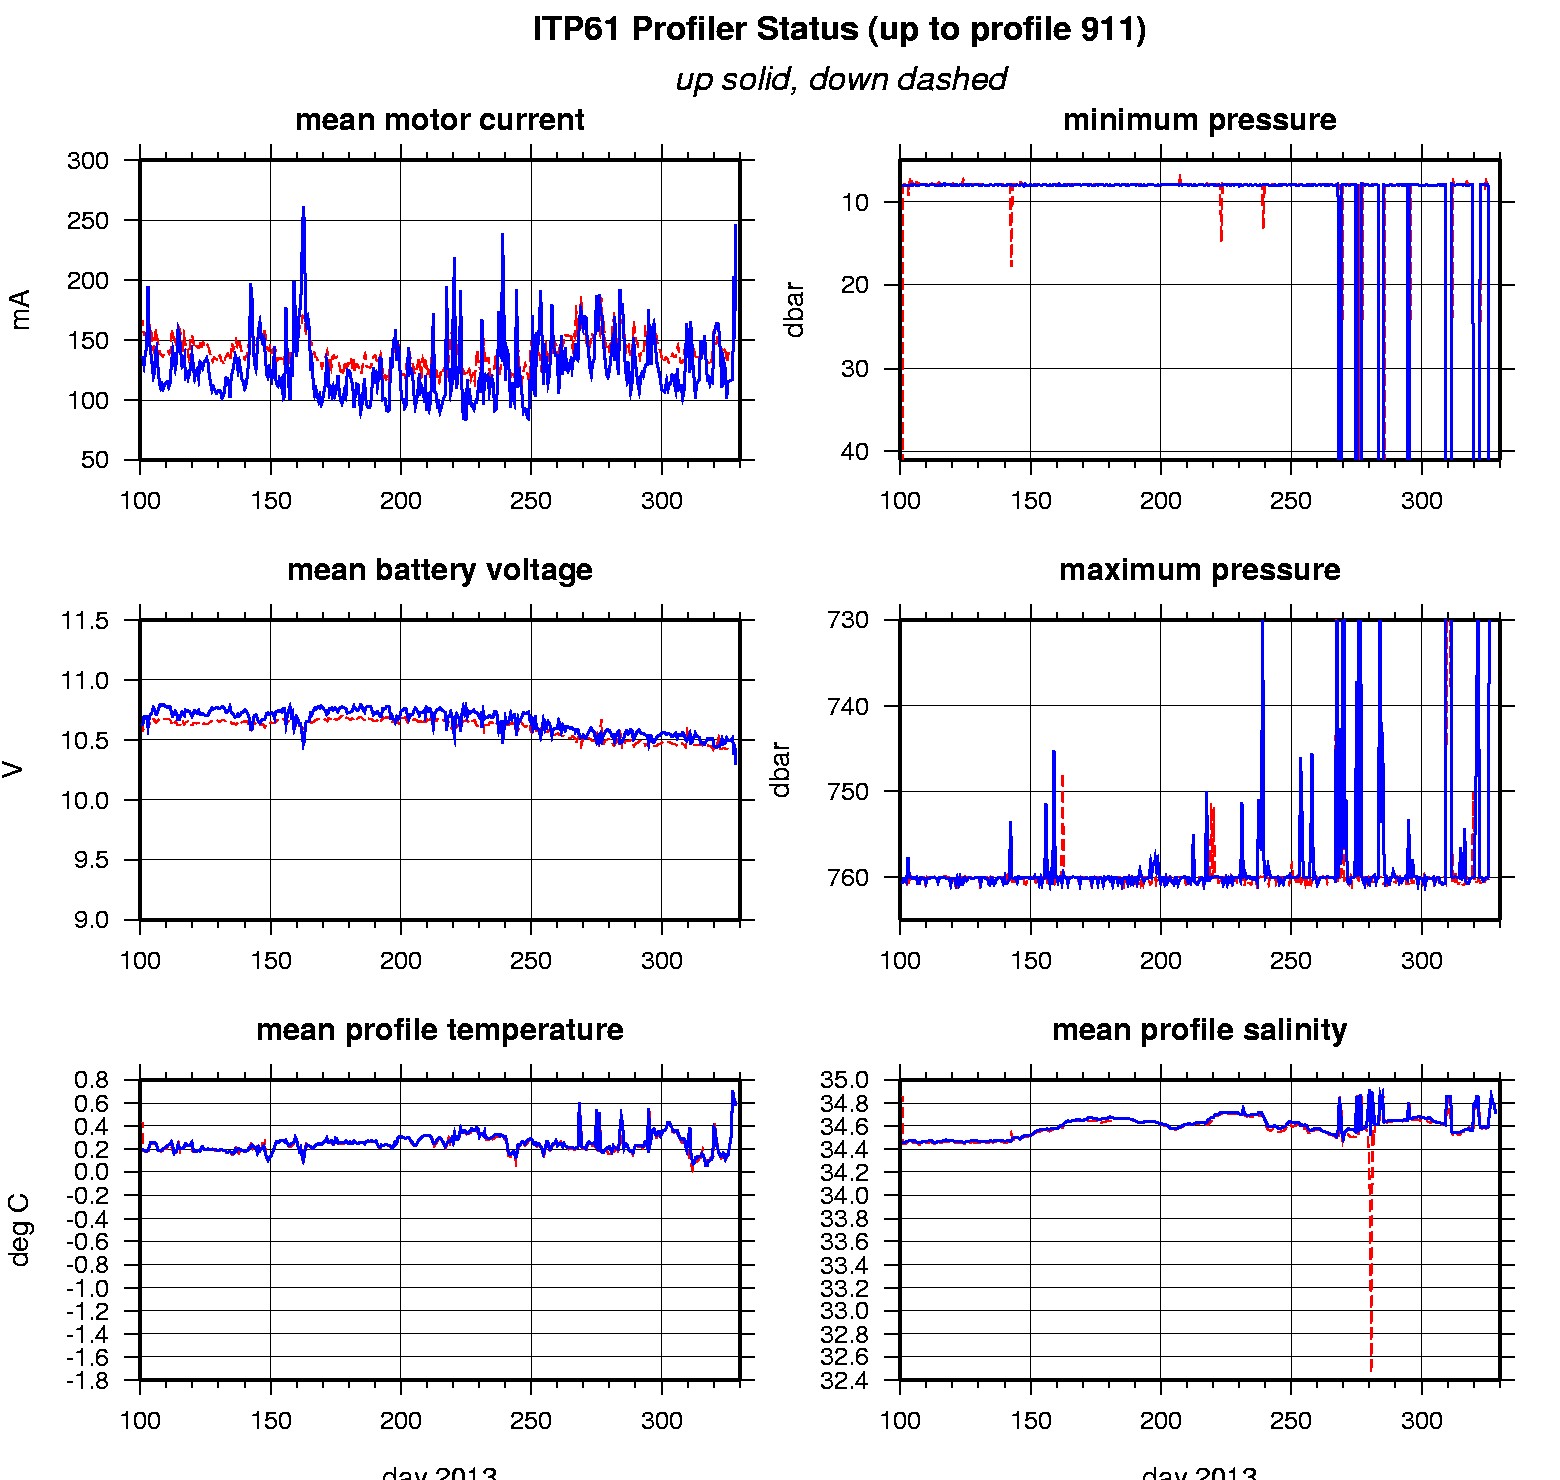
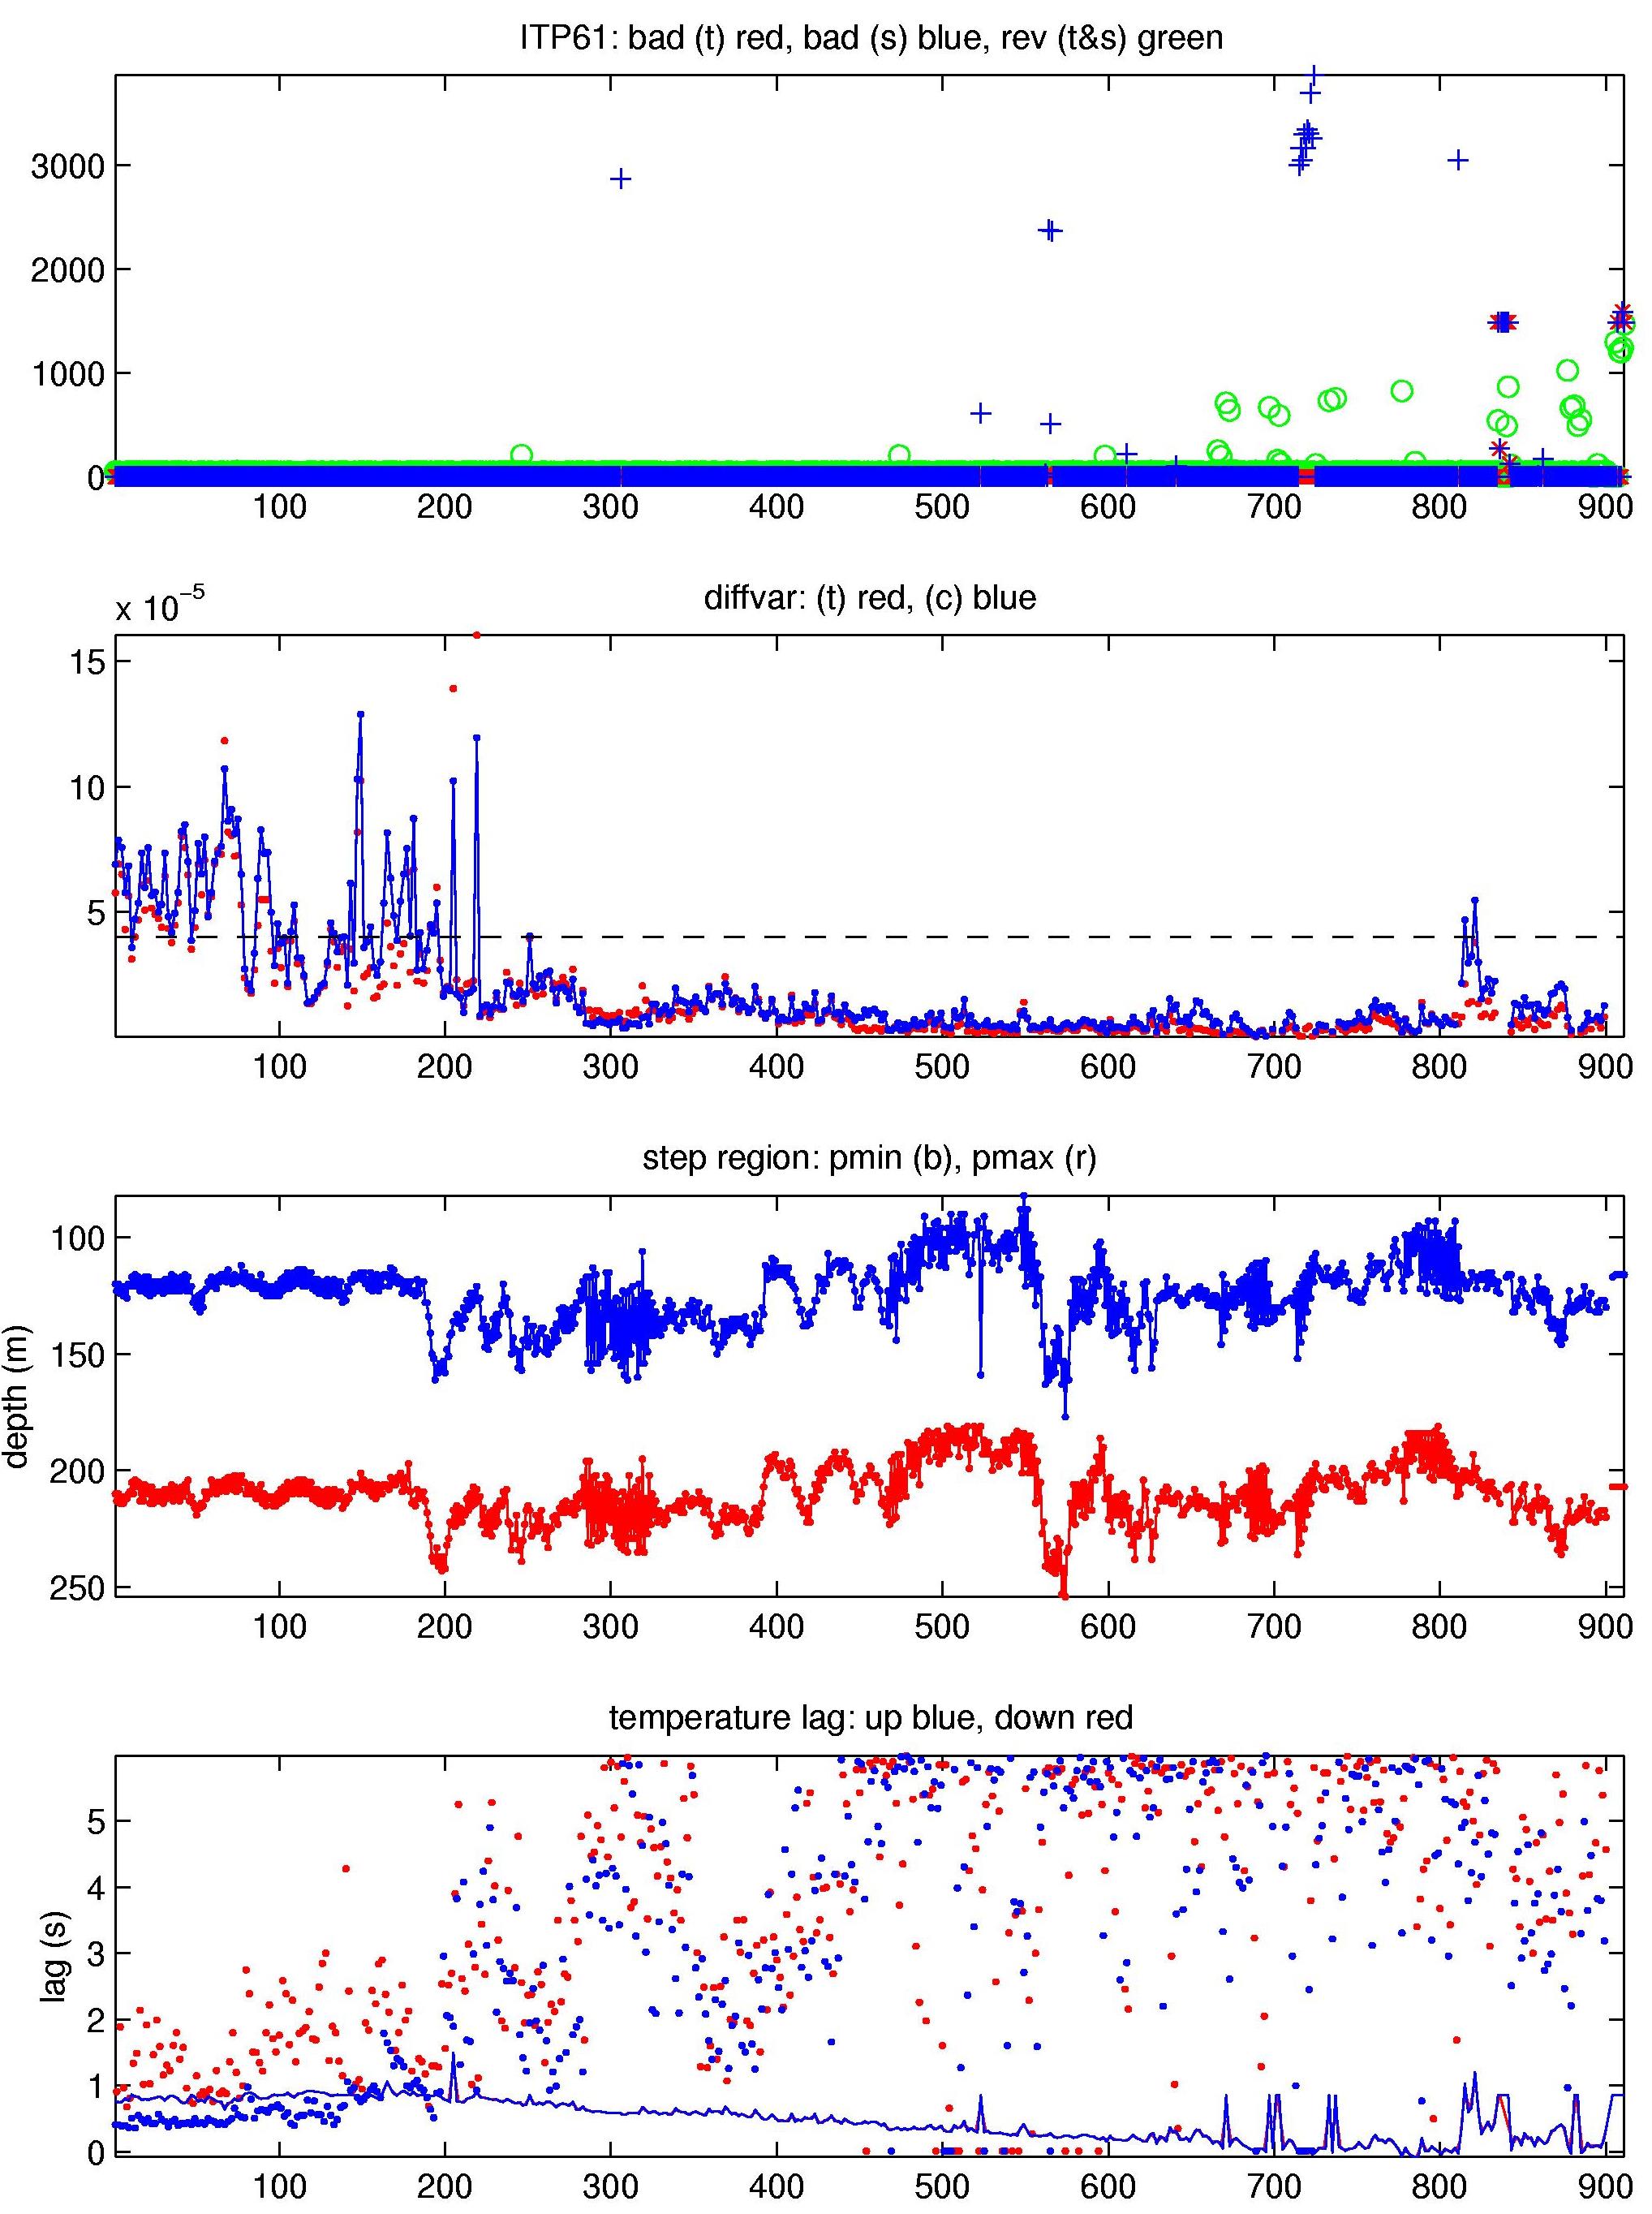
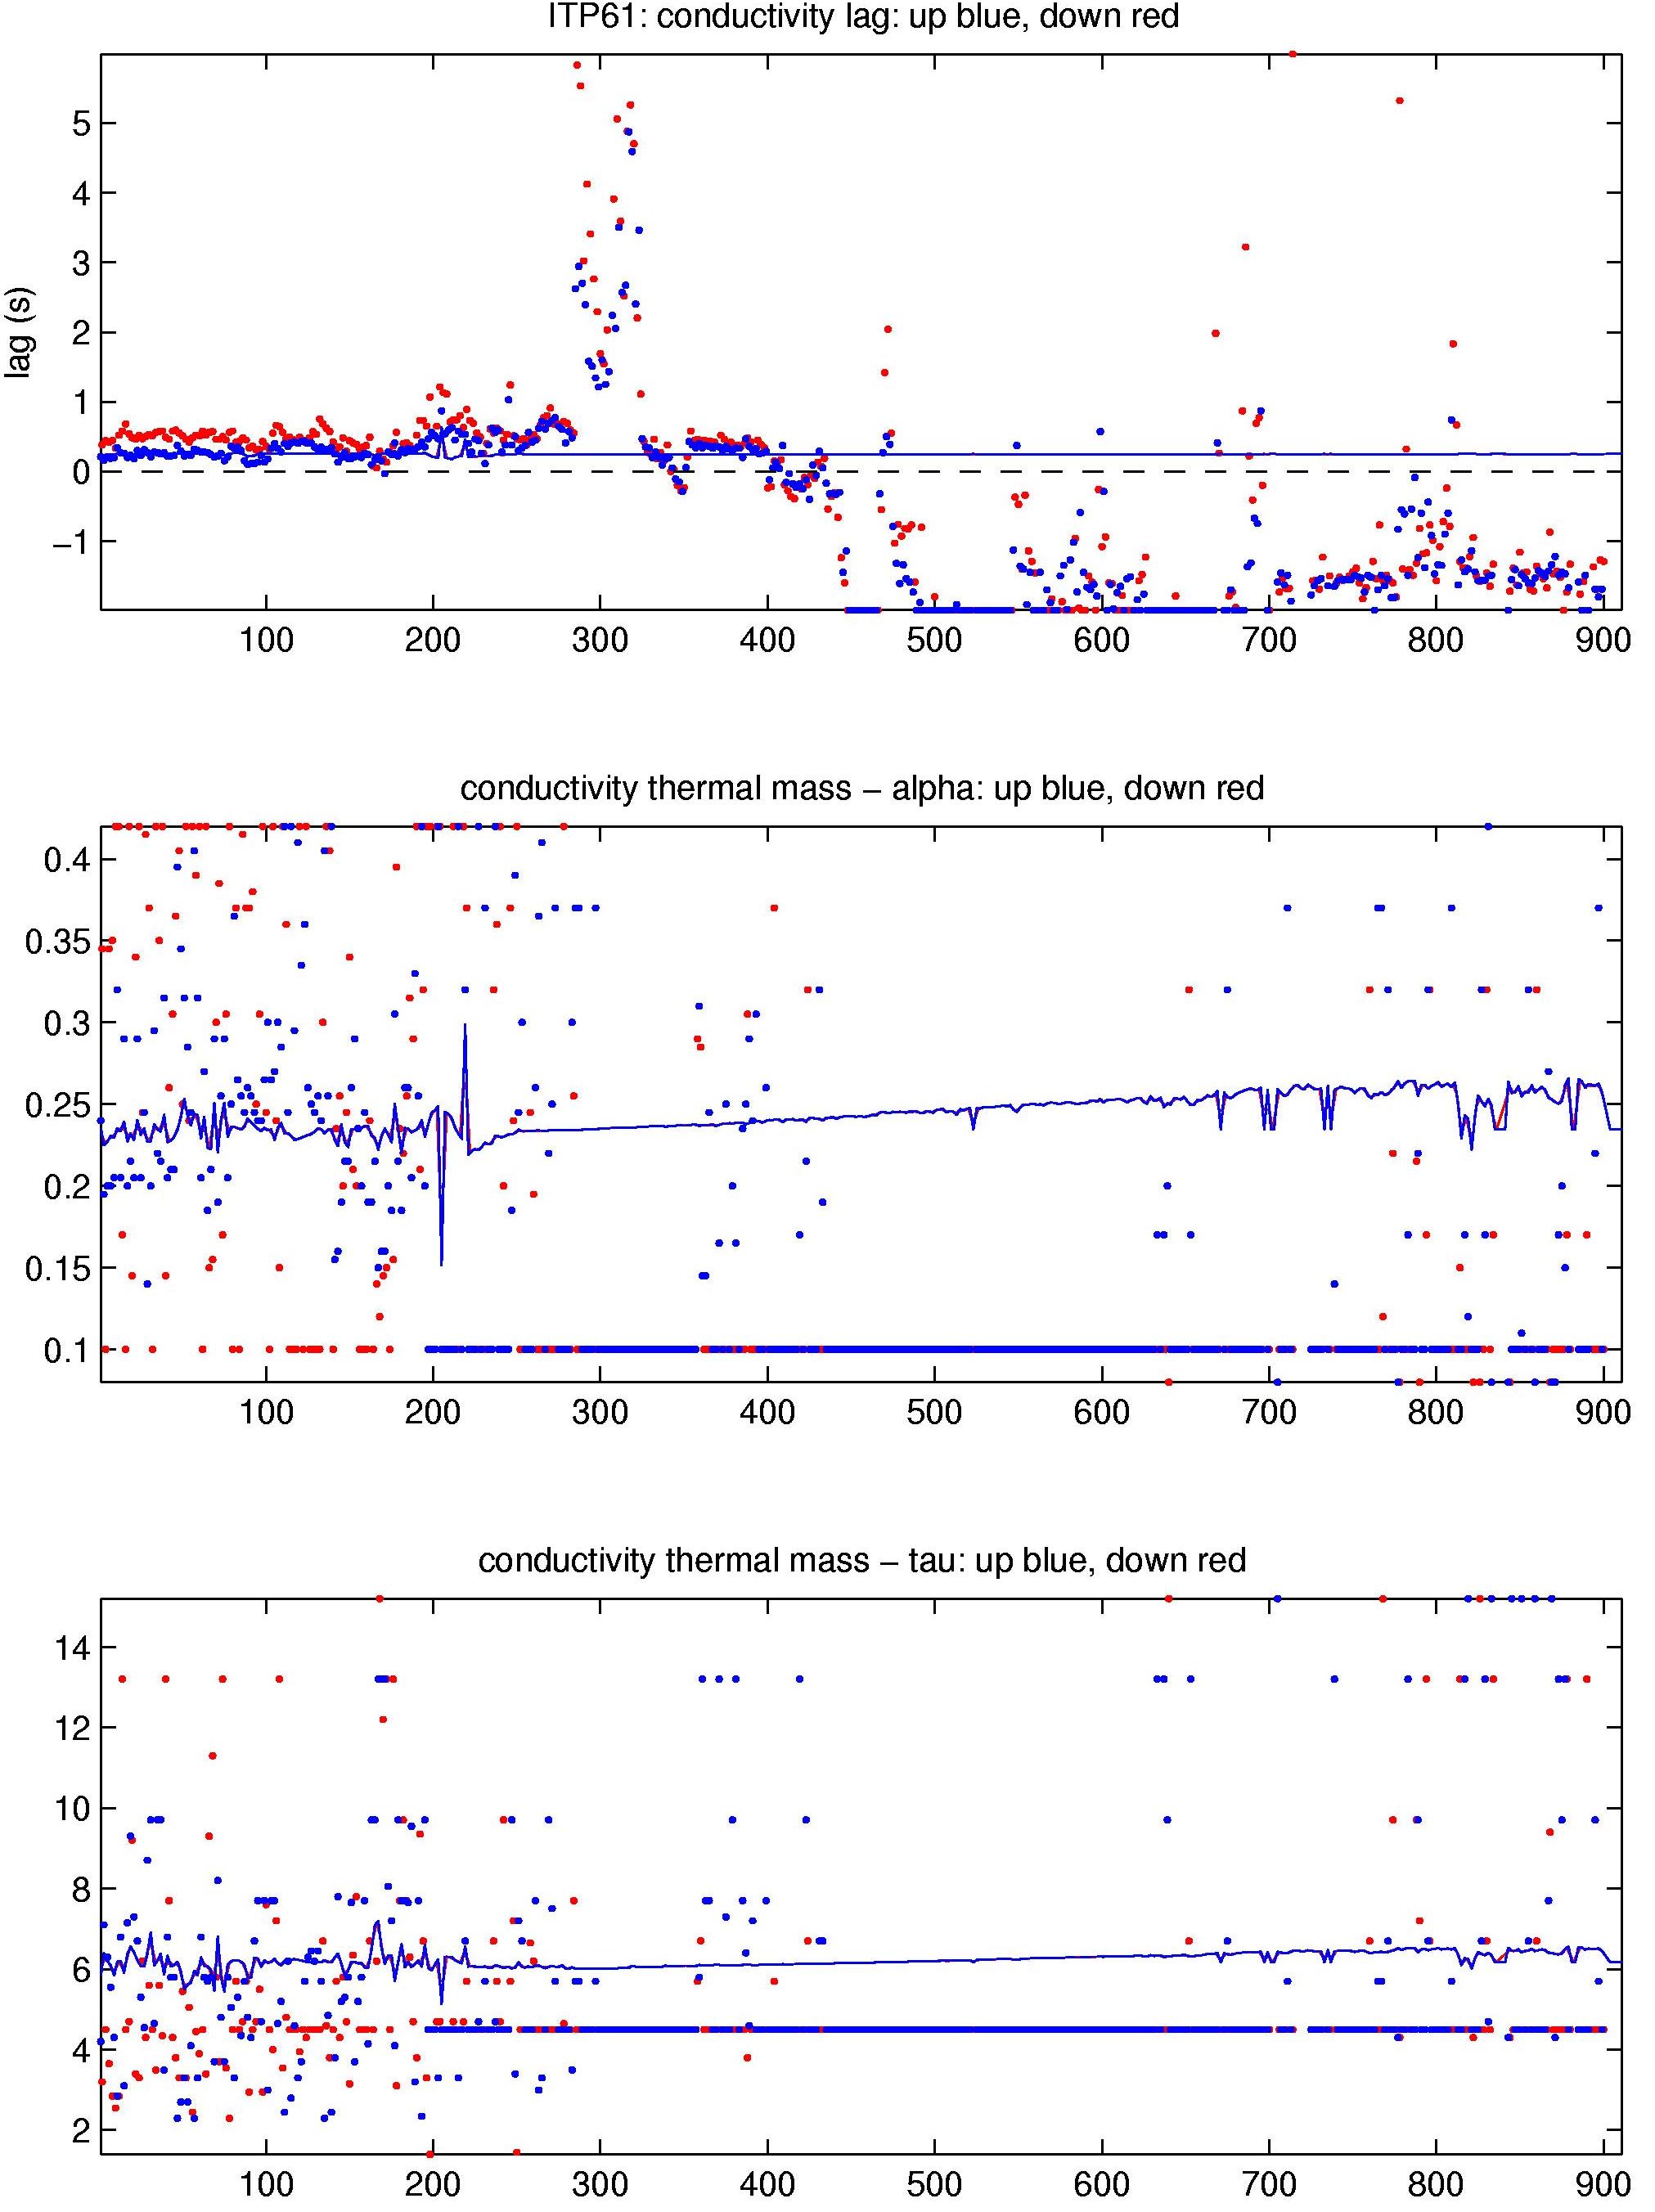
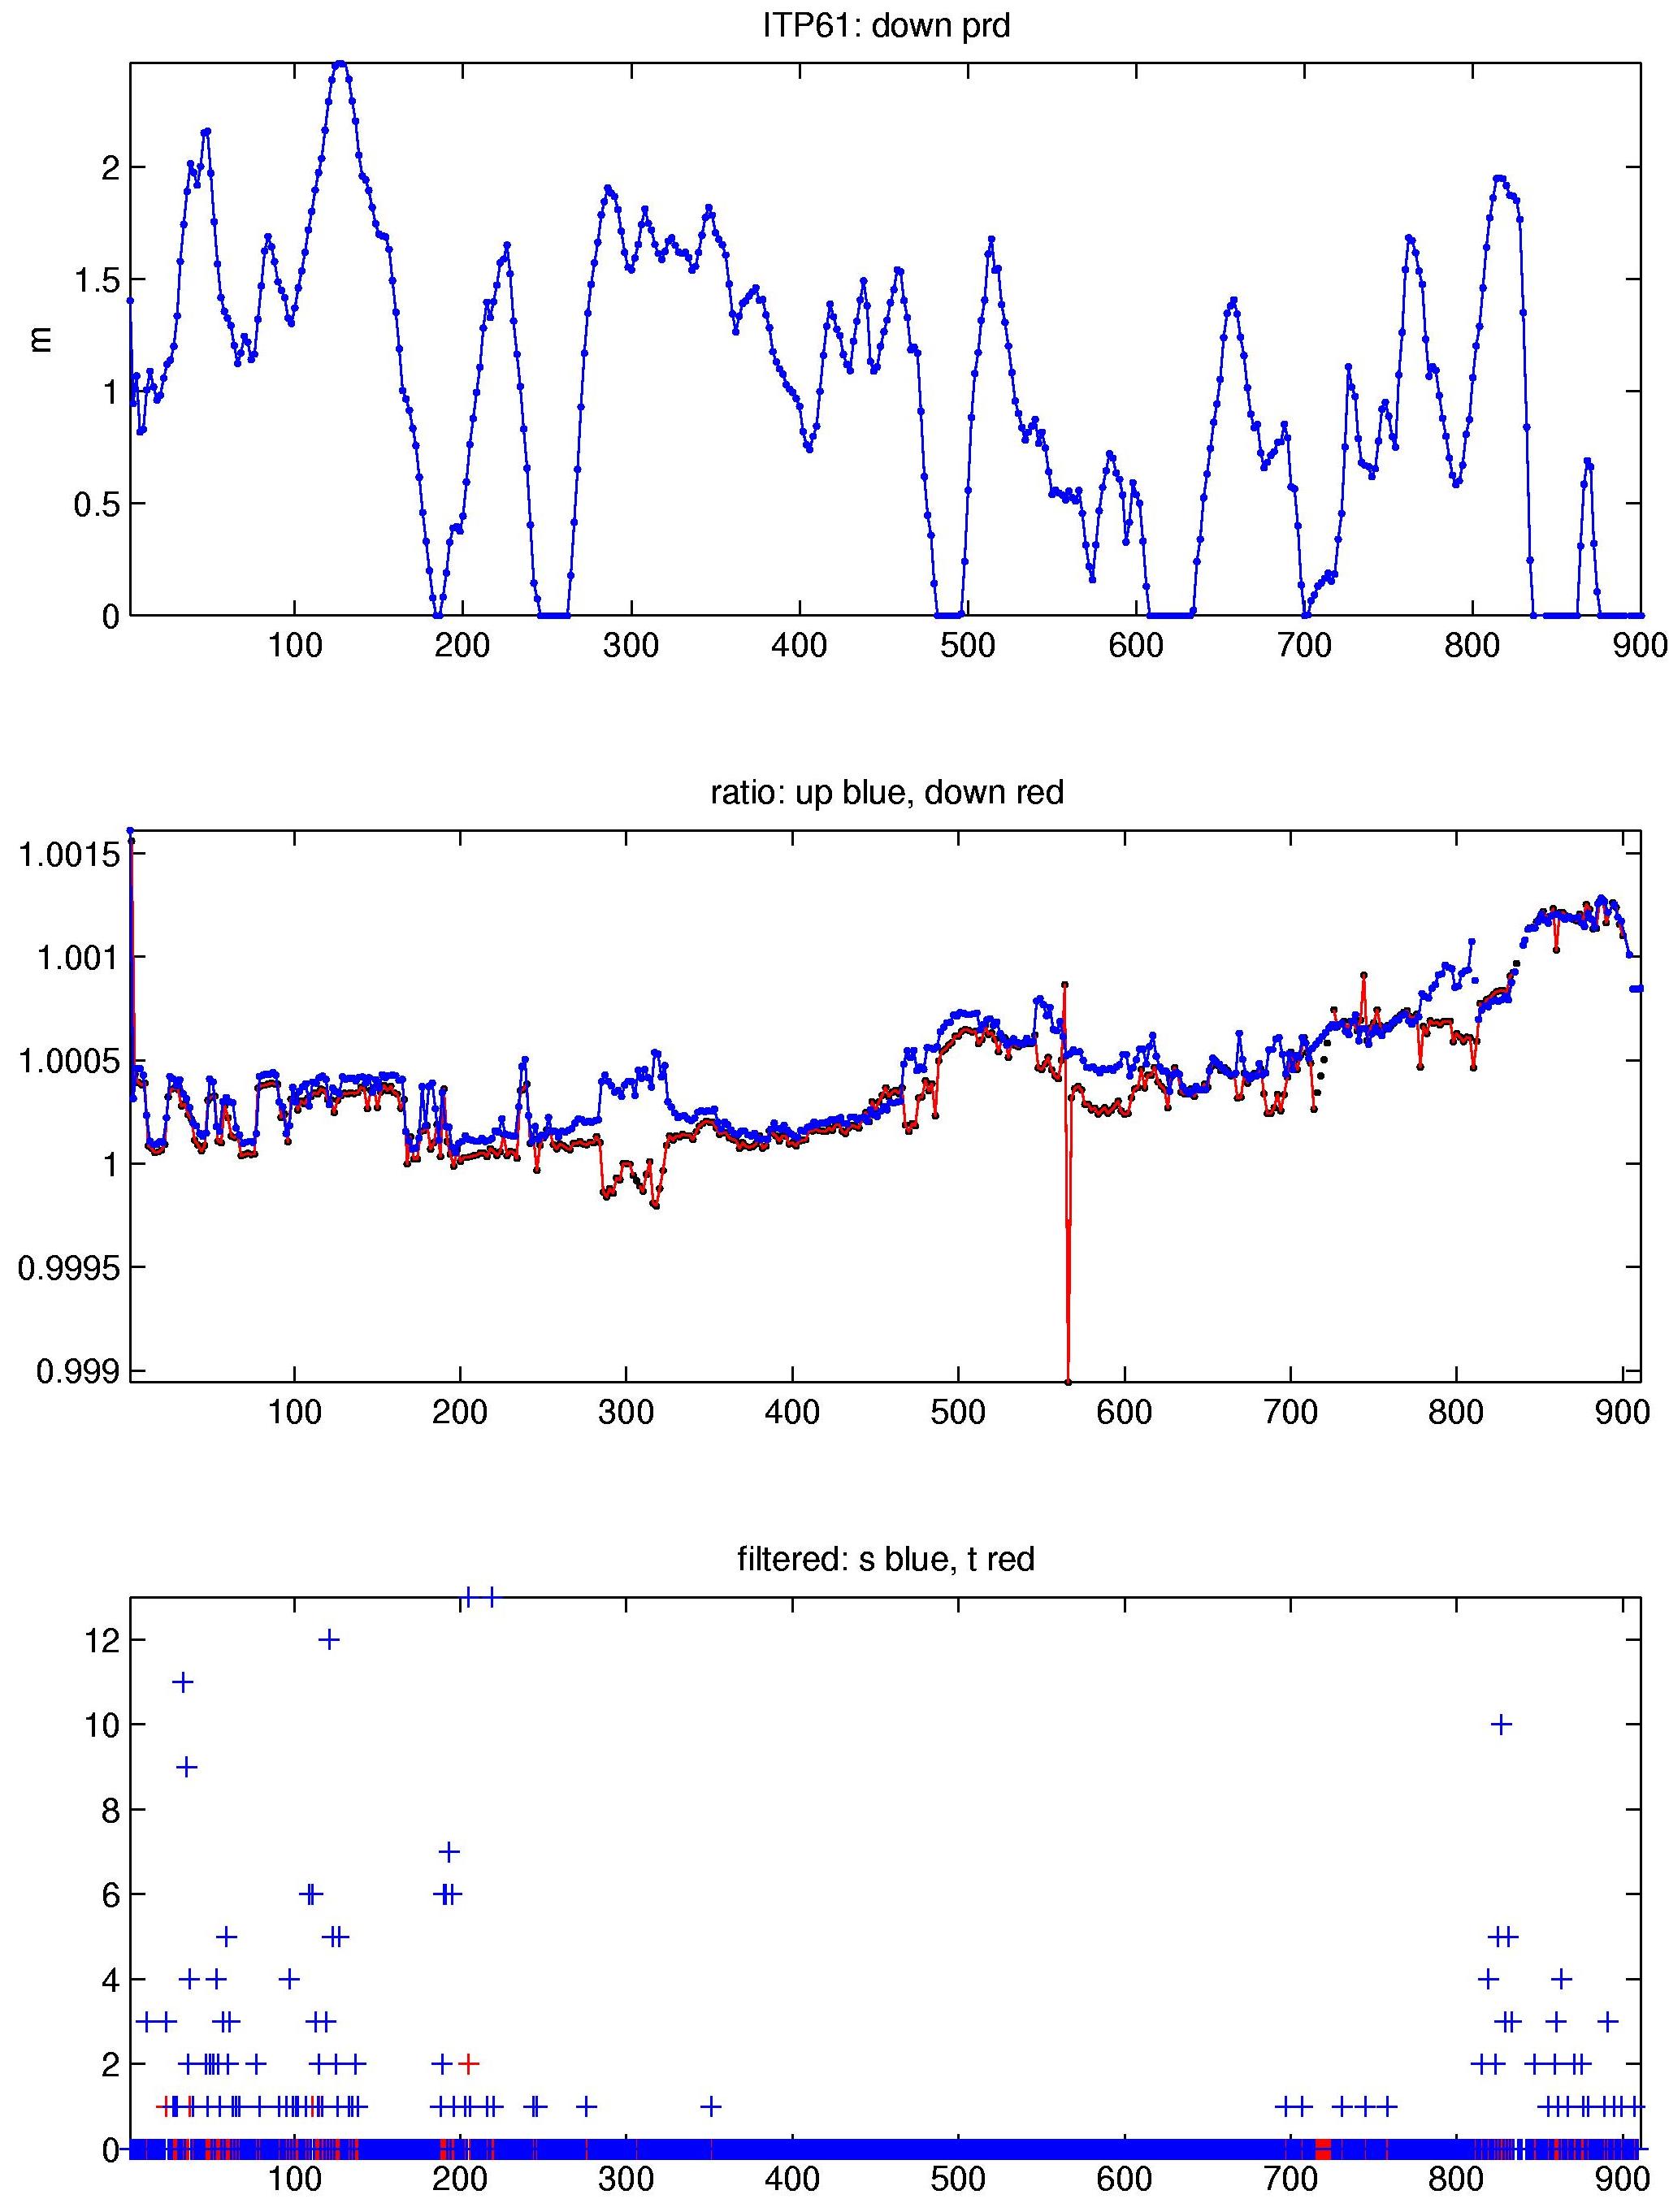
The 911 profiles that were recovered from the ITP were processed according to the procedures described in the ITP Updated Data Processing Procedures. The processing parameters for are shown in the figures to the right. Buoy drift speeds were predominantly less than 30 cm/s while traversing the Arctic Basin so the profiler covered the full extent of 95% of the profiles that it performed.
Some thermohaline staircases were present early during the time series (up to about profile 200), enabling CTD lag correction estimates. During this period, lags were in typical ranges which were carried through the rest of the time series. Fouling was minimal, so that the profile-to-profile potential conductivity corrections varied only modestly.
See the Data Products tab to the left for descriptions of the three levels (I, II, III) of data processing and to access all data.
