ITP41 Data Processing
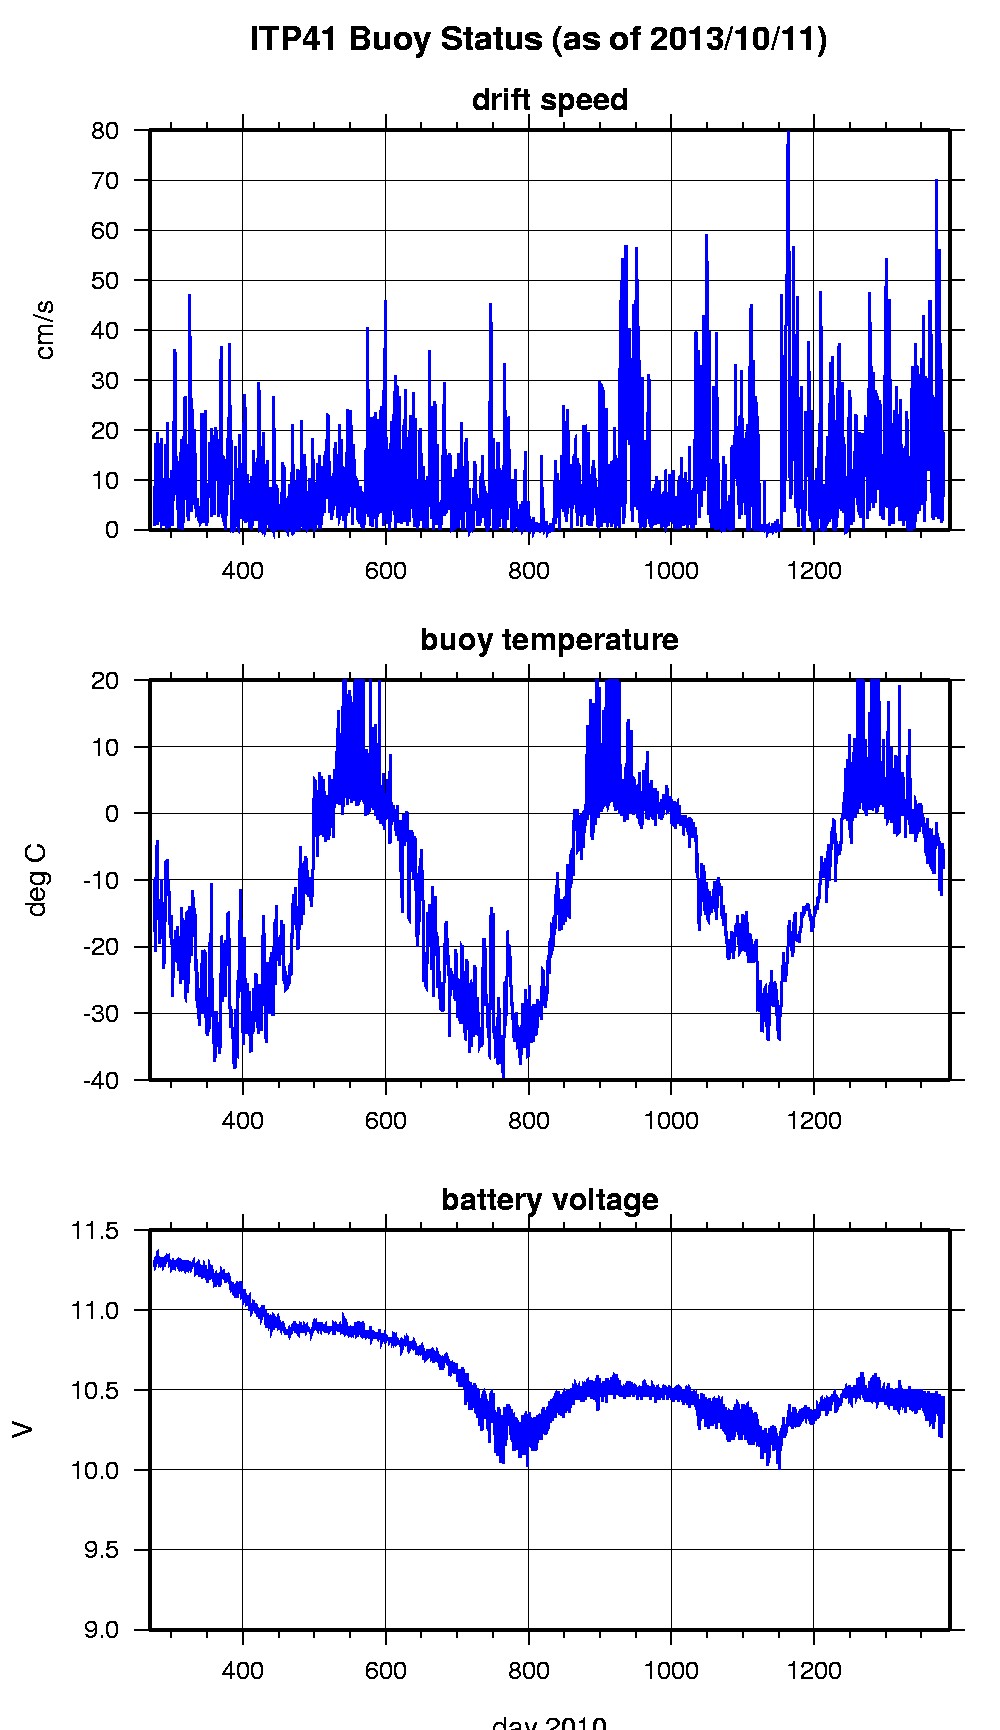
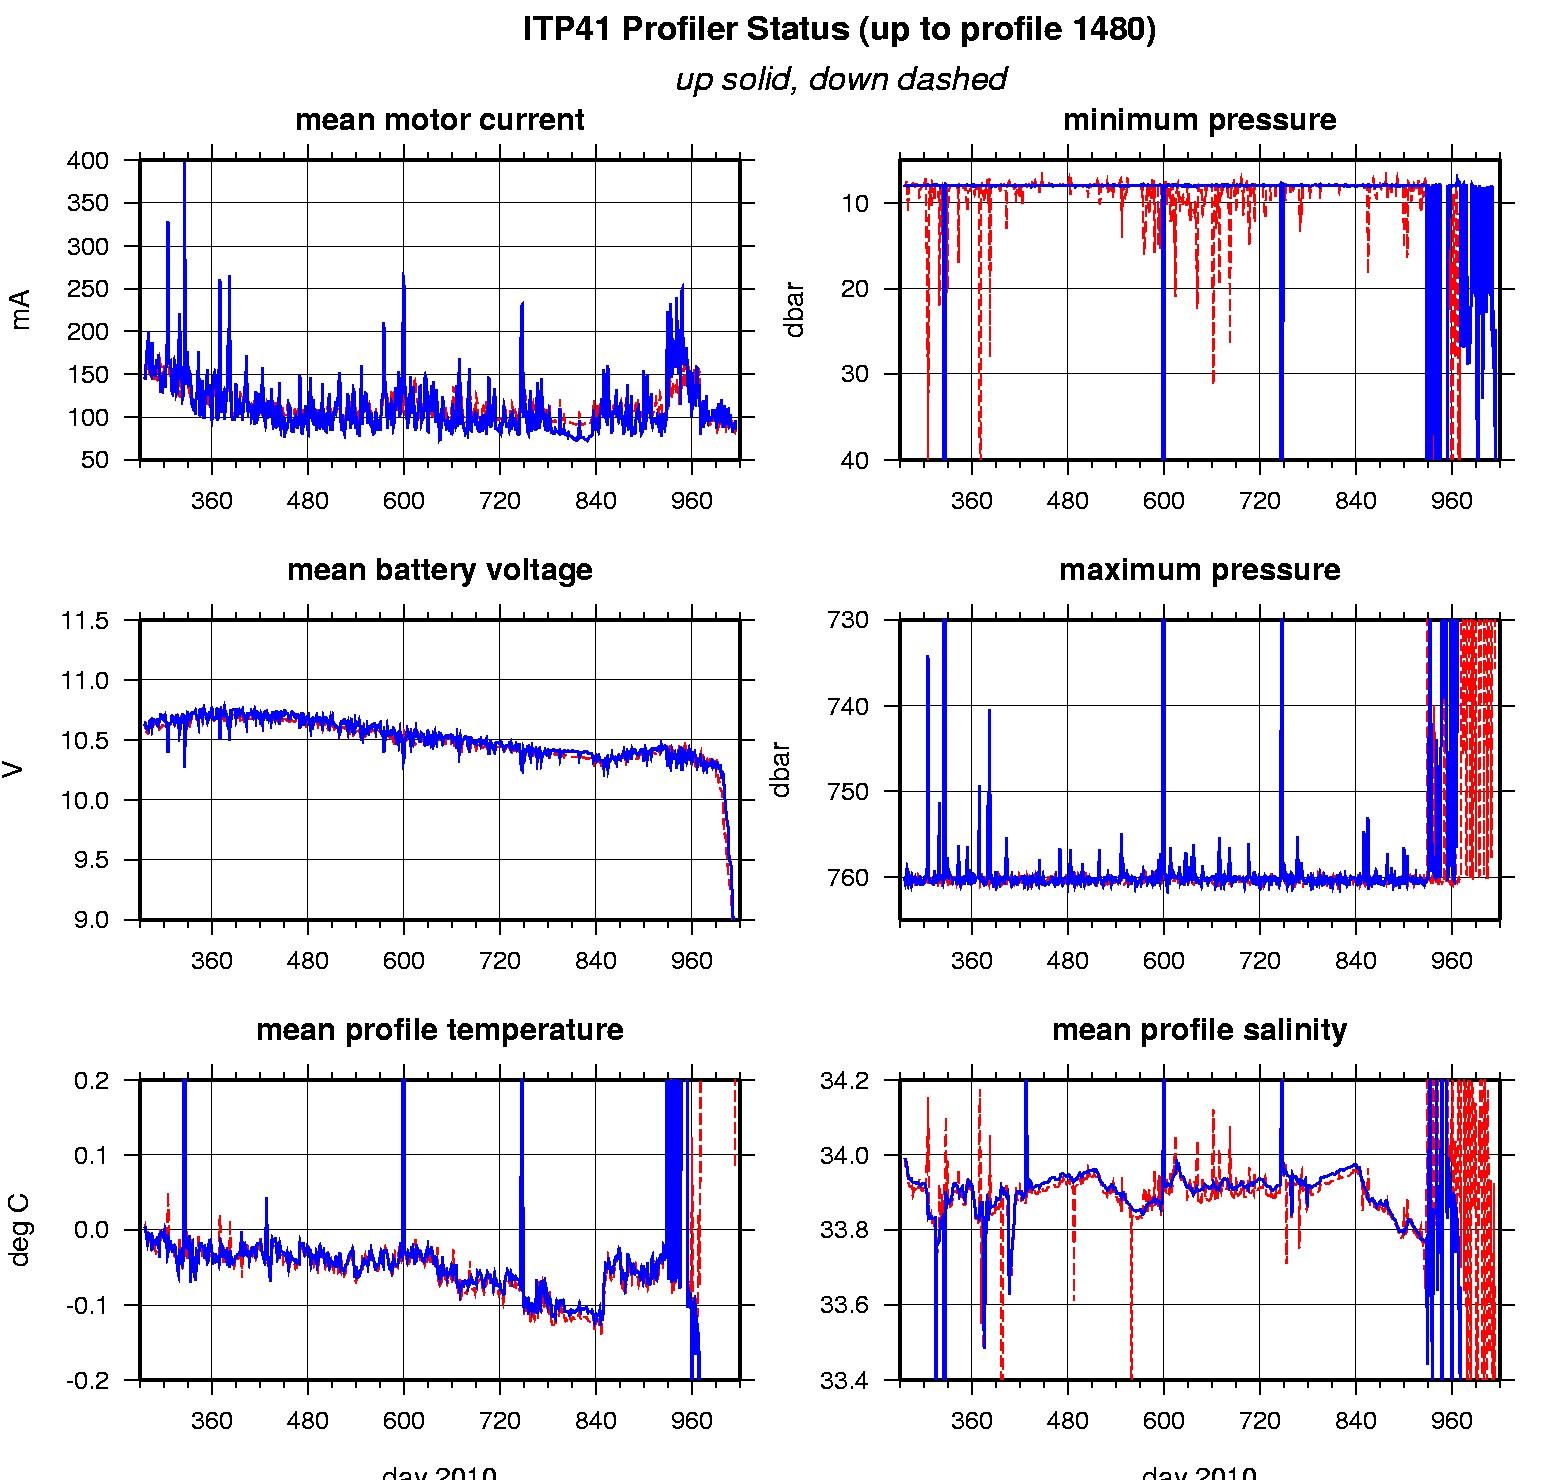
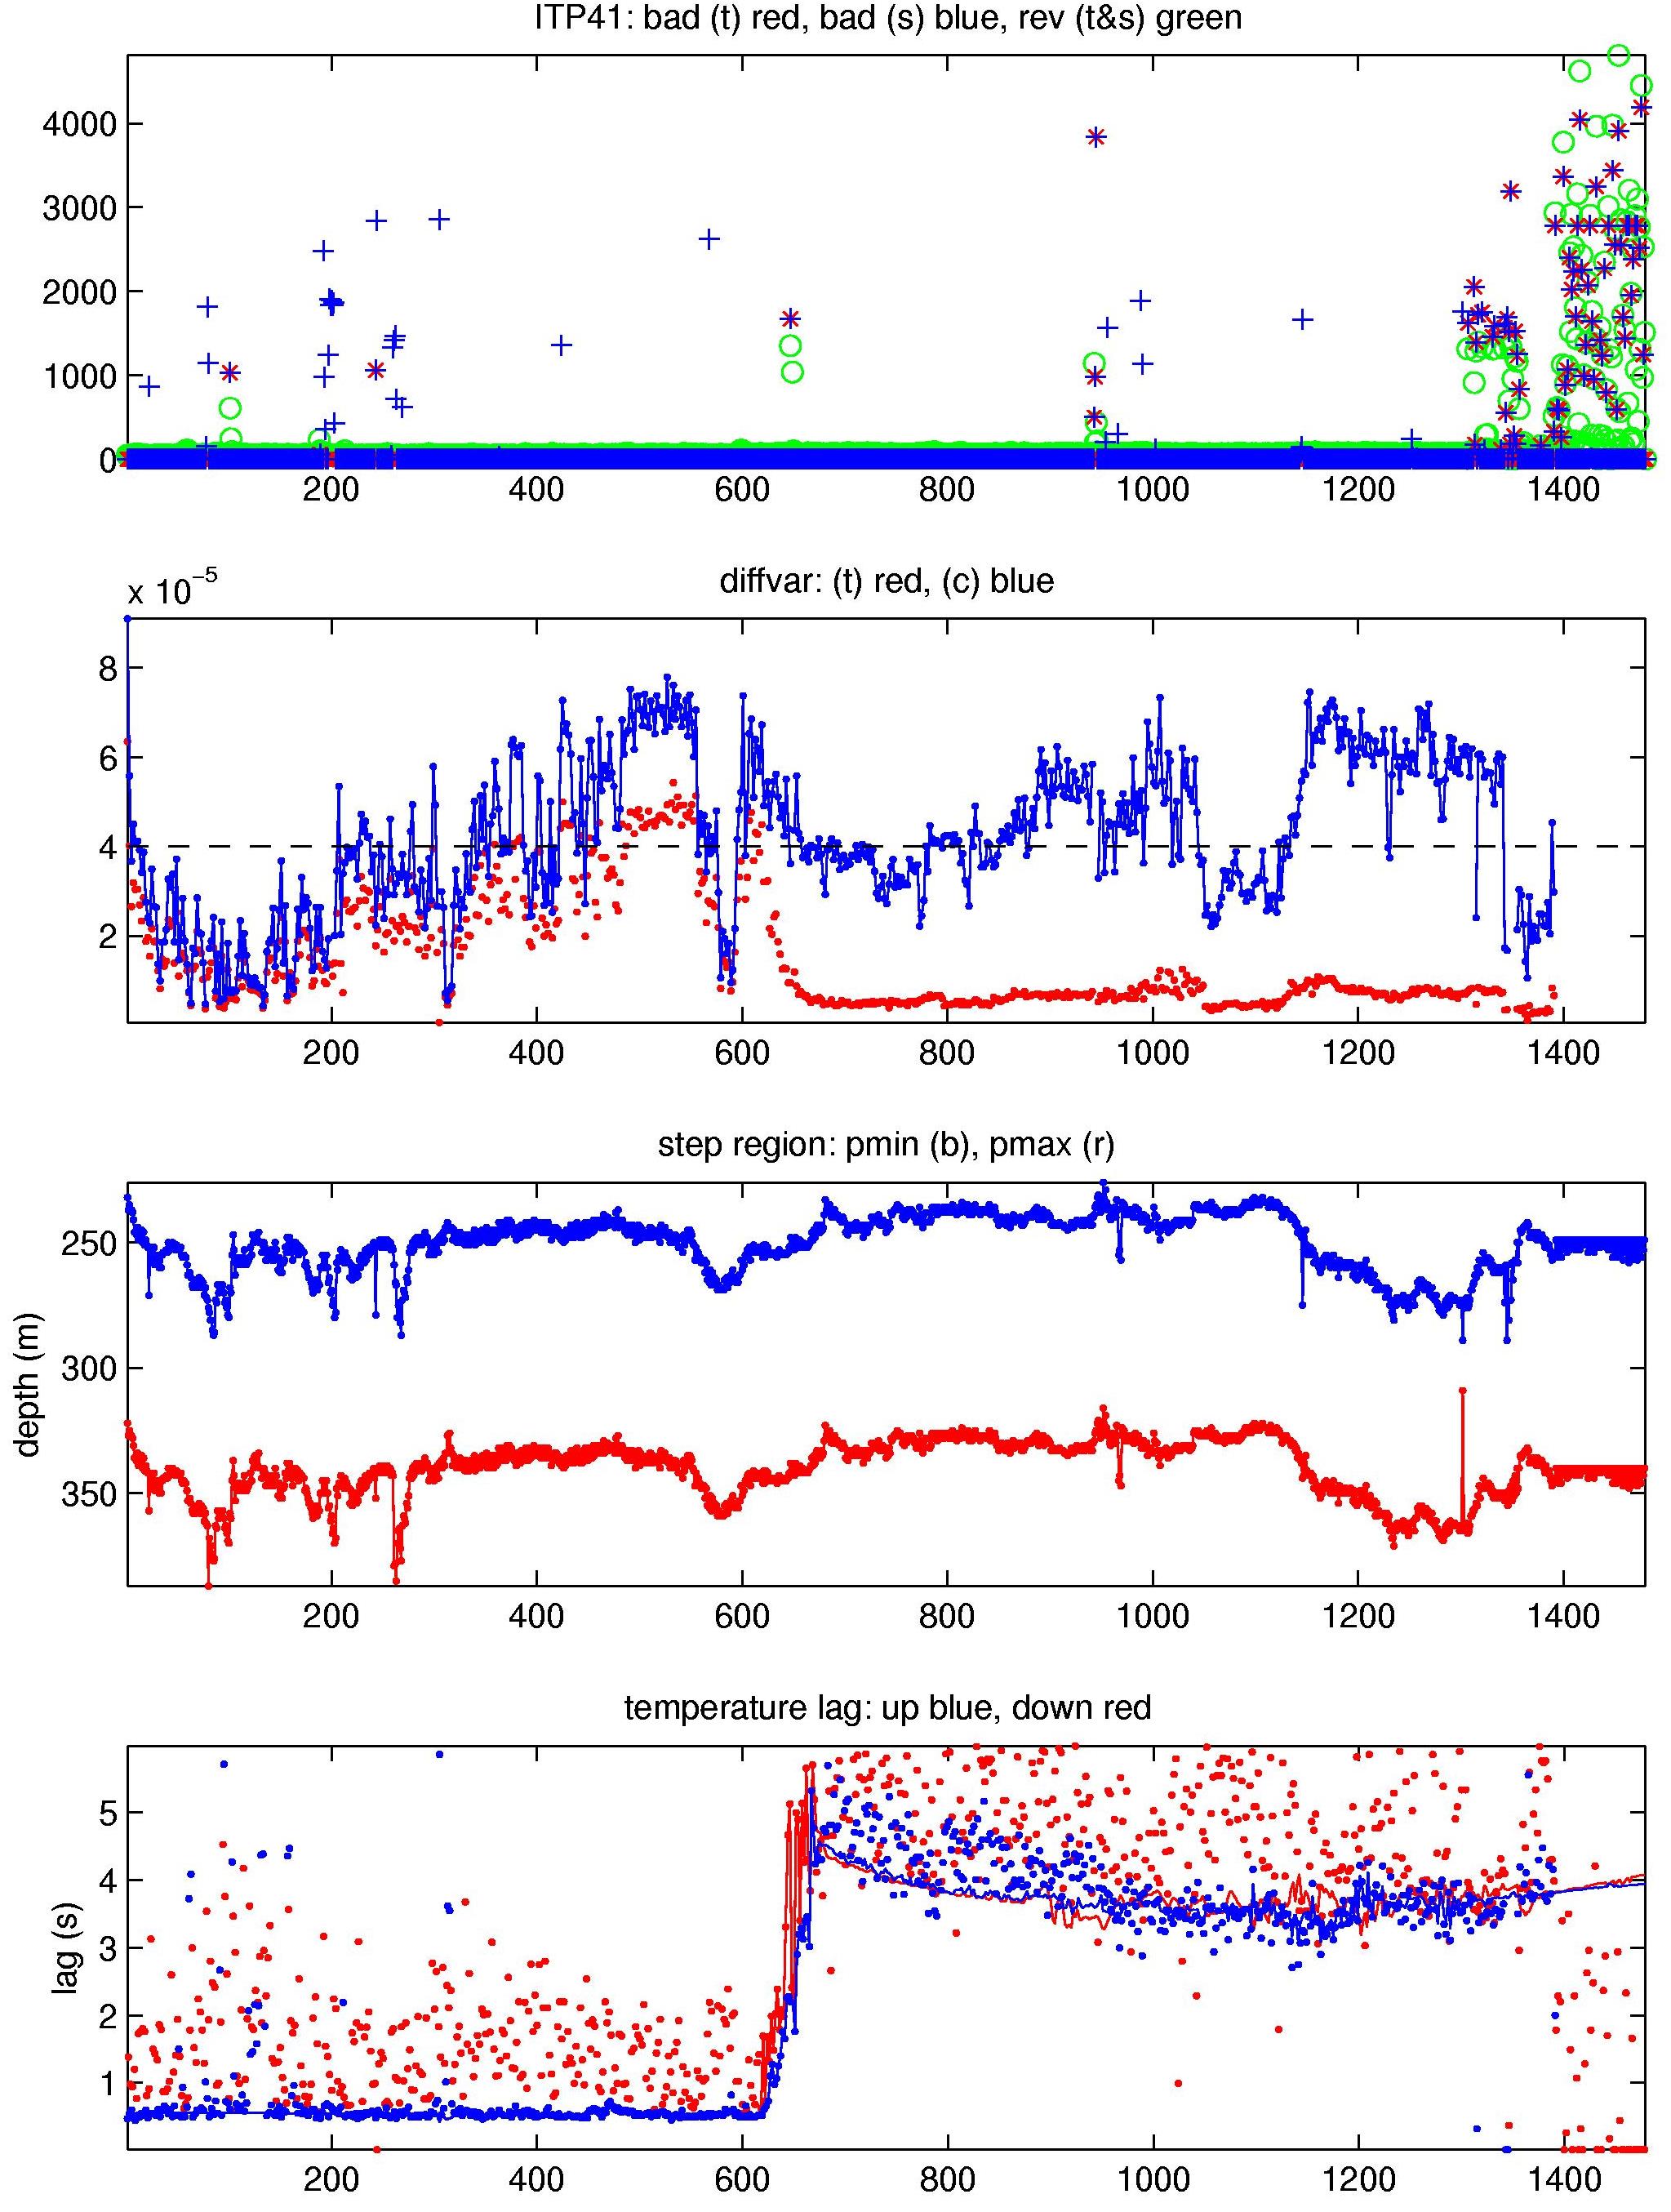
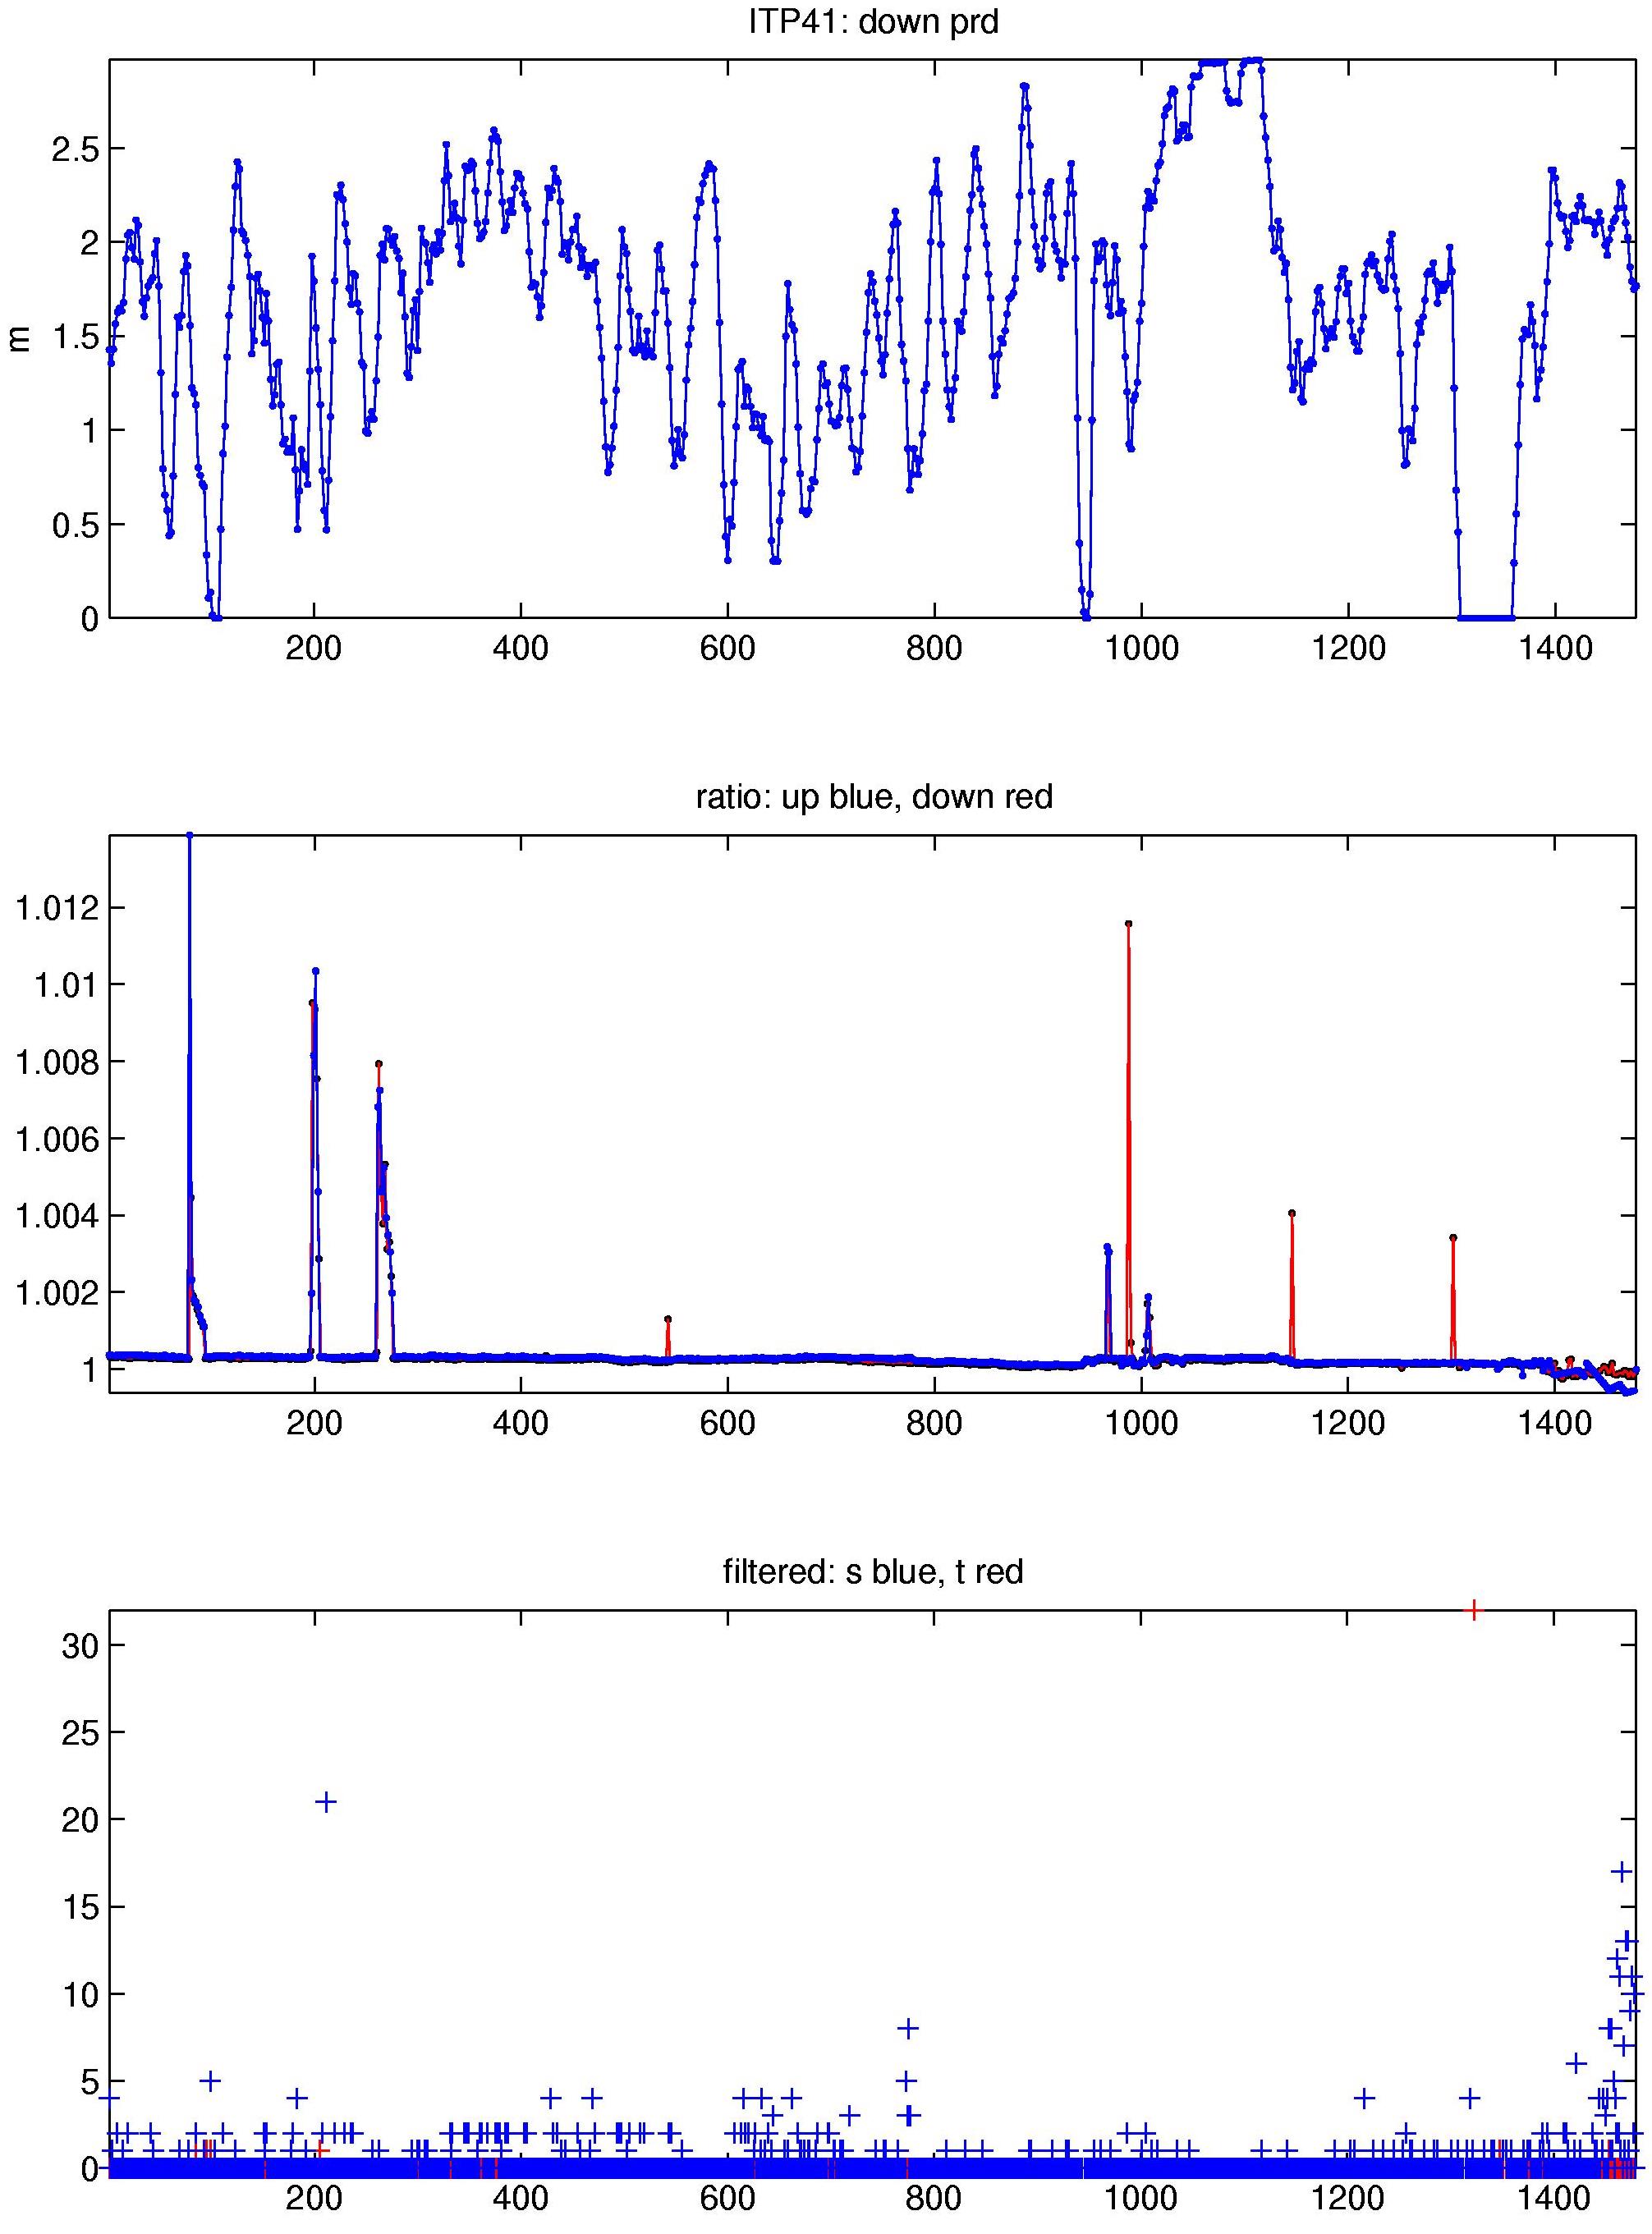
The 1480 profiles that were recovered from the ITP were processed according to the procedures described in the ITP Updated Data Processing Procedures. The processing parameters for ITP 41 are shown in the figures to the right. The profiler performed well over most of the two year time period before the battery pack was exhausted. Buoy drift speeds did exceed 30 cm/s occasionally, causing the profiler difficulty to climb the wire, especially around profile 1350. Beginning with profile 1391, only half profiles were obtained in either direction, as the unit apparently began each profile around 200 m depth (where the instrument would be neutrally buoyant). Possibly one of the tension springs coupling the profiler to the wire failed.
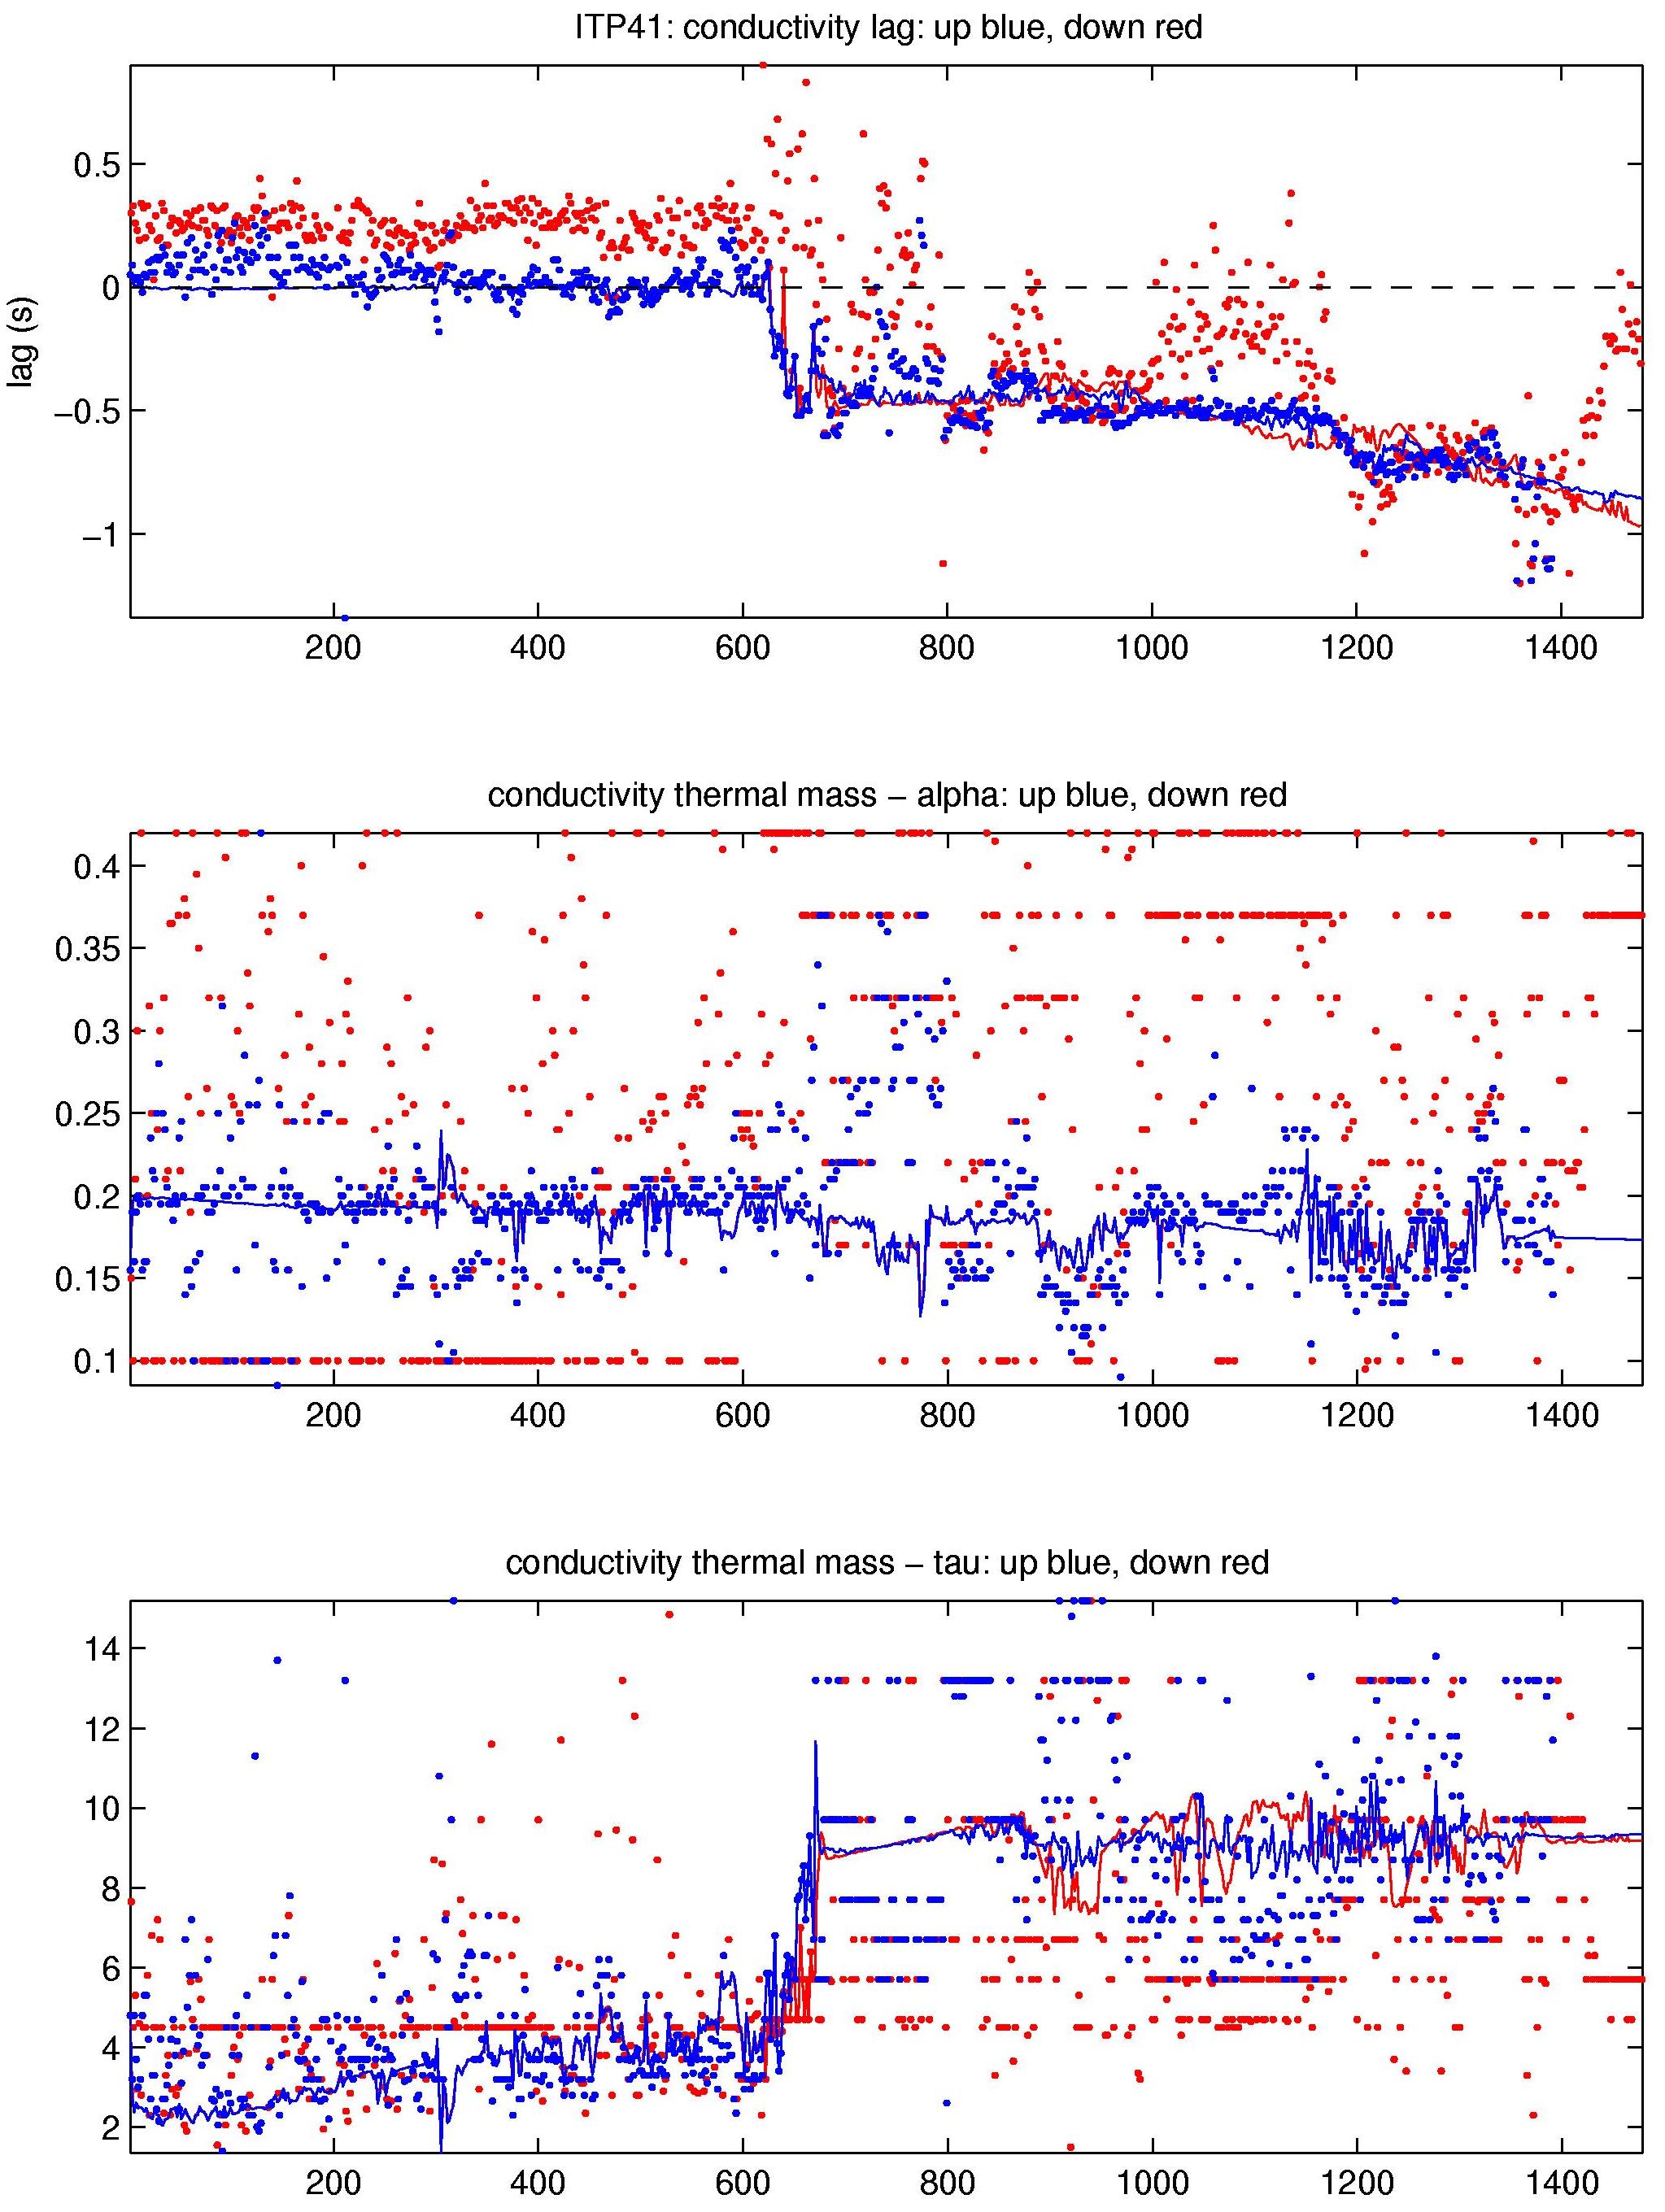
Meanwhile, the SBE 41-CP CTD on the profiler had a unique problem where blocks of zeros were being recorded, so required special processing of the raw data. Fortunately, very little data were lost due to this problem. ITP Thermohaline staircases were present throughout the time series, enabling CTD lag corrections. Before profile 620, lags were in the typical range as previous systems, then the temperature lag shifted by more than 3 seconds. The difficulty (fouling, icing, or hardware problem) which influenced the temperature channel did not seem to occur in the conductivity channel, although the conductivity and thermal mass lags required shifting to compensate (which remained largely constant for the remainder of the time series). The potential conductivity correction exhibits some short term shifts and several spikes over the period, with good agreement between the up and down profiles attesting to the absence of fouling on the conductivity.
See the Data Products tab to the left for descriptions of the three levels (I, II, III) of data processing and to access all data.
