ITP26 Data Processing
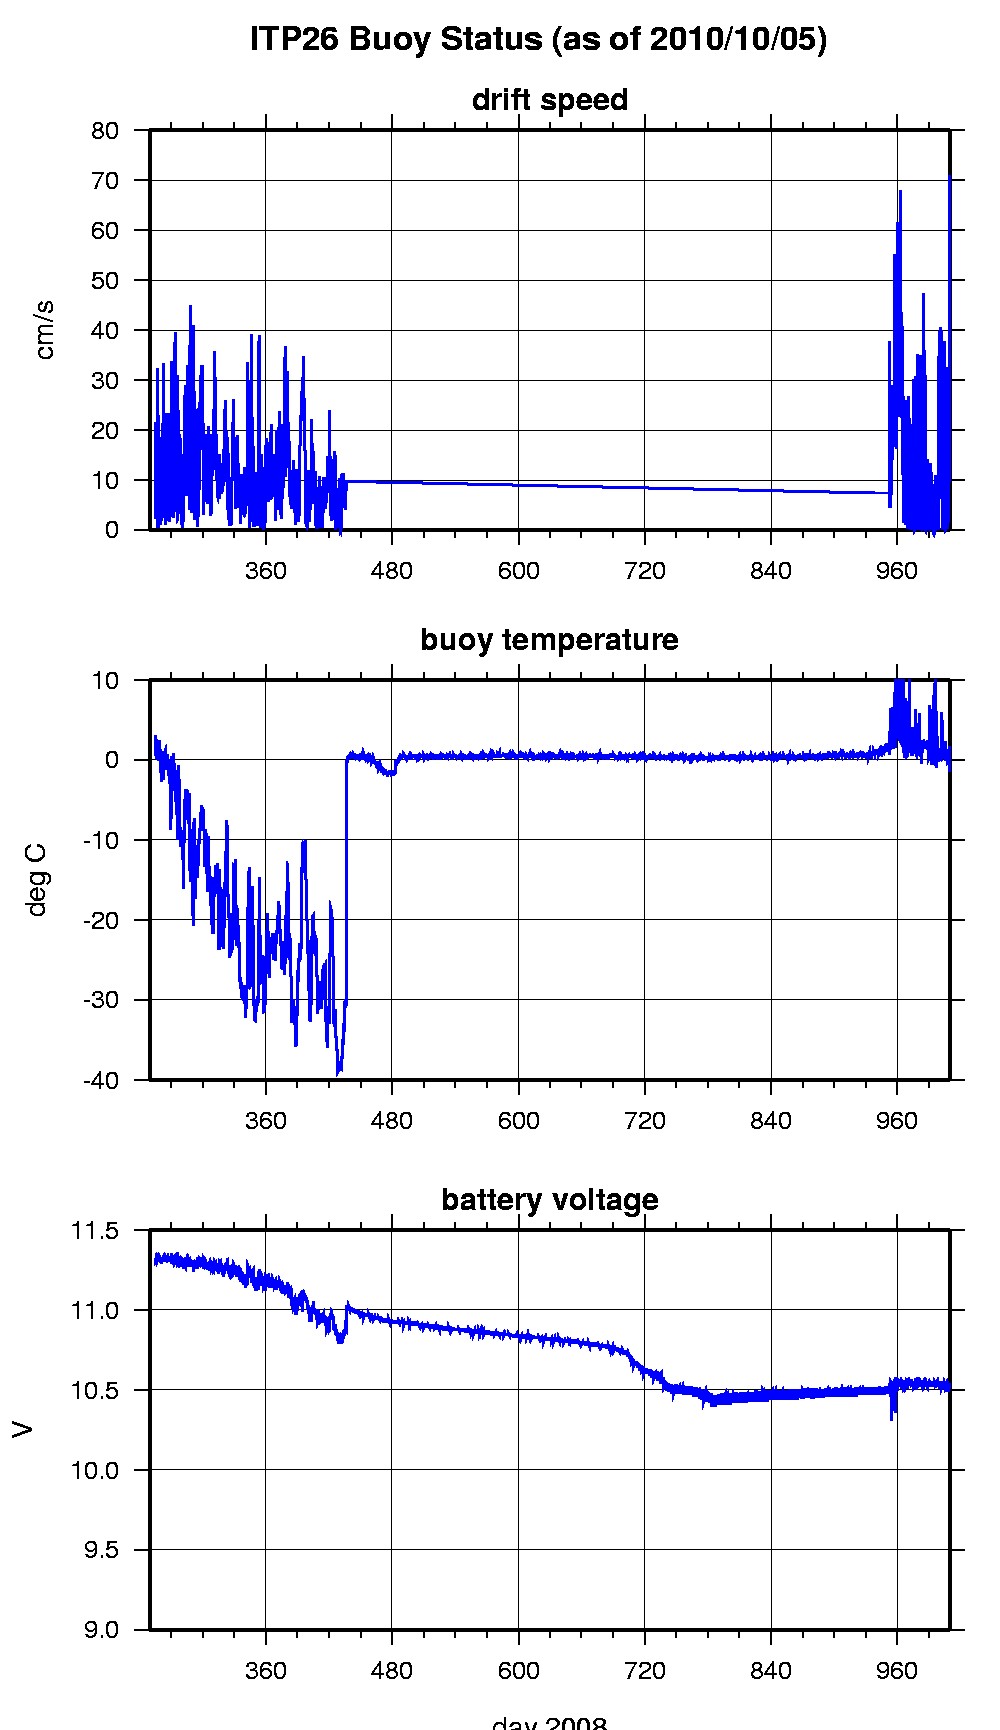
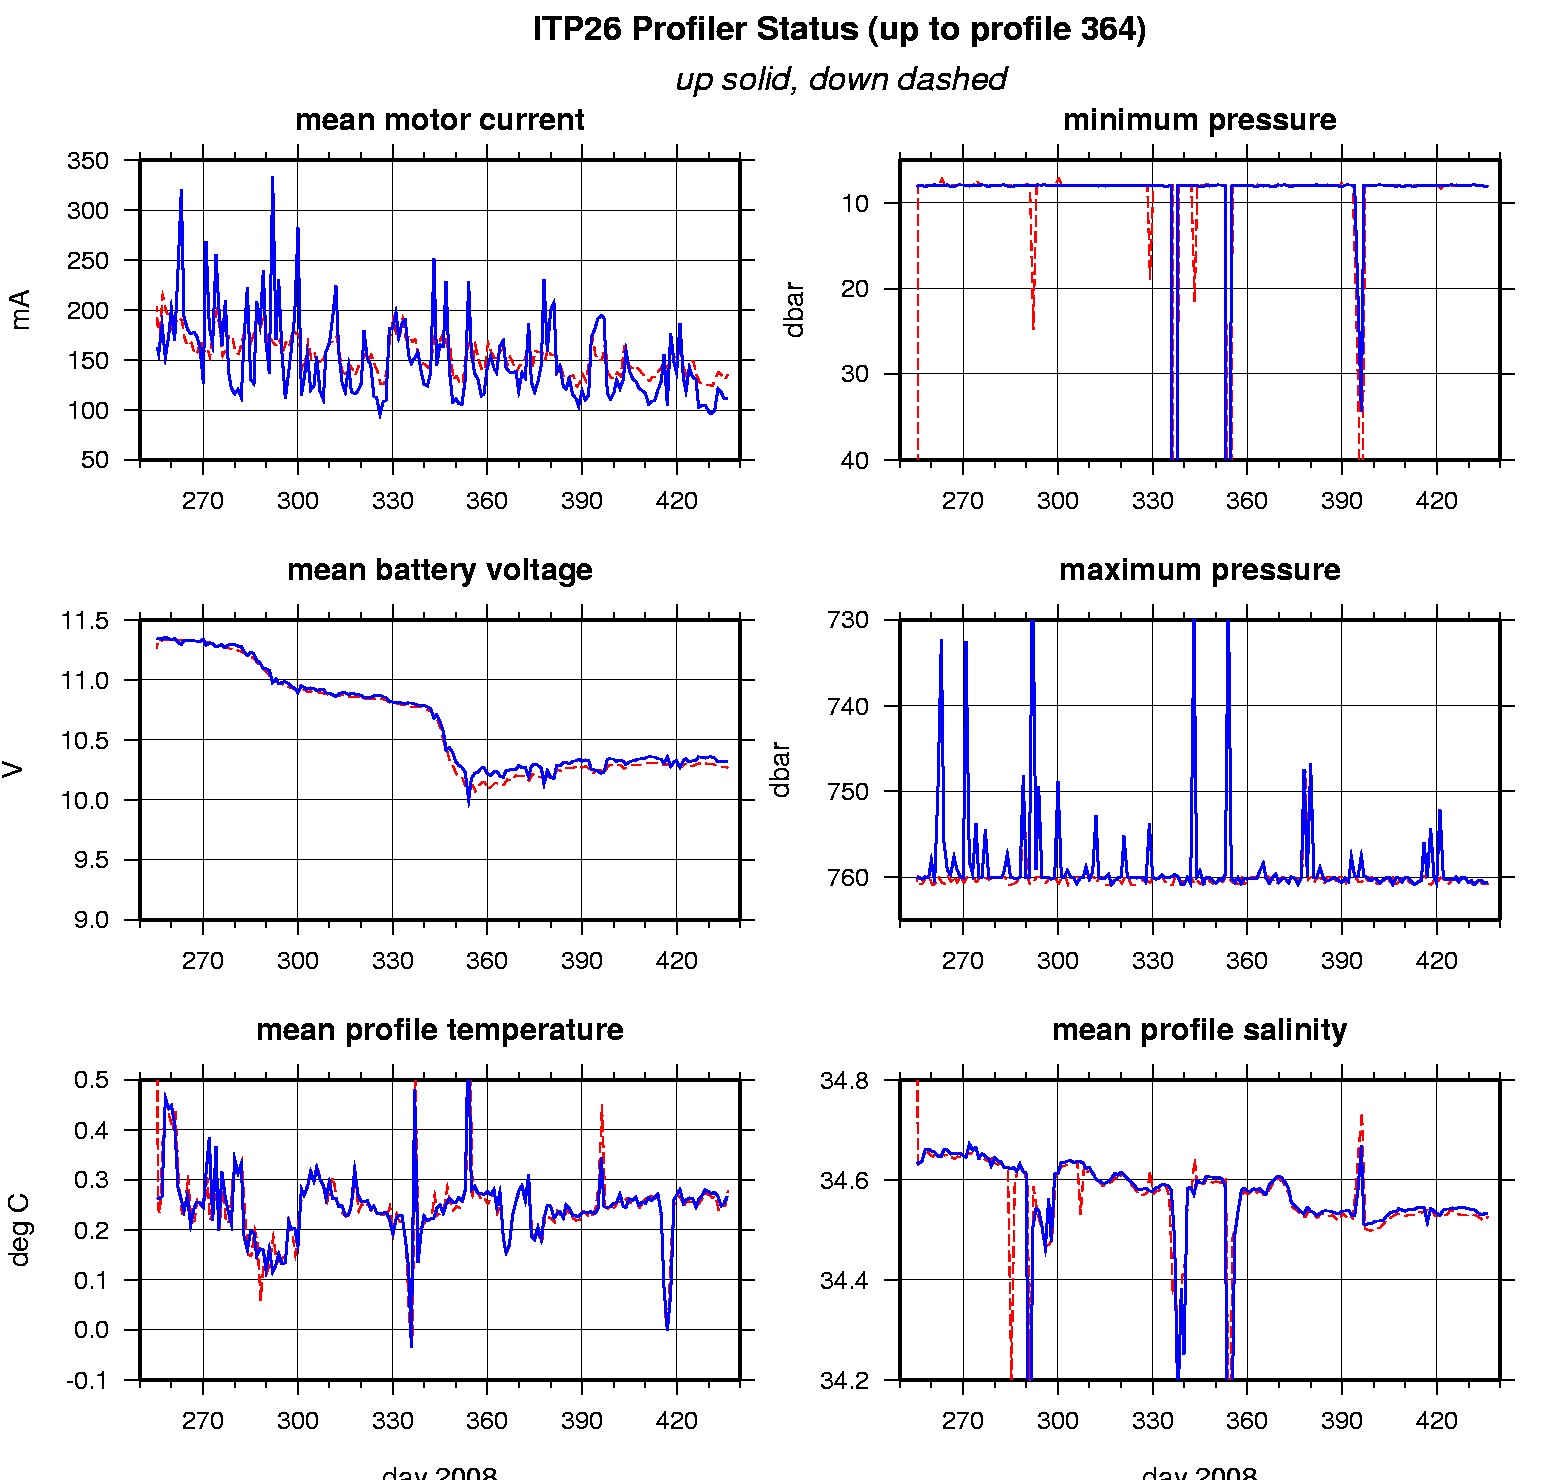
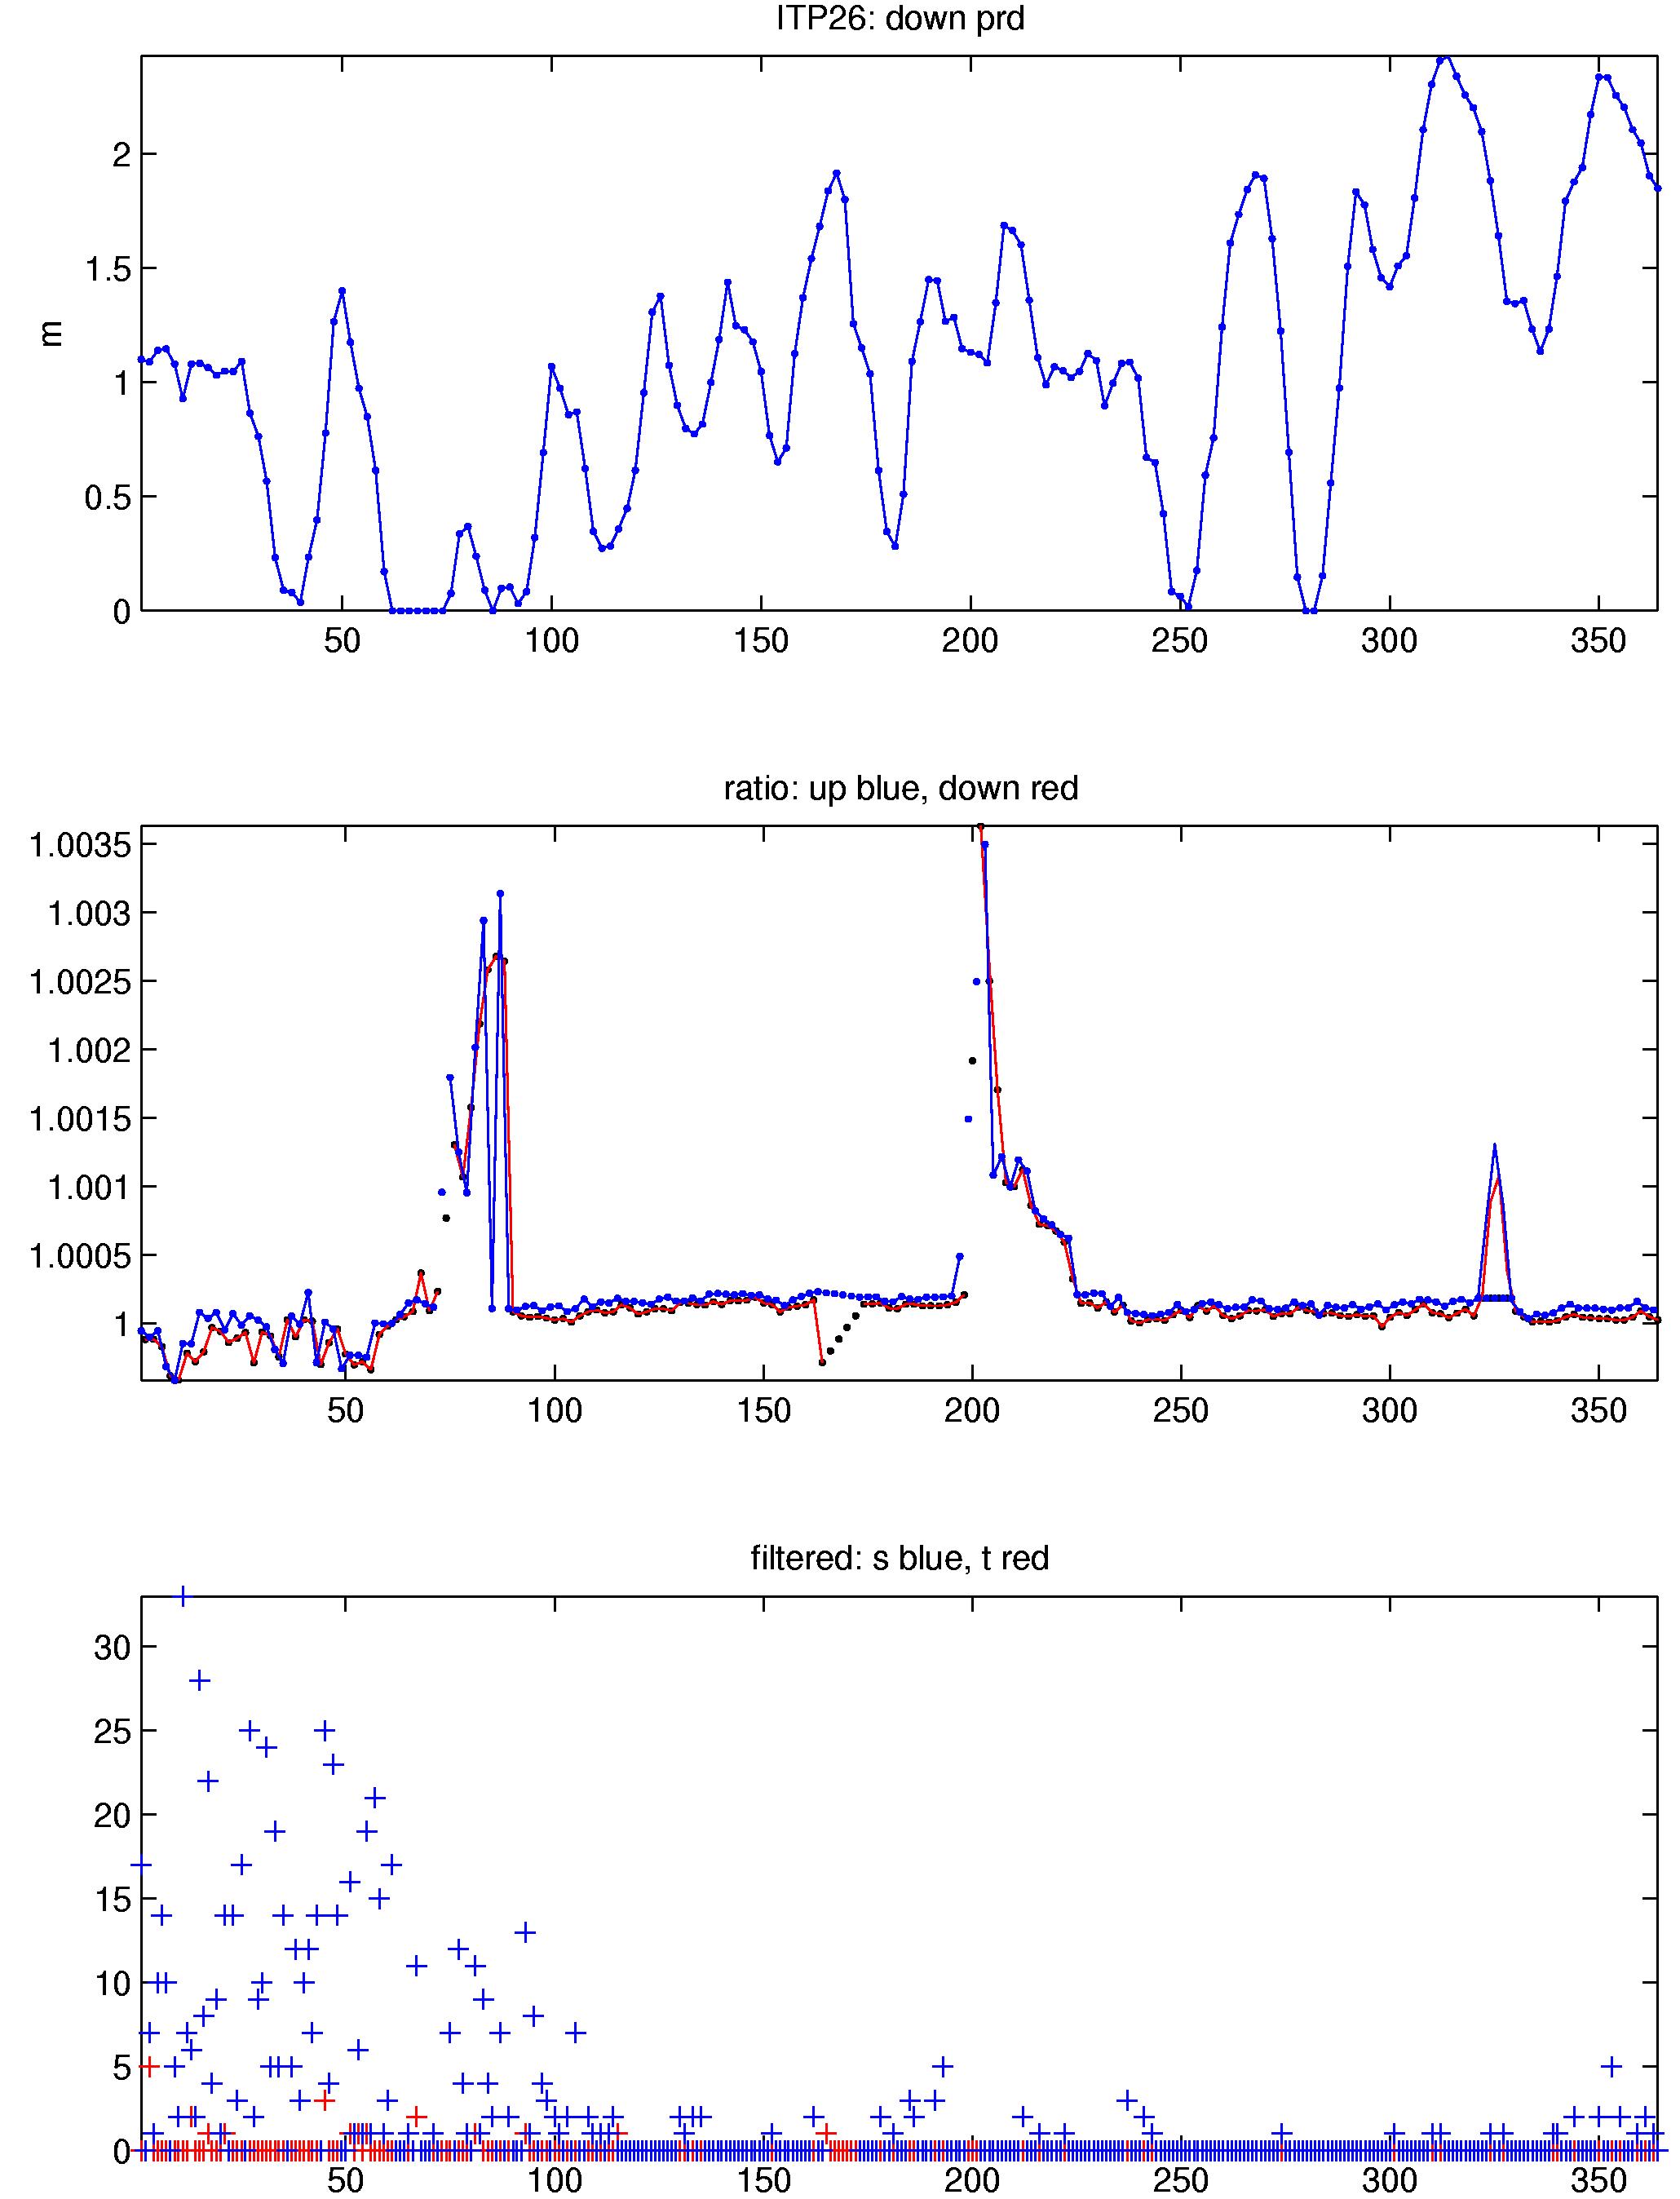
The 364 profiles telemetered by ITP 26 were processed according to the procedures described in the ITP Updated Data Processing Procedures. The processing parameters for this ITP are shown in the figures to the right. Buoy drift speeds were almost always less than 30 cm/s, and the profiler covered the full extent of every profile.
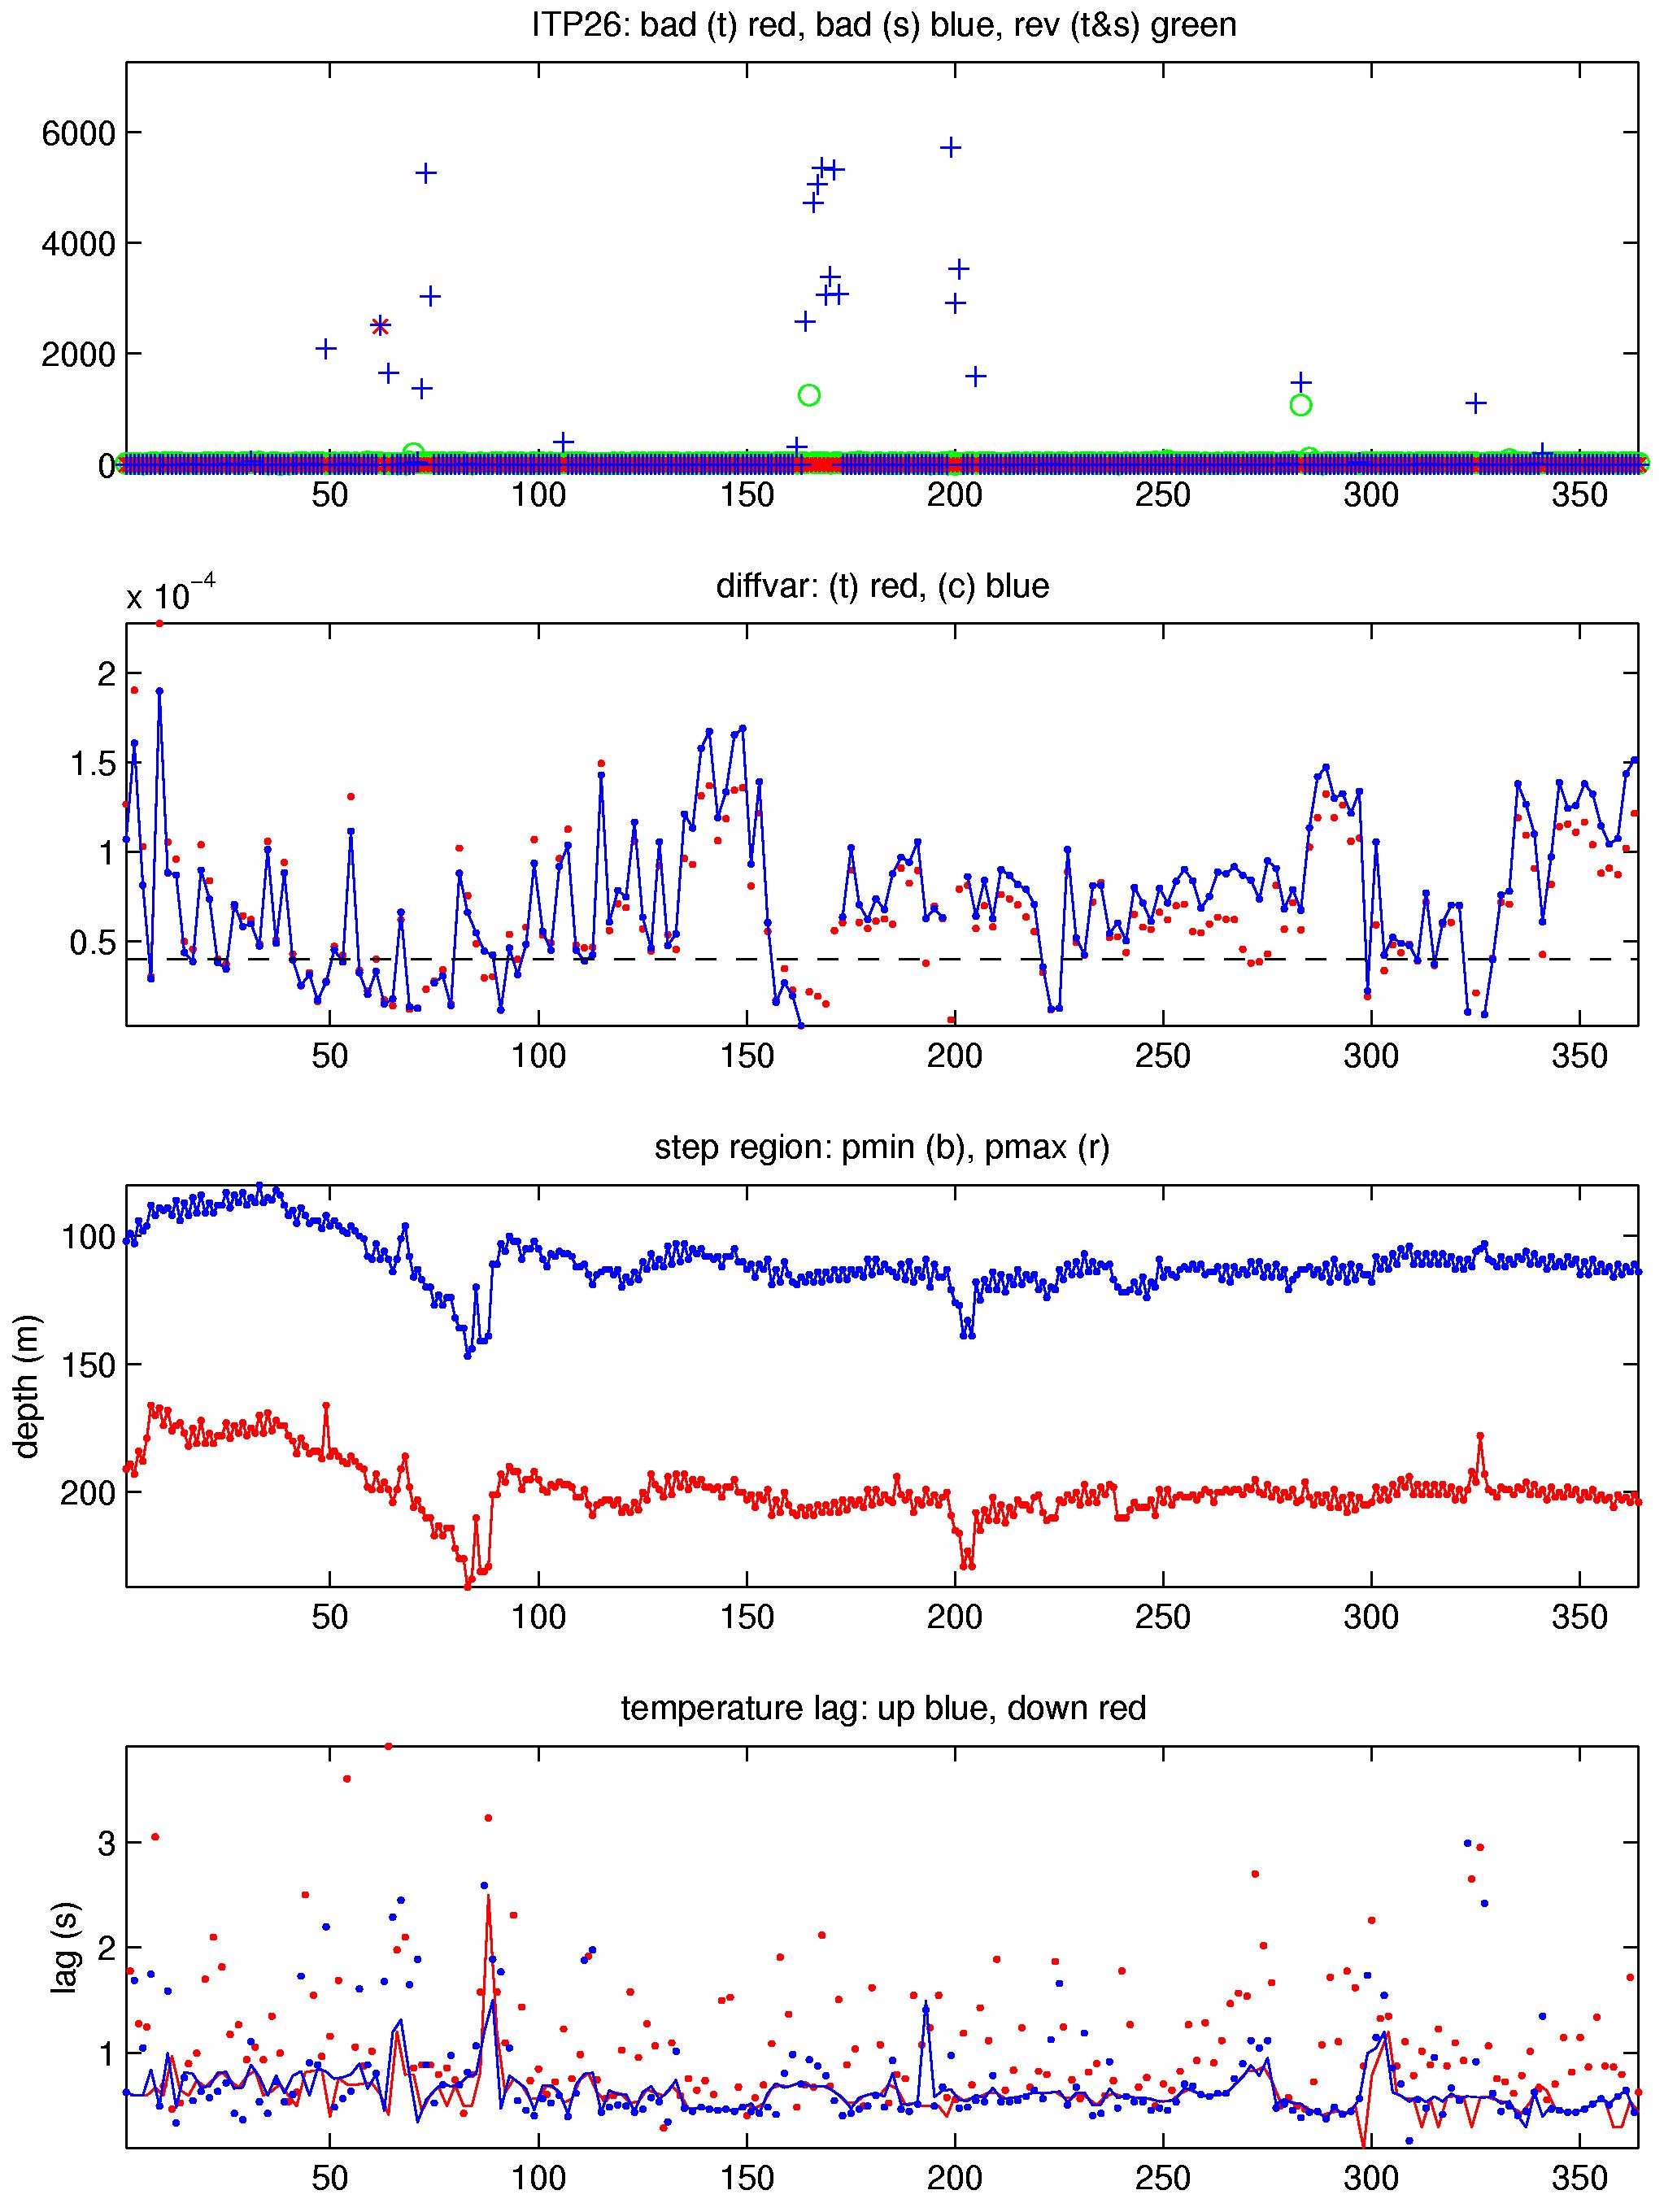
The CTD data required some editing for biofouling or similar glitches. In most cases these were short conductivity spikes, although for some profiles significant portions of the conductivity record were eliminated; 13 profiles were deleted completely. Following these edits, ITP26 had a 95% good data return.
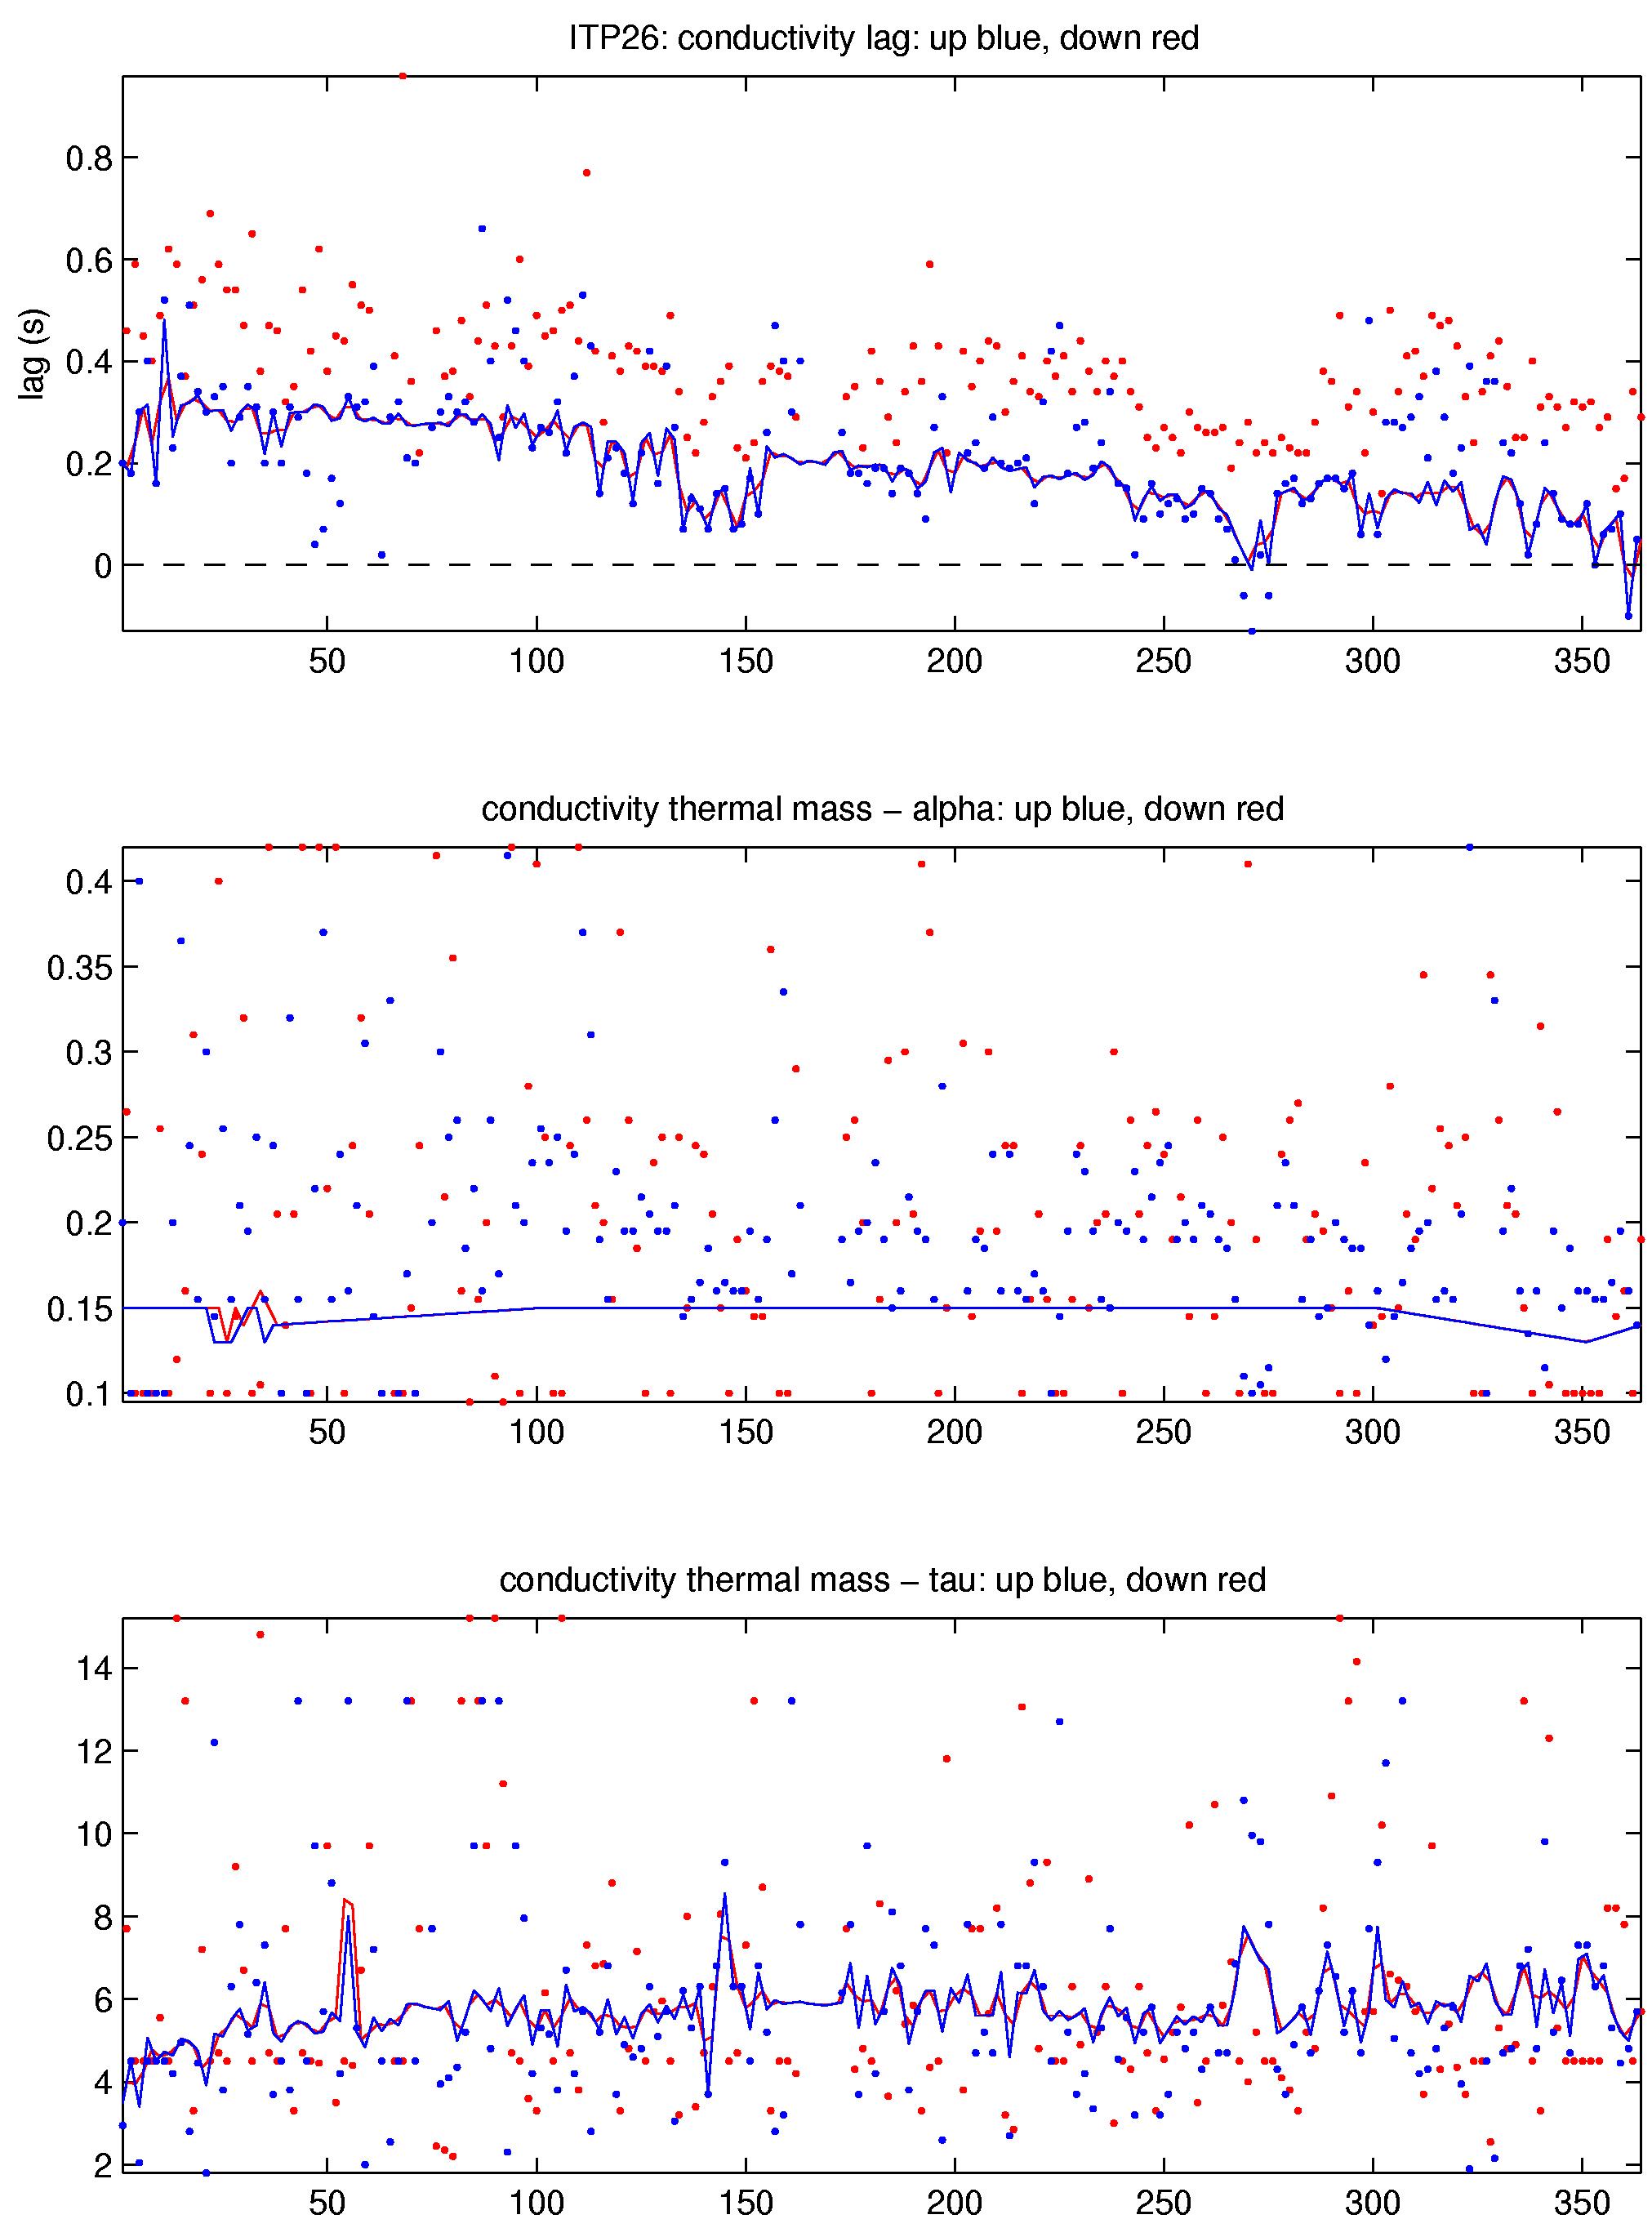
Thermohaline staircases were present for most of the time series, enabling CTD lag corrections. The lags were in the typical range found for previous systems. During manual editing, about 60 profiles had temperature lags and/or thermal lags modified. The TS staircases for this record typically consisted of very short steps above 200 dbar followed by longer steps below. It seems that the shortest steps may have generated lag values that then overcorrected the longer ones.
The conductivity adjustment ("calibration") was mostly constant and close to unity. However, three portions of the record stuck out with larger adjustments. The first instance (near profile 168) was based on apparently contaminated profiles that were mostly deleted, and the calibration "outlier" disappeared. The second instance (near profile 202) appeared real: while some of the nearby profiles had been edited for conductivity contamination, remaining "clean" profiles showed consistancy at depth after applying the correction. The third instance (near profile 325) was unusual in that the calibration adjustment, while "correcting" (bringing in line) the deep portions of the profiles, it caused unrealistic changes to the shallow portions (< 300 dbar). Further, the structure of the affected profiles at depth was different from their neighbors. It was decided that the deep feature could be real, and should not be "corrected away". The initial peak of the conductivity adjustment was therefore removed.
See the Data Products tab to the left for descriptions of the three levels (I, II, III) of data processing and to access all data.
