ITP 4 Data Processing
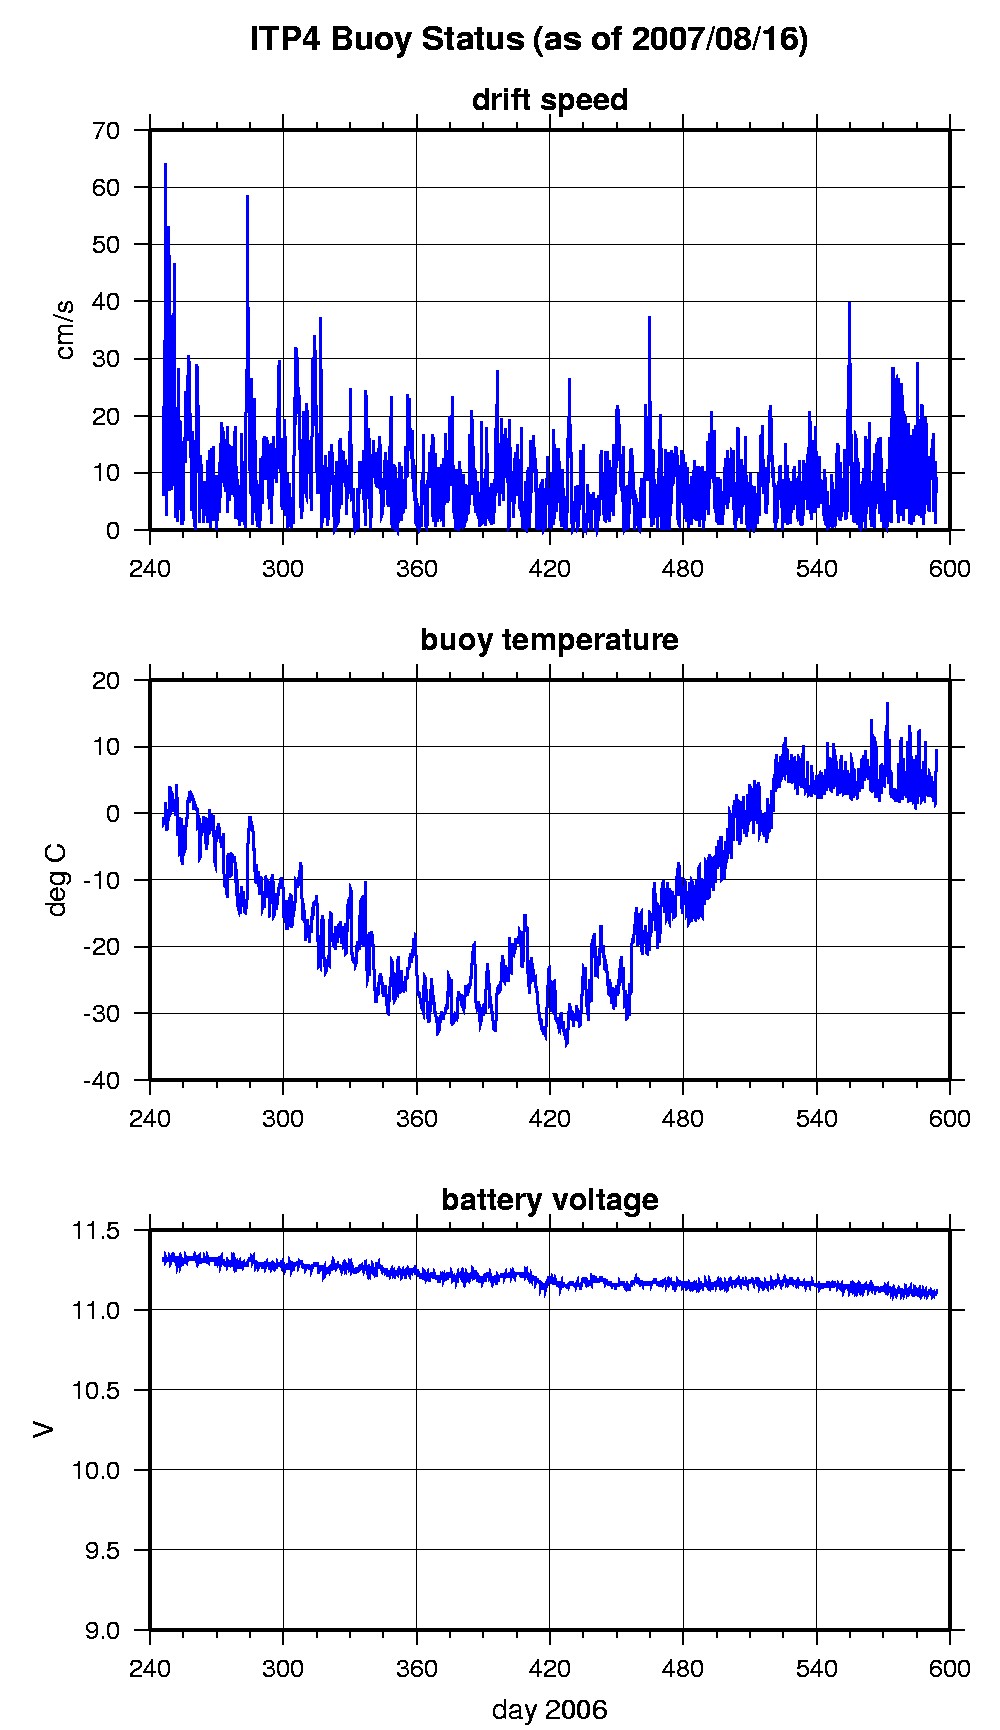
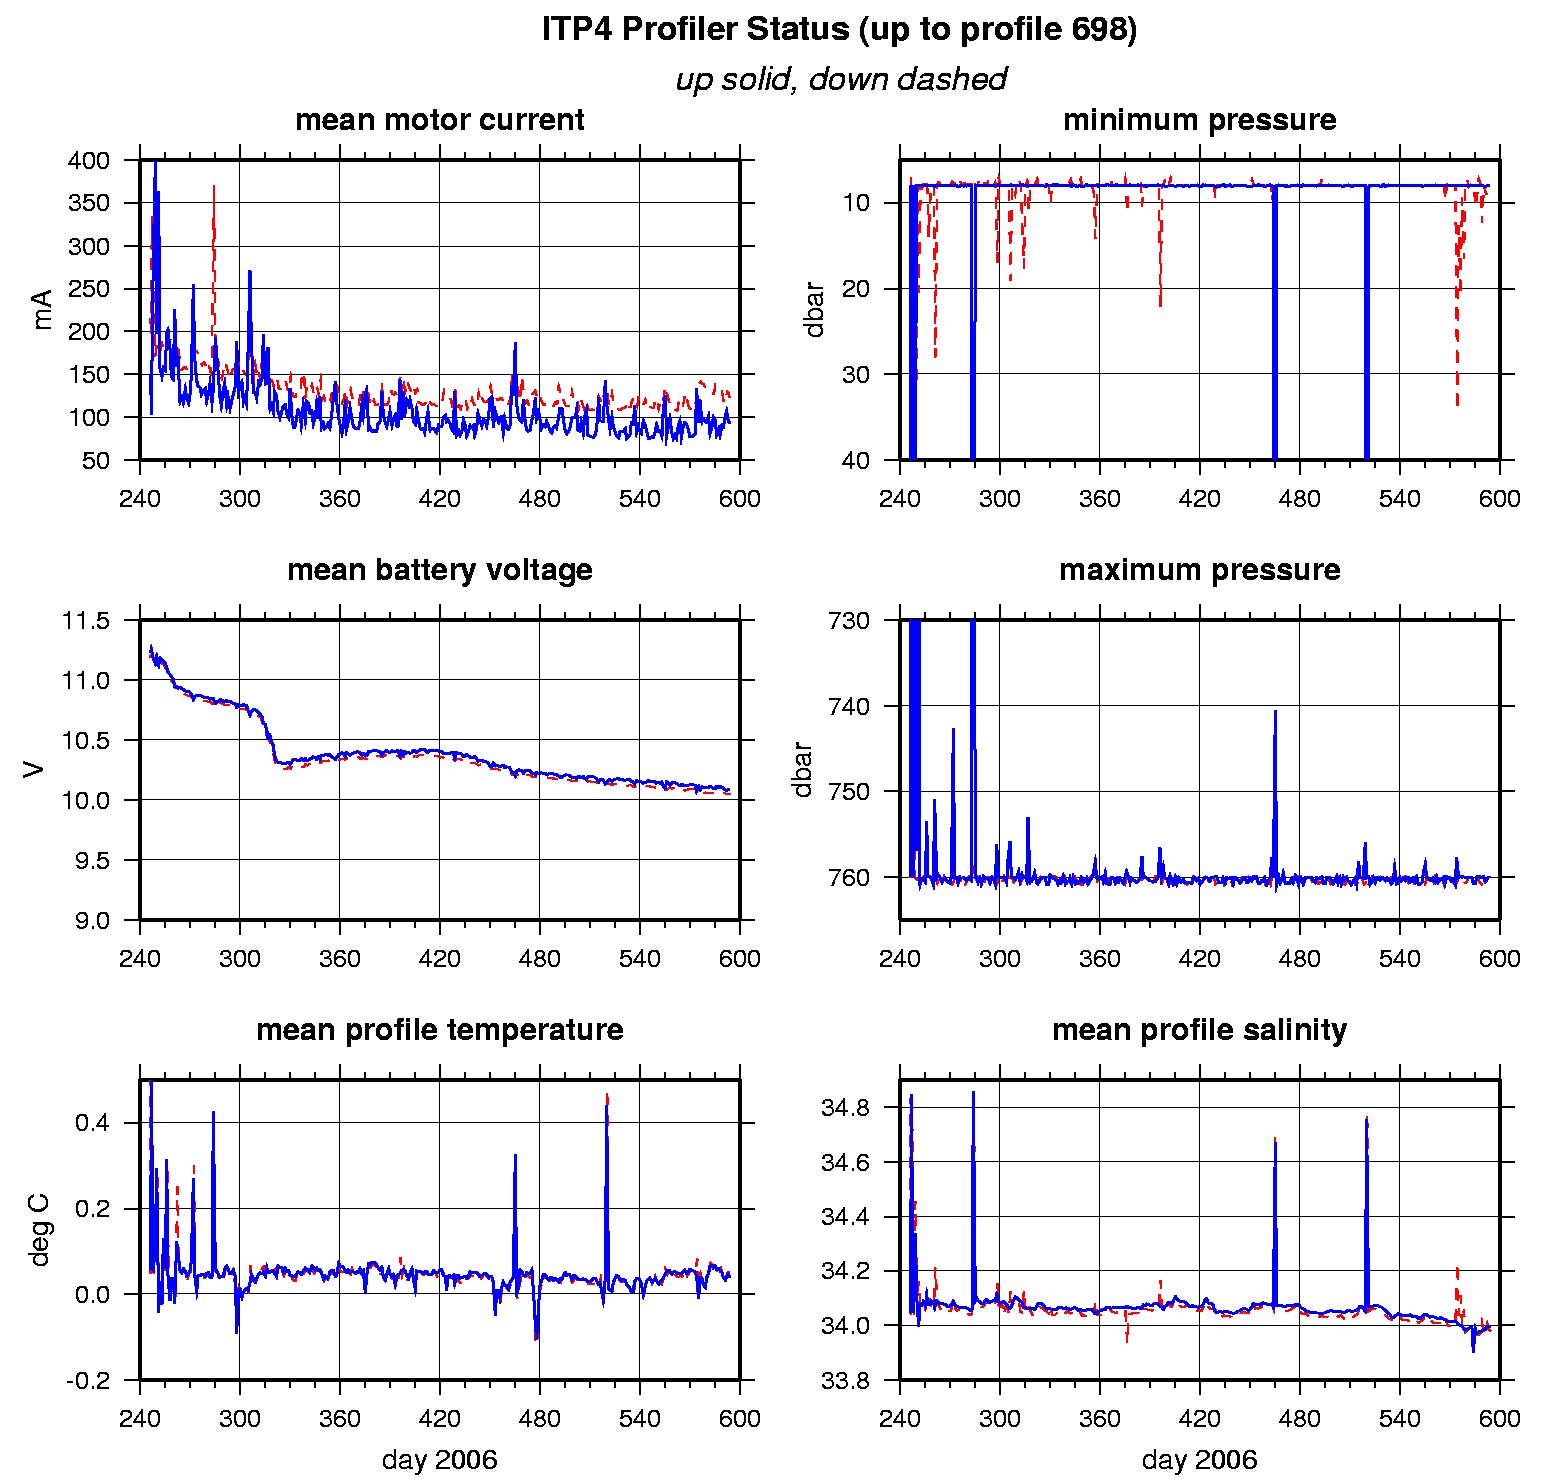
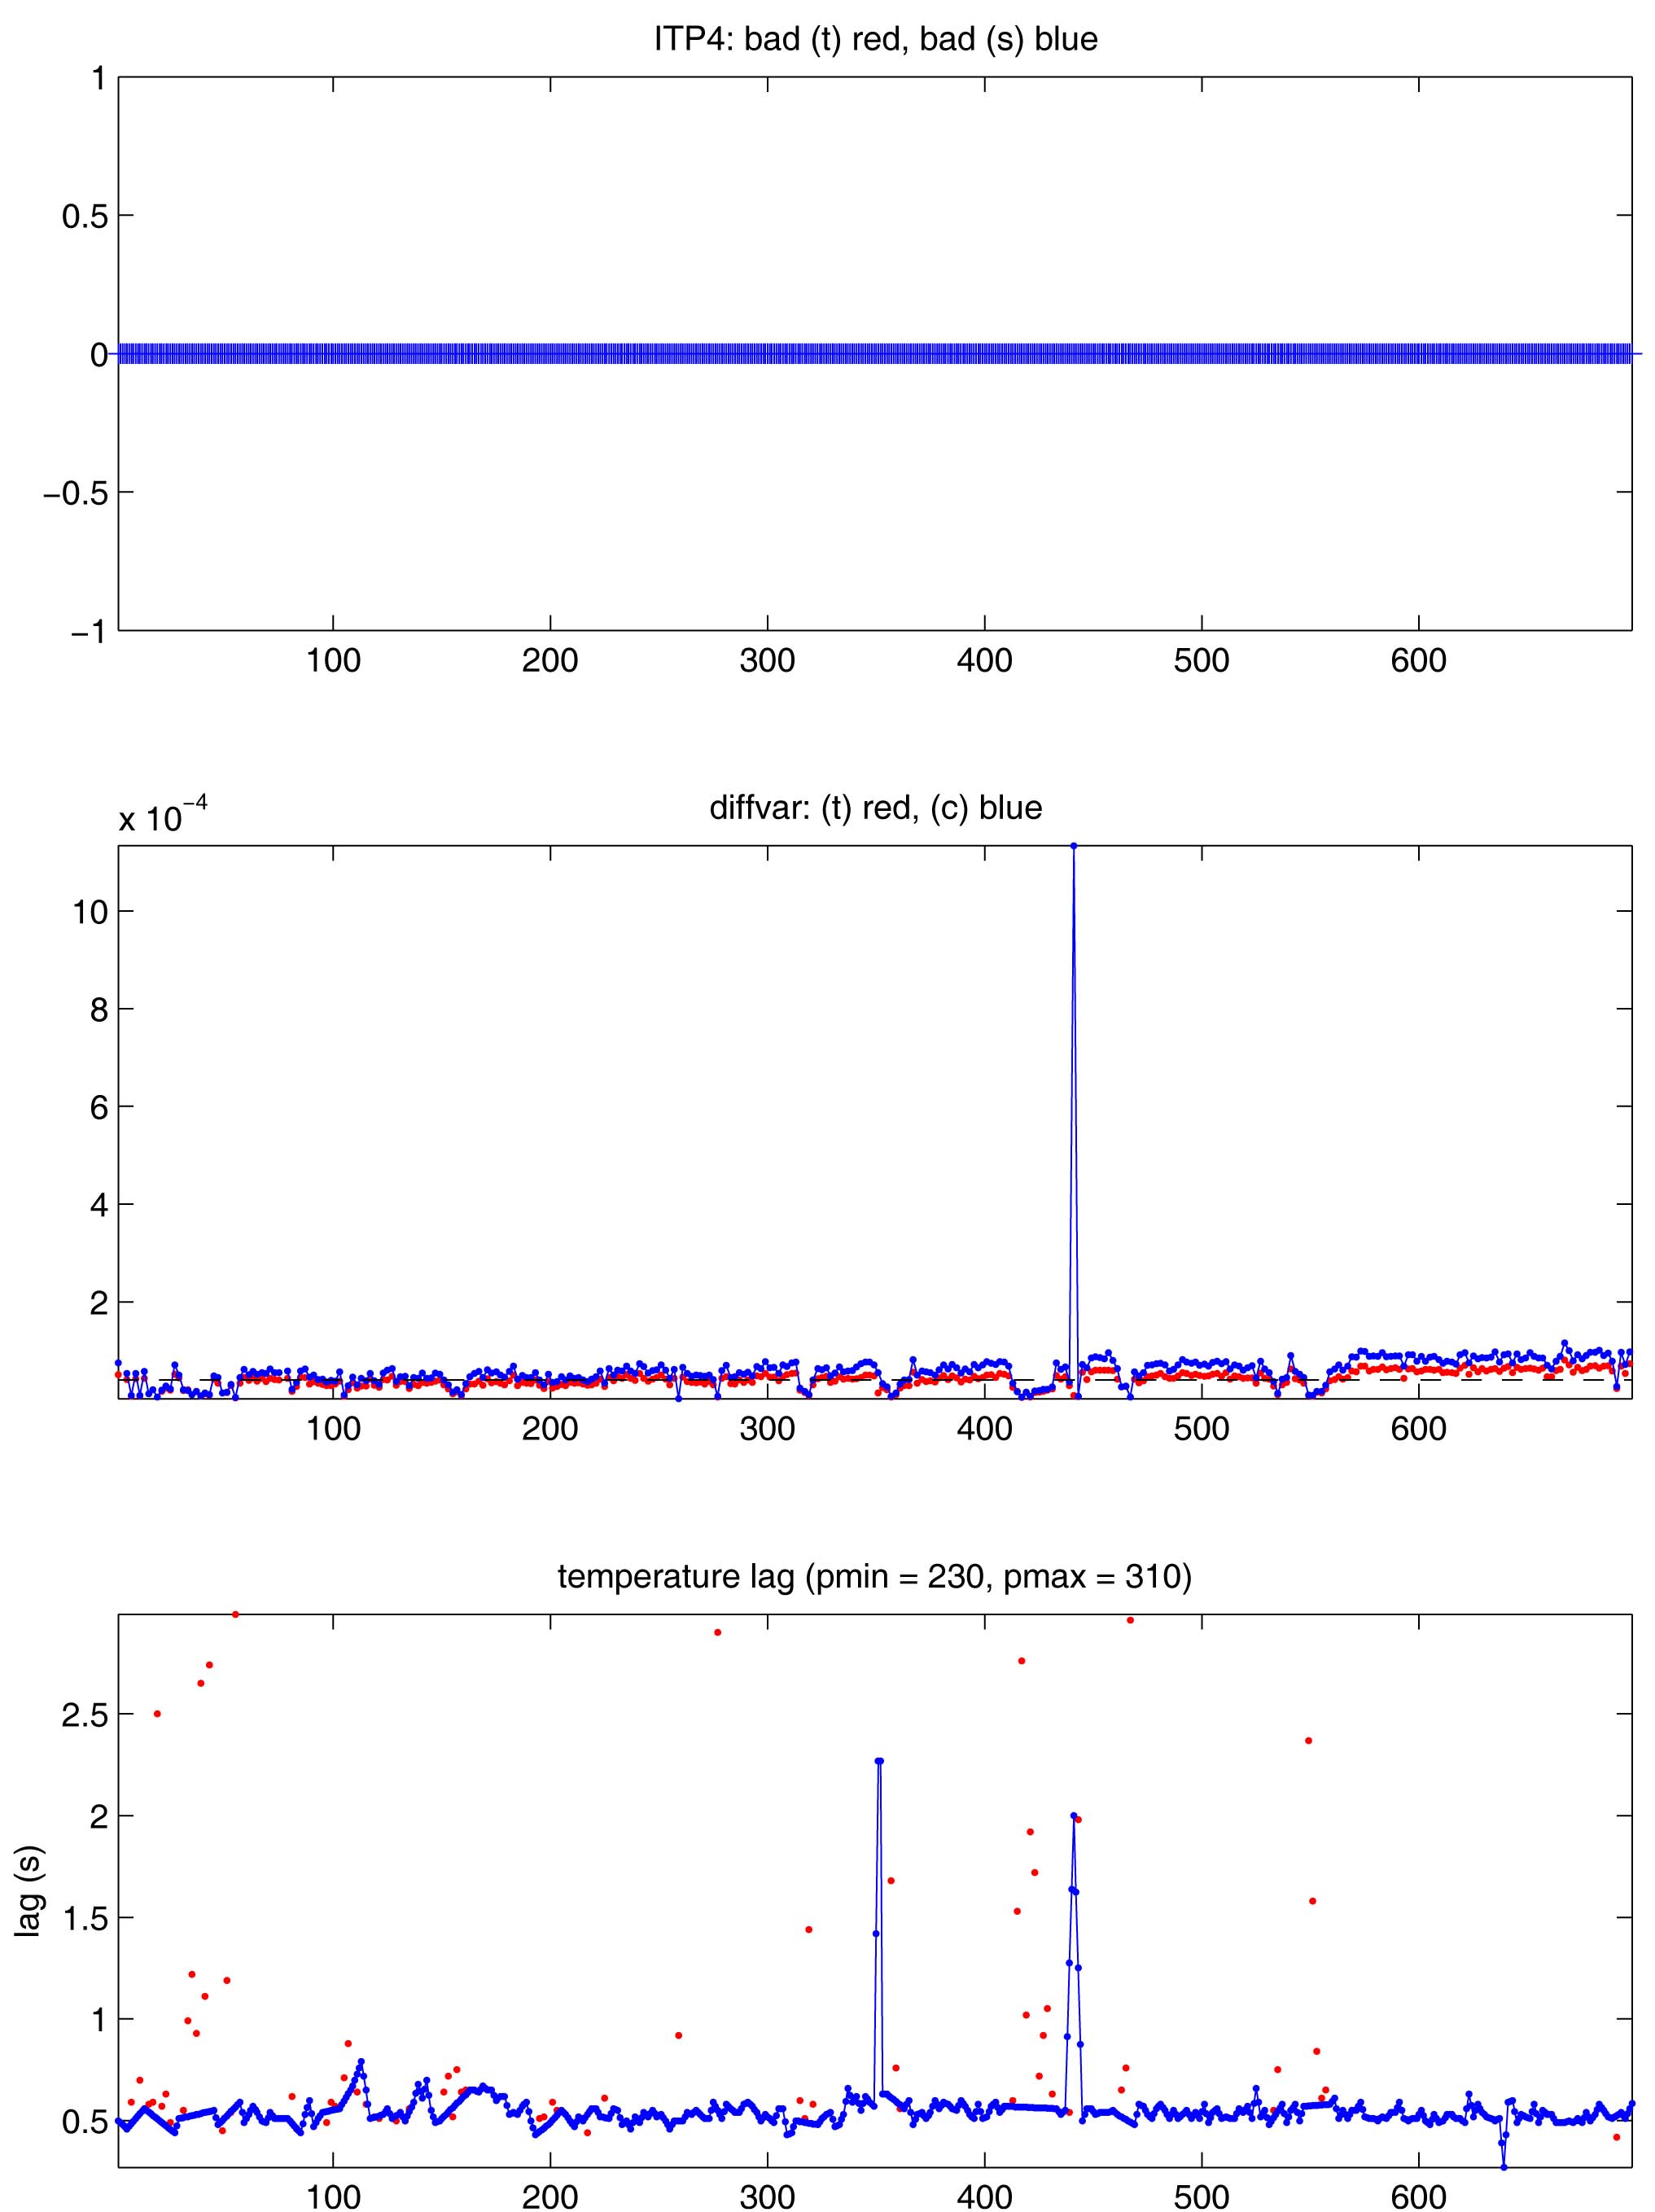
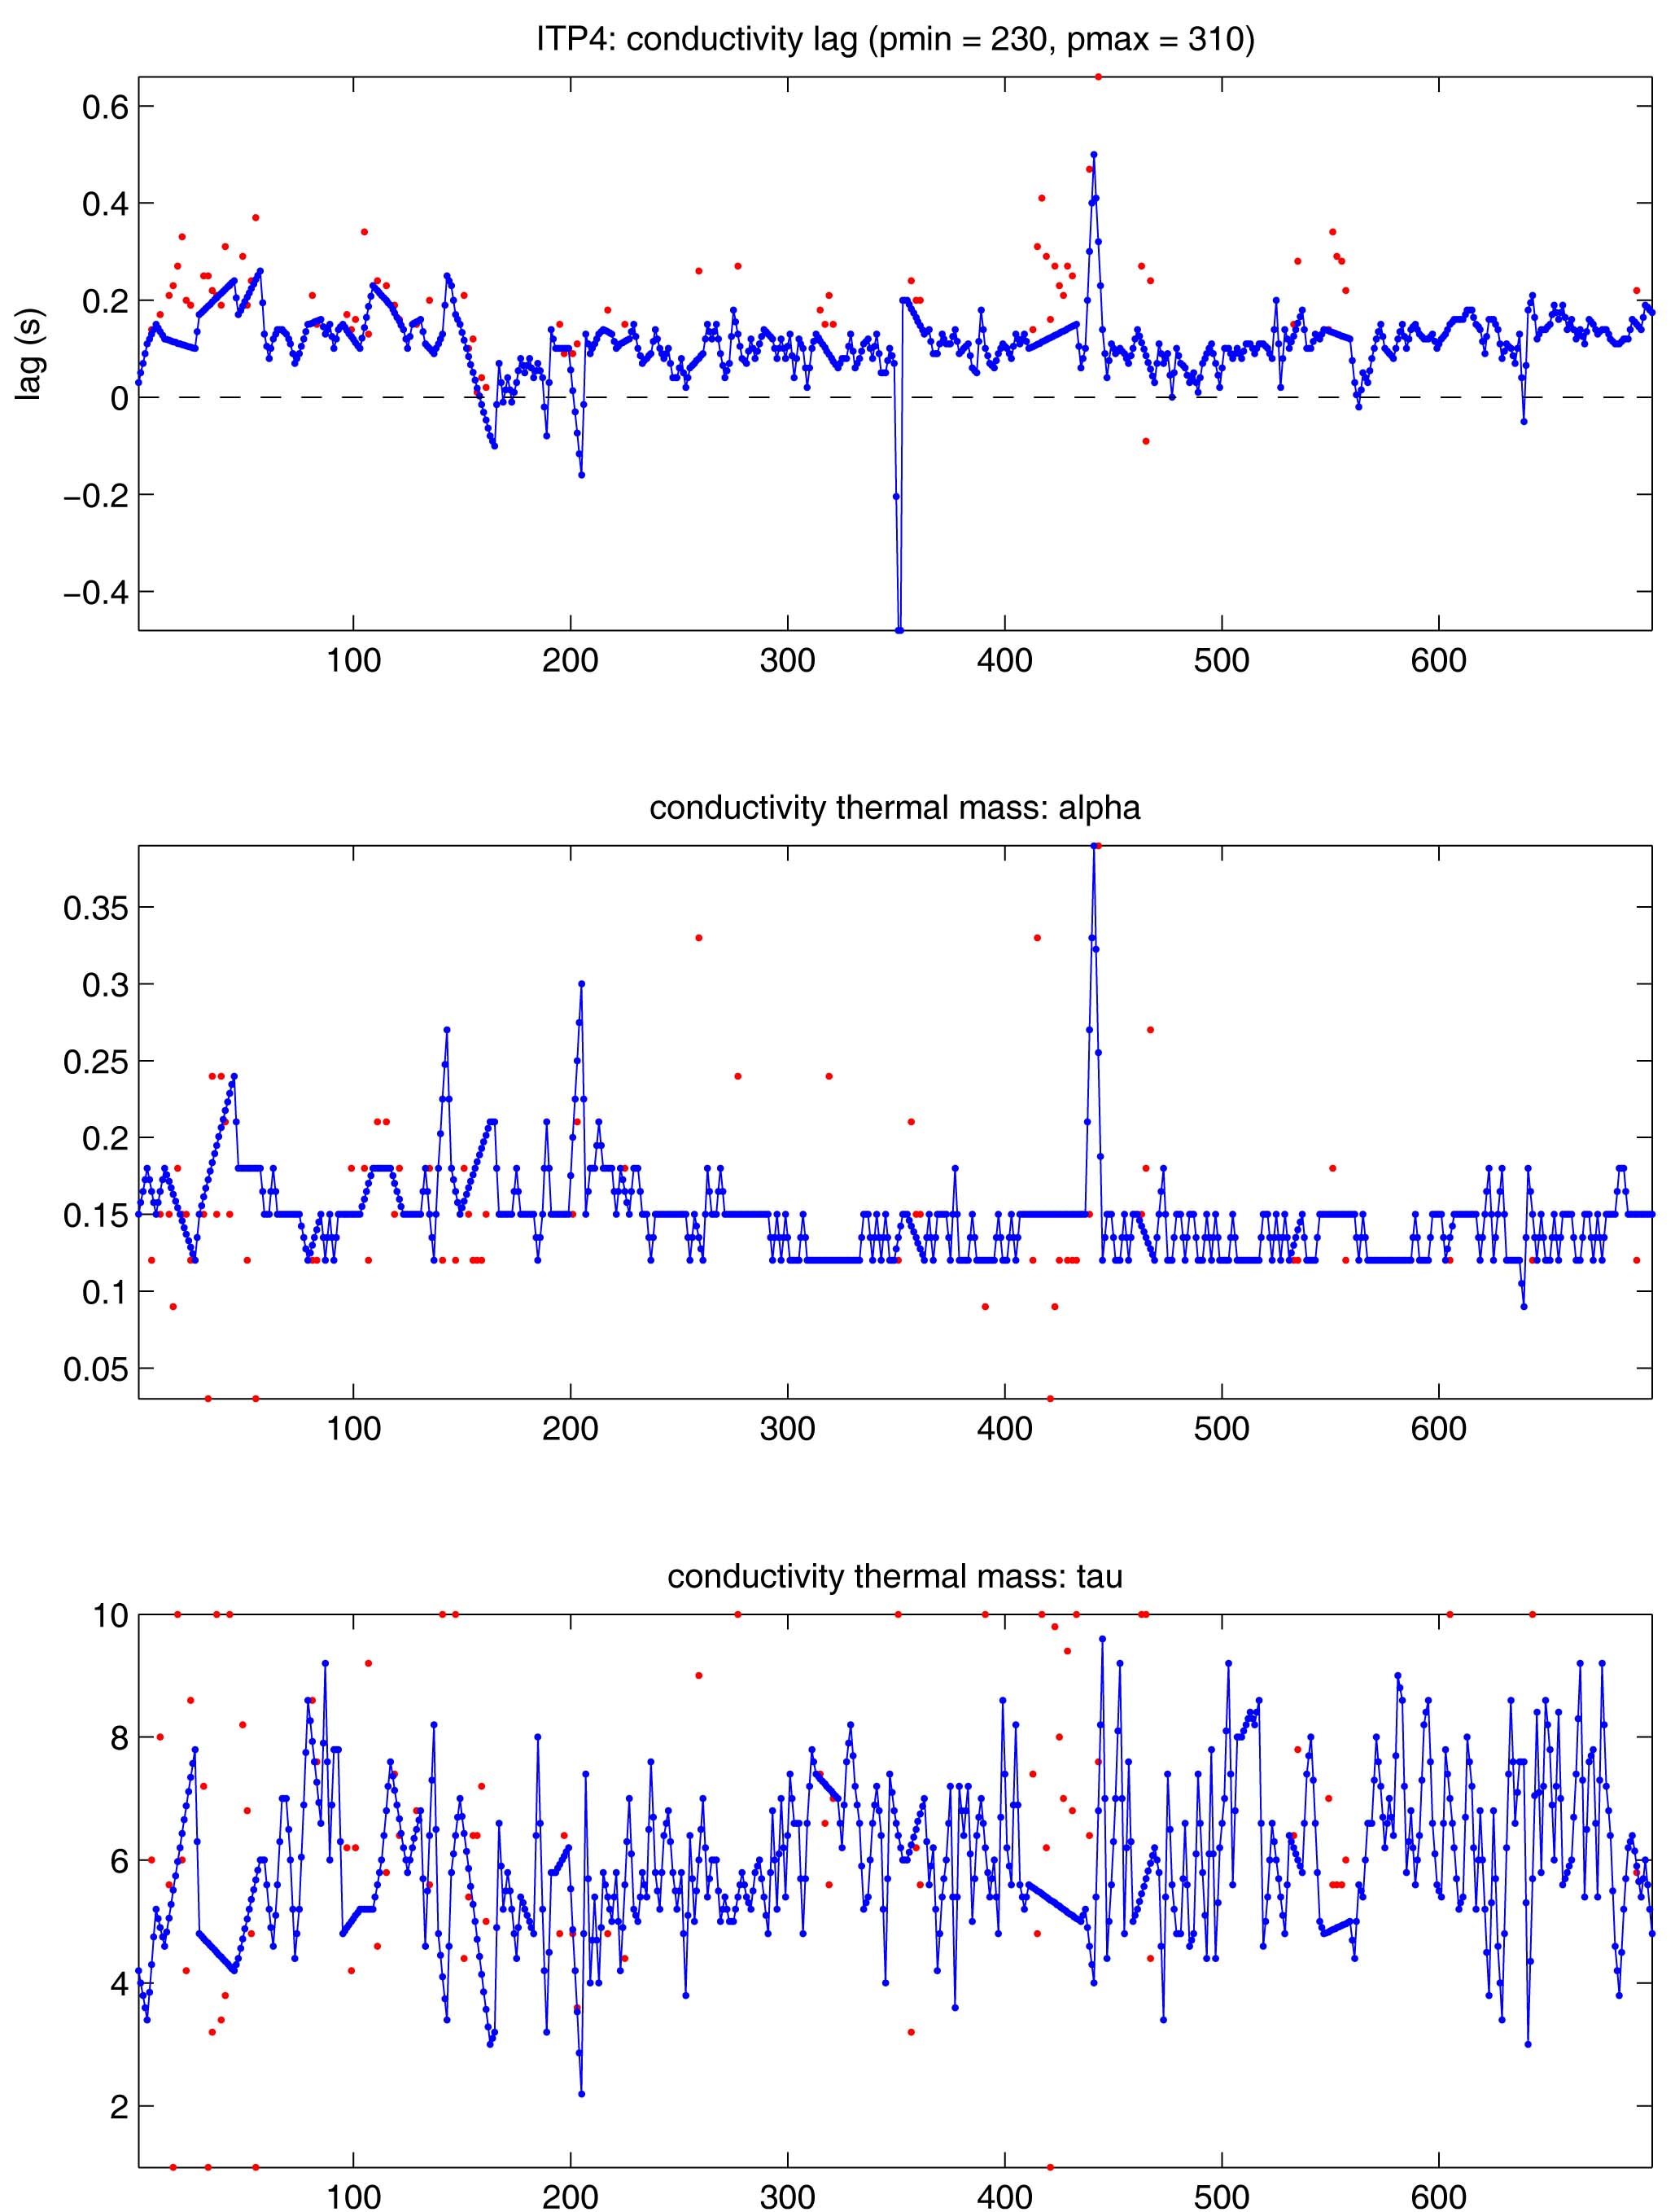
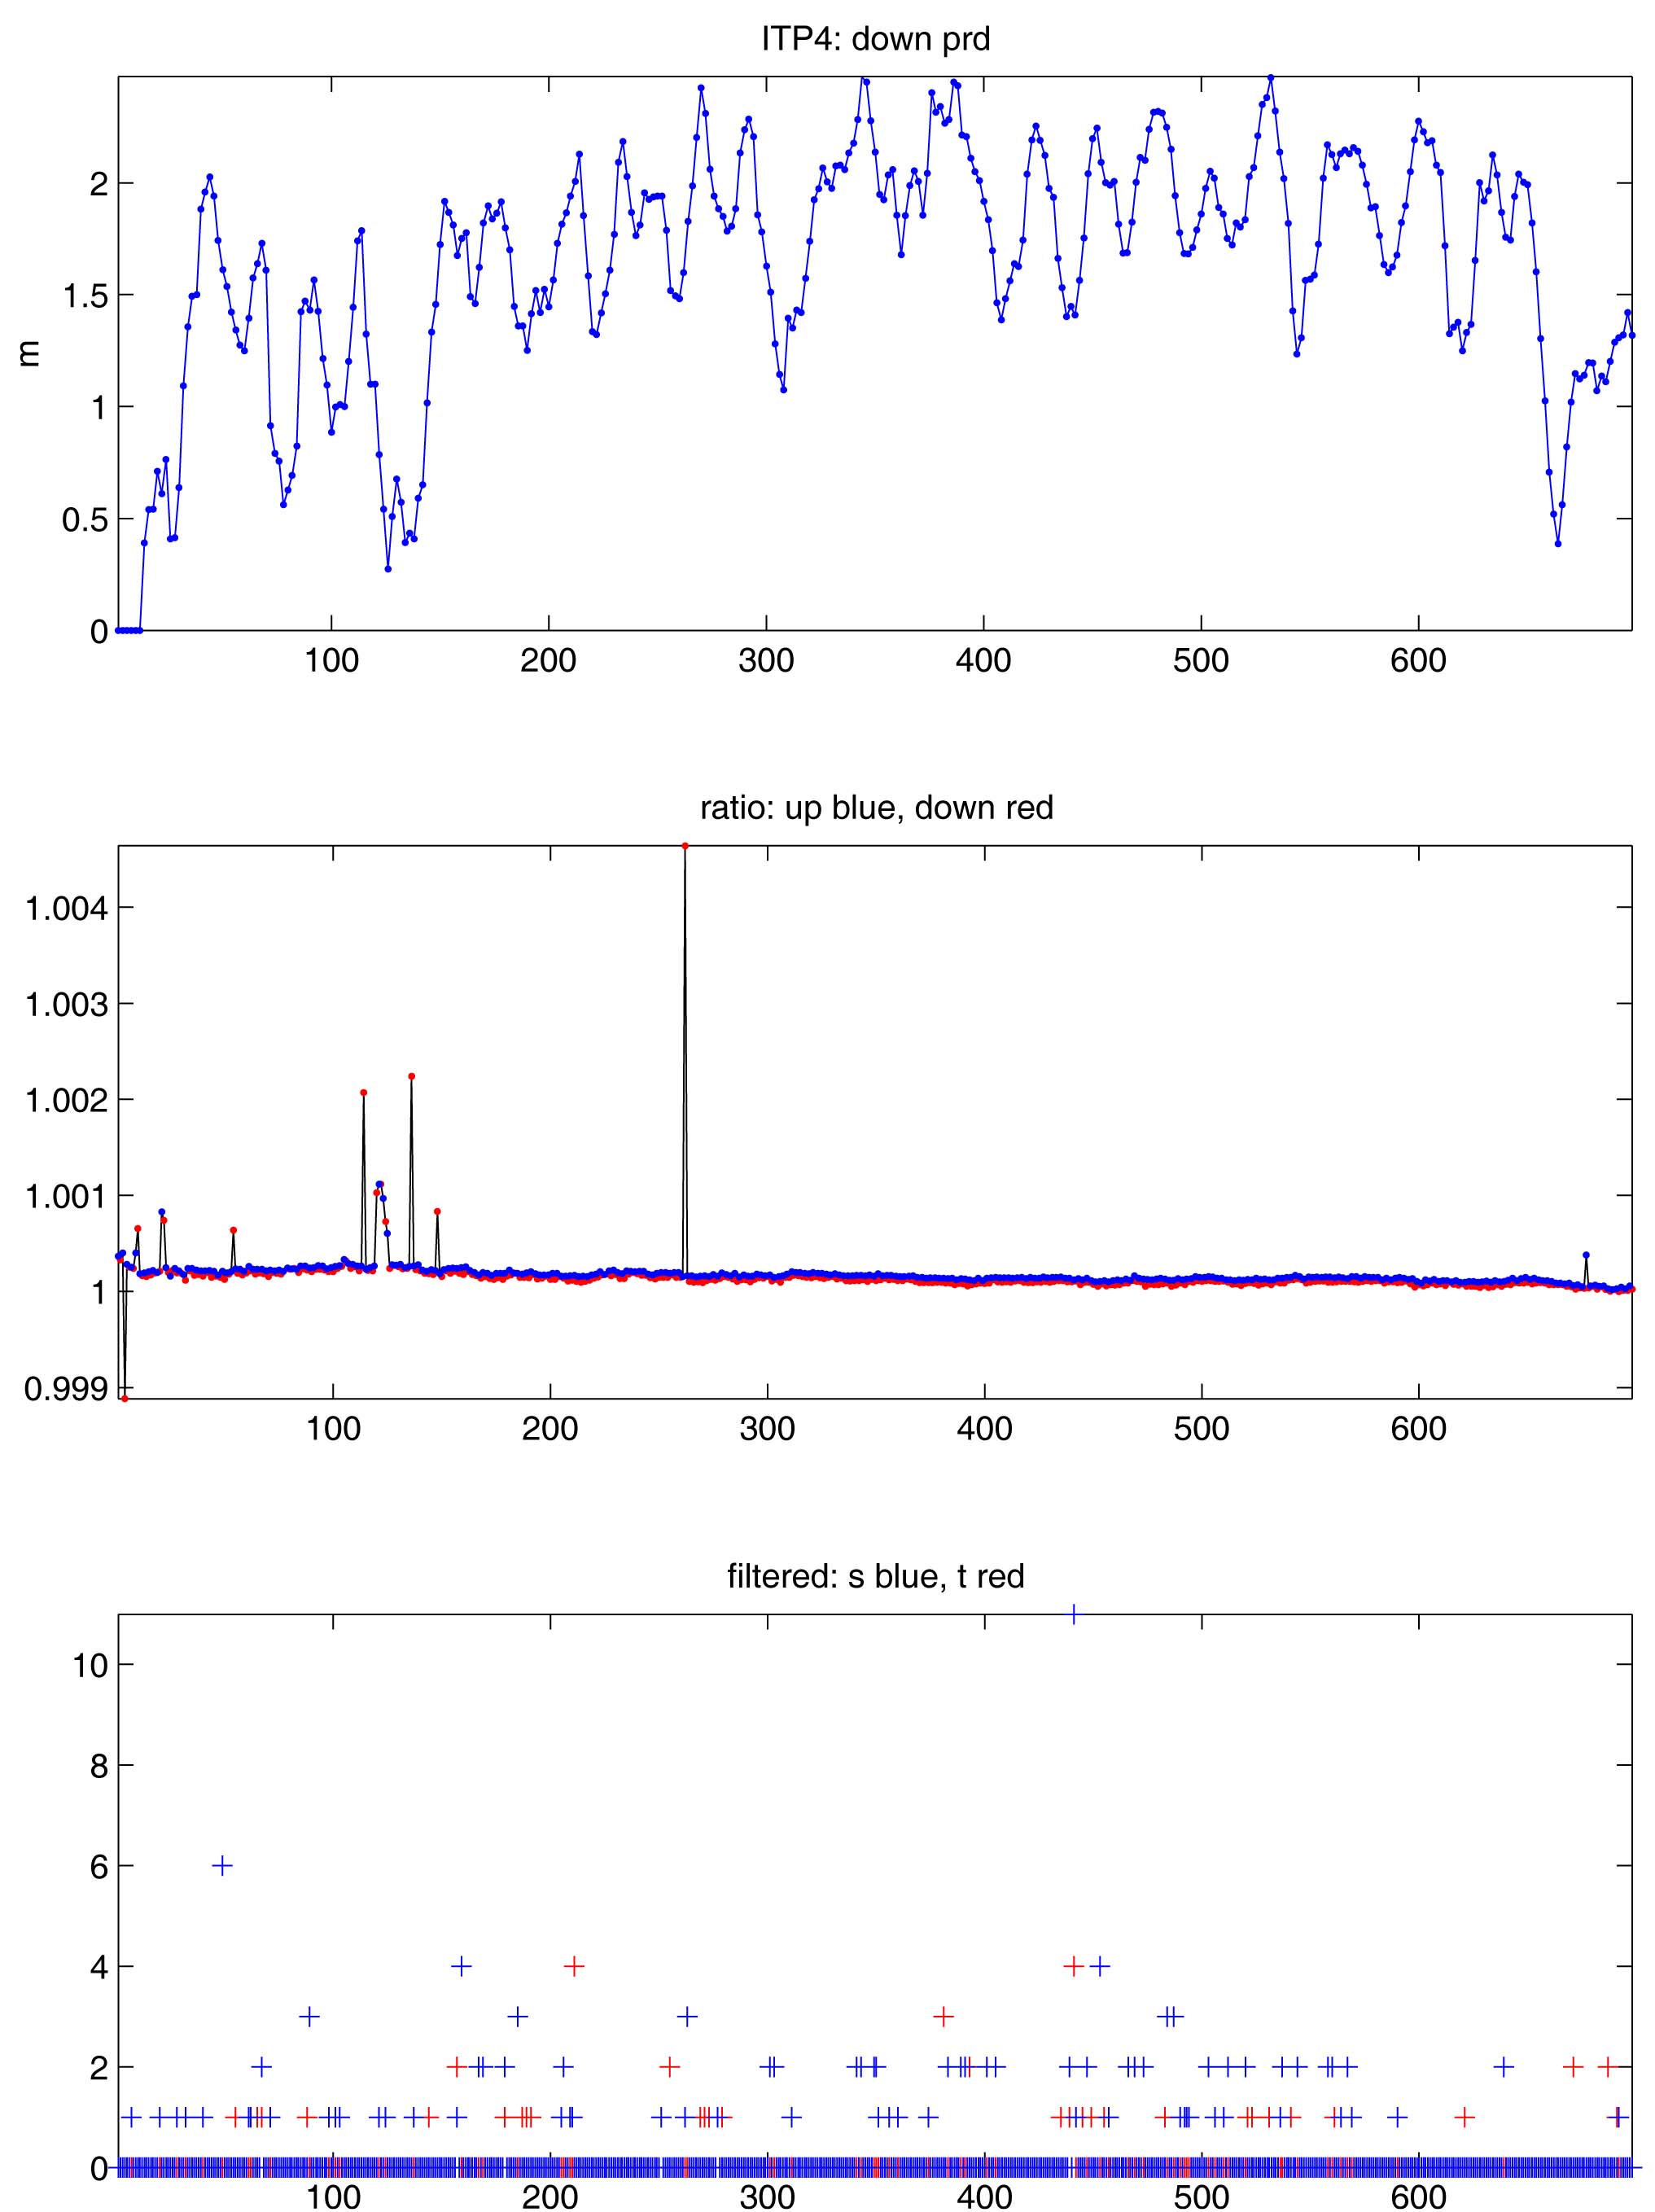
The 698 profiles that were downloaded from the ITP were processed according to the procedures described in the ITP Data Processing Procedures. The processing parameters for ITP4 are shown in the figures to the right. The quality of the profile time series is exceedingly good. No temperature or conductivity spikes needed removing for being obviously corrupted, although some slight conductivity calibration shifts were aligned. There were no instrument resets, and only profiles 4, 77 and 78 were largely incomplete. The lag coefficients were also uniform throughout the entire year.
See the Data Products tab to the left for descriptions of the three levels (I, II, III) of data processing and to access all data.
