ITP 7 Data Description
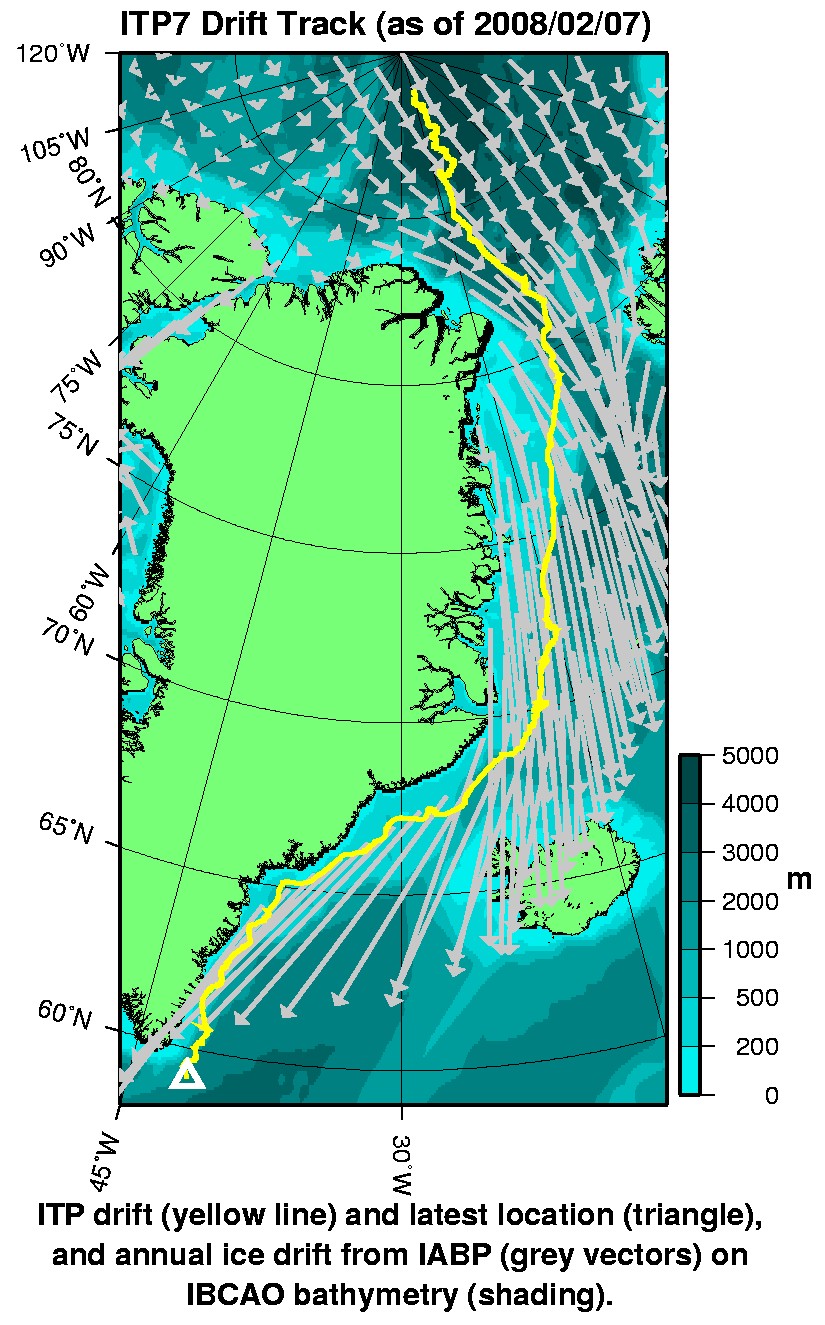
The ITP profiler was configured to operate with an accelerated sampling schedule of 4 one-way profiles between 7 and 760 m depth each day, as it was expected to reach Fram Strait in less than a year. In the surface package, the GPS receiver was powered hourly to obtain locations, and buoy temperature and battery voltage status were recorded.
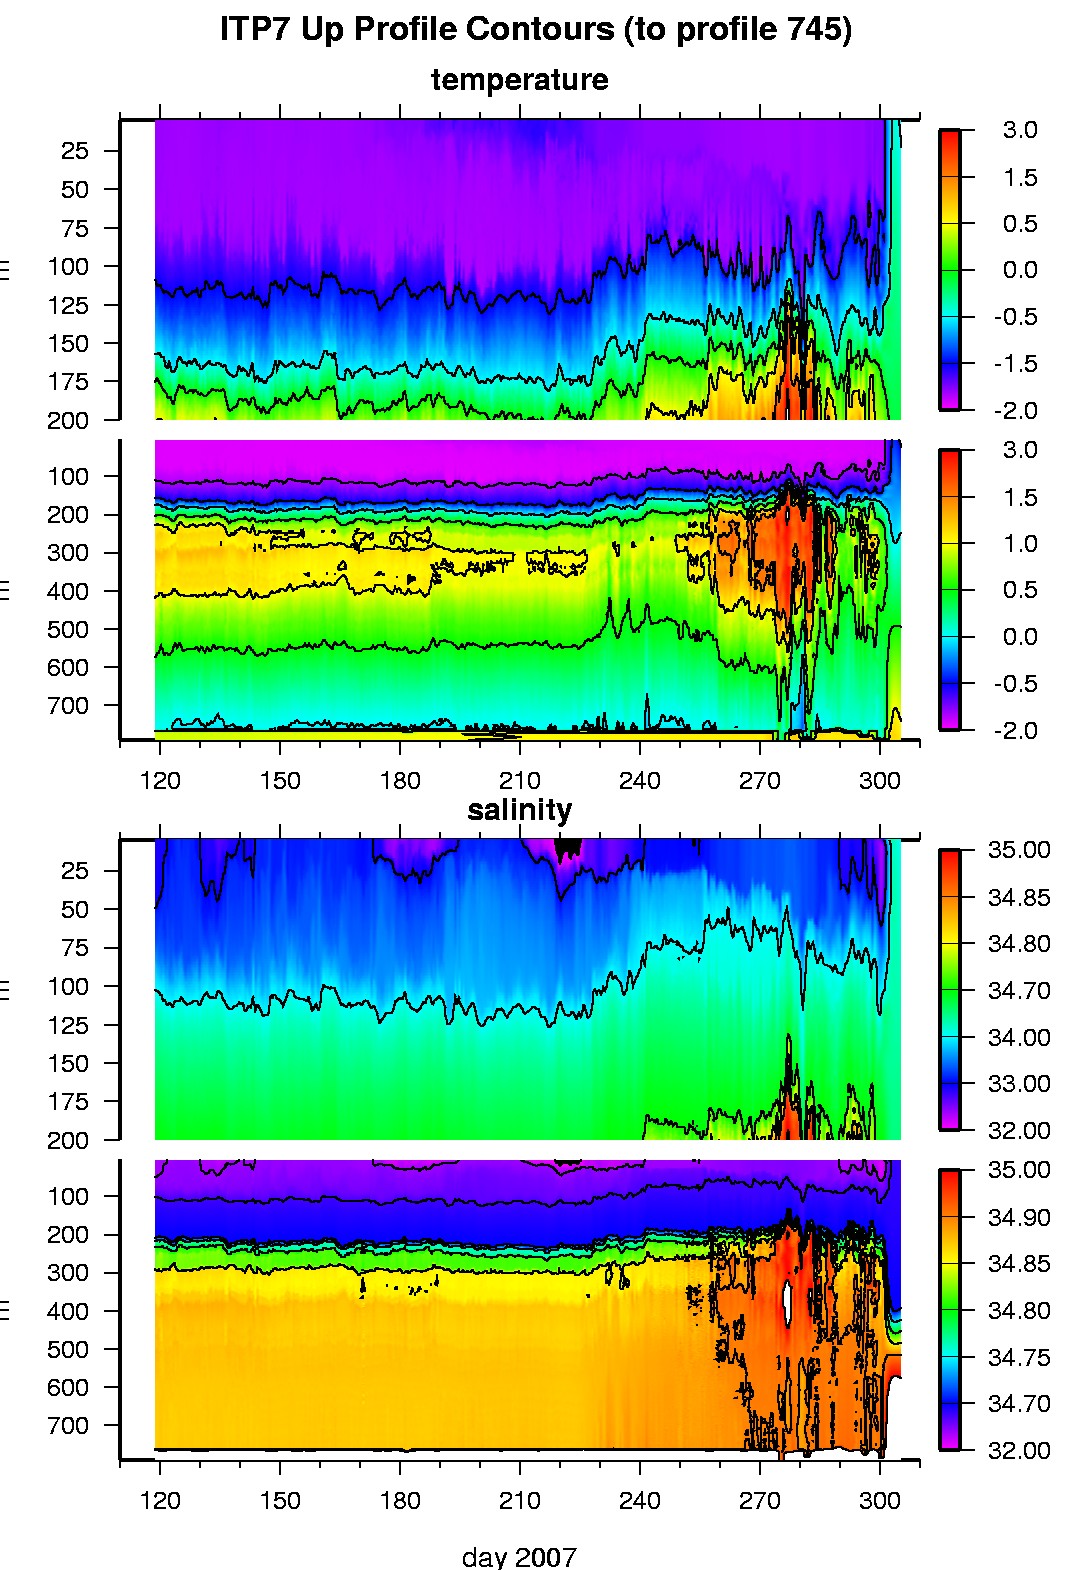
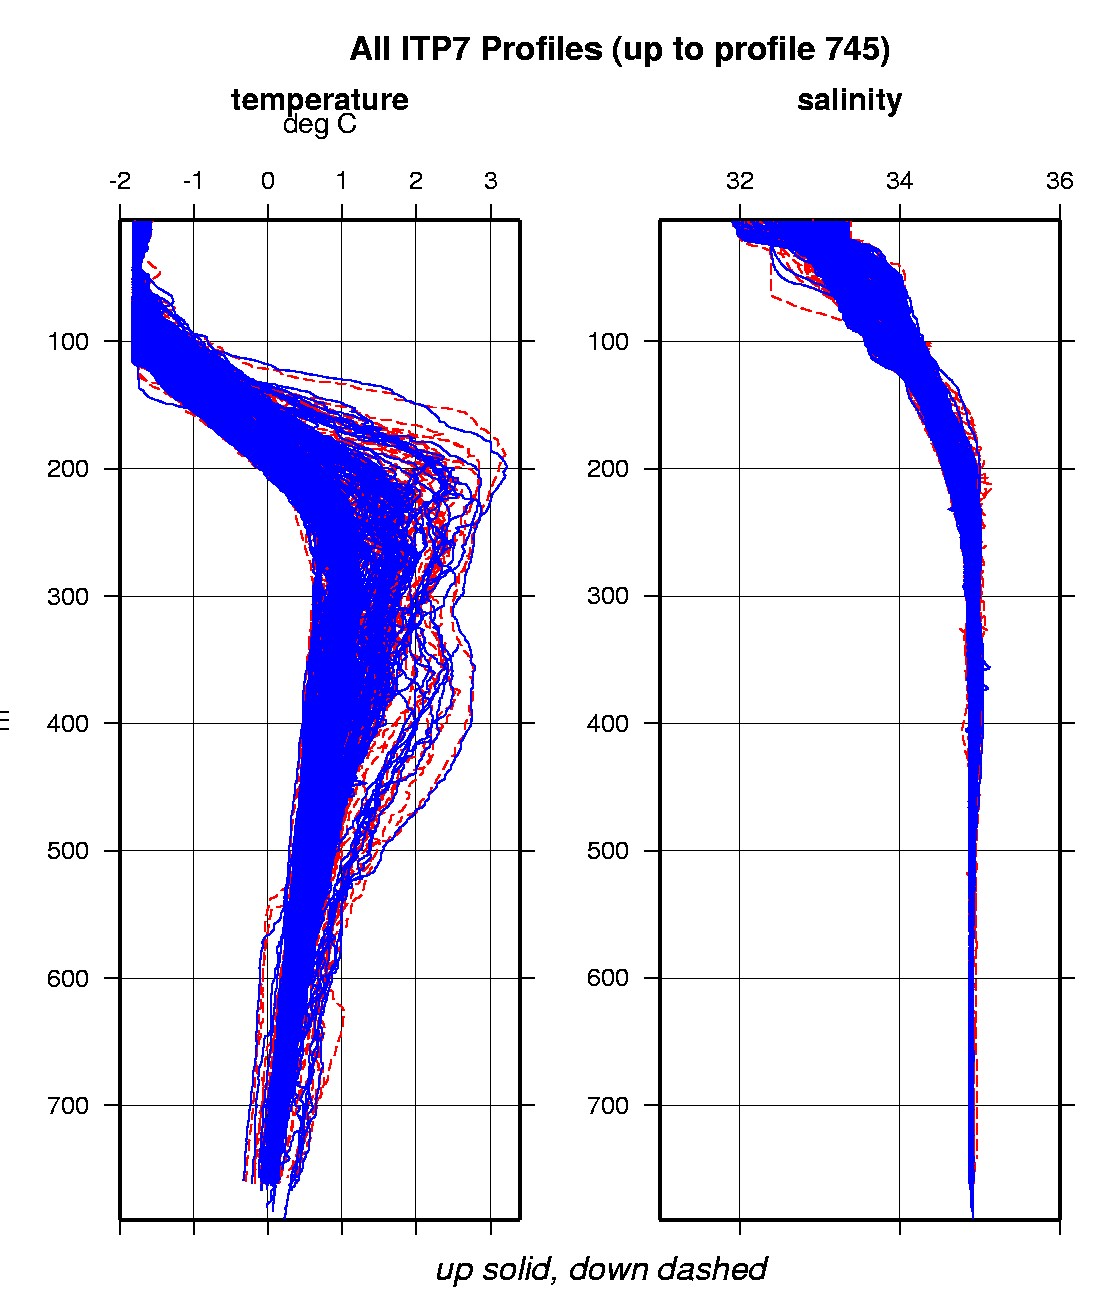
The profiler operated reliably and transmitted data on schedule while the ITP drifted in the basin, and through Fram Strait. The platform speed increased beginning in mid-September as it accelerated through Fram Strait, and the profiler sensor data became increasing corrupted beginning in early October. However, as much of the later data as possible has been preserved (see Data Processing section), as it able to delineate the water masses of the Arctic Basin, the West Spitsbergen and East Greenland Currents. The mooring apparently began dragging on the shallow East Greenland shelf on October 27, and parted 5 days later. The surface package continued to transmit GPS locations and status for another 100 days, and then was not heard from again.
The plots to the right are of the final, calibrated, edited data (as opposed to the raw data presented on the active instrument pages).
See the Data Products tab to the left for descriptions of the three levels (I, II, III) of data processing and to access all data.
ITP 7 data can also be found at the links below:
Level II hourly buoy location data in ASCII format: itp7rawlocs.dat
Level III 1-Hz processed profile data in MATLAB format: itp7cormat.tar.Z and itp7cormat.zip
Level III 1-db bin-averaged processed profile data in MATLAB format: itp7final.mat
Level III 1-db bin-averaged processed profile data in ASCII format: itp7final.tar.Z and itp7final.zip


