ITP18 Data Processing
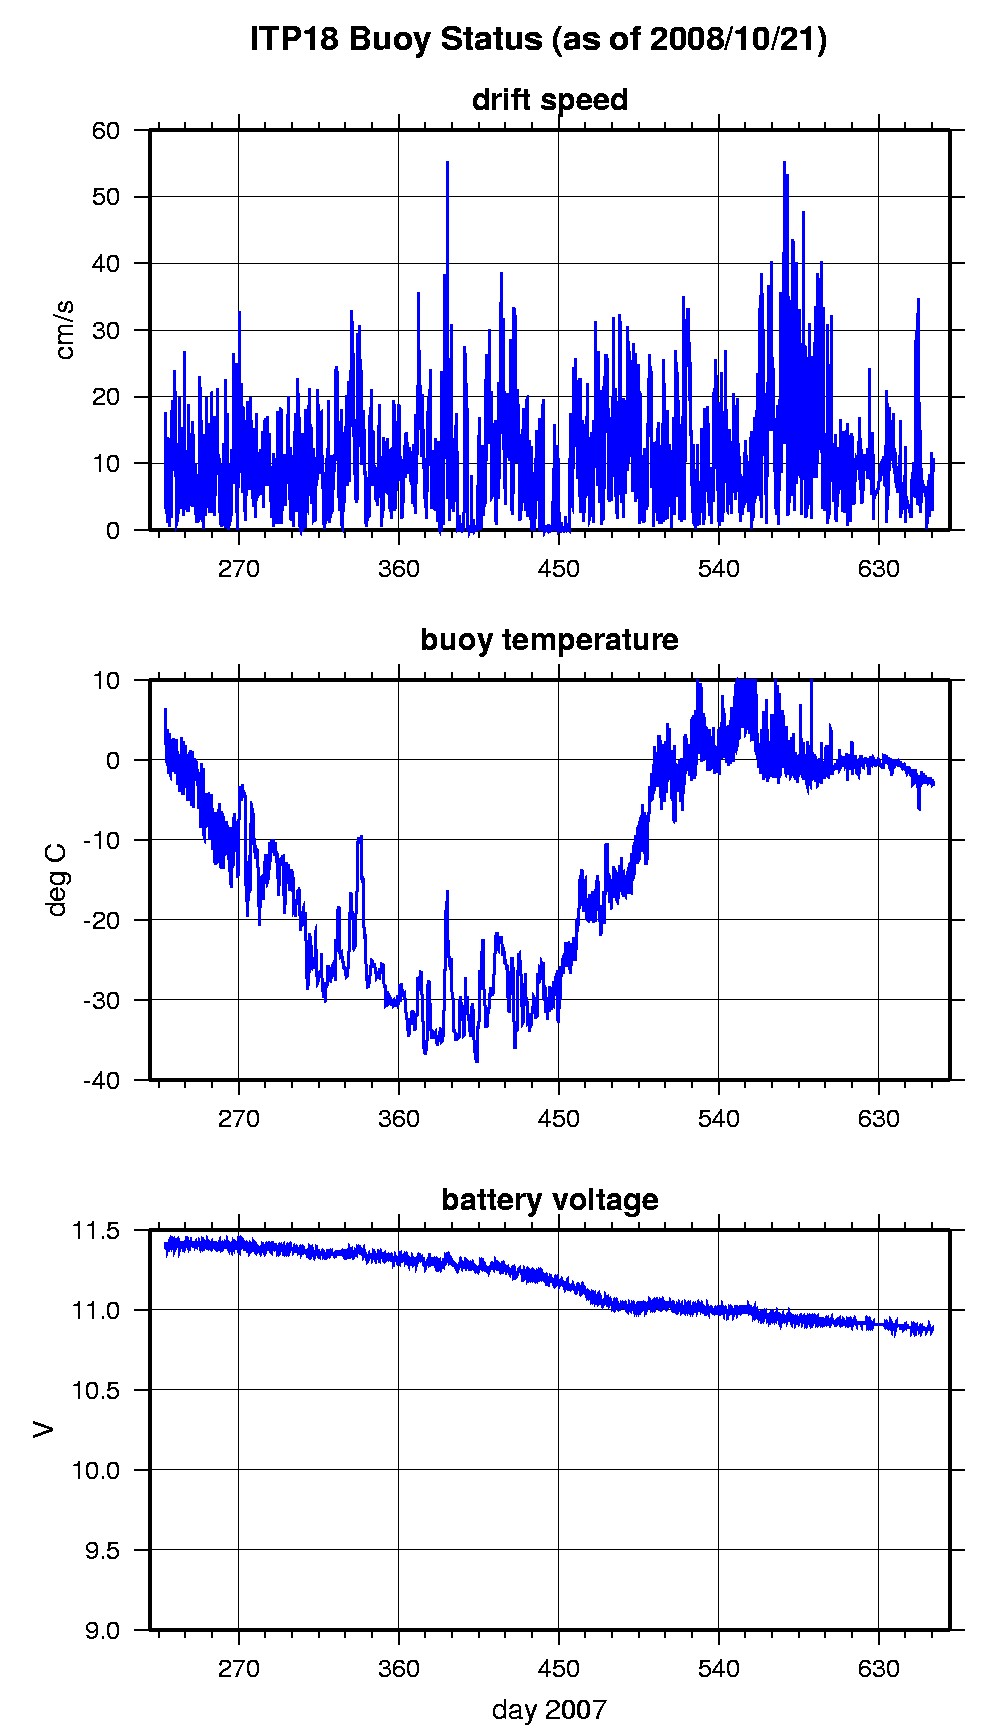
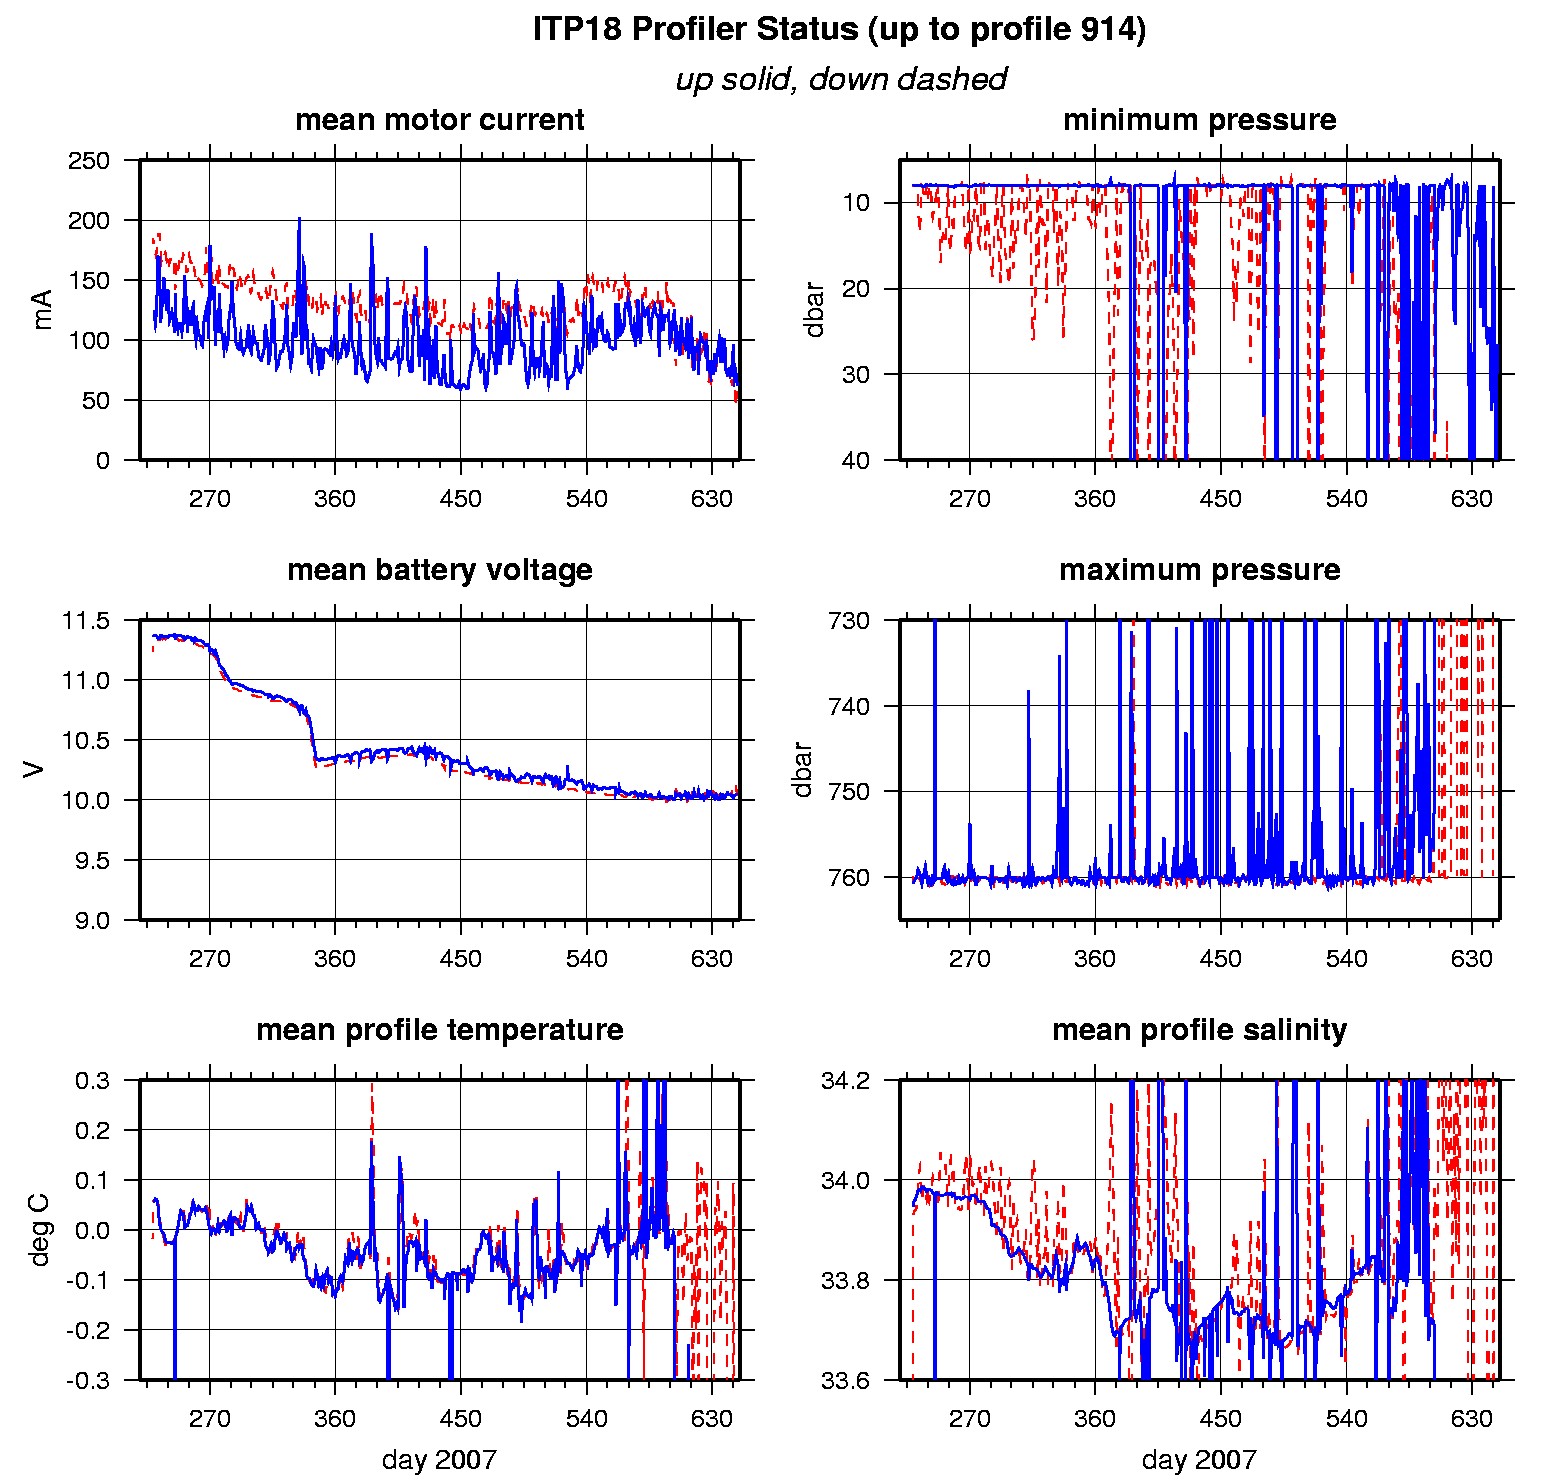
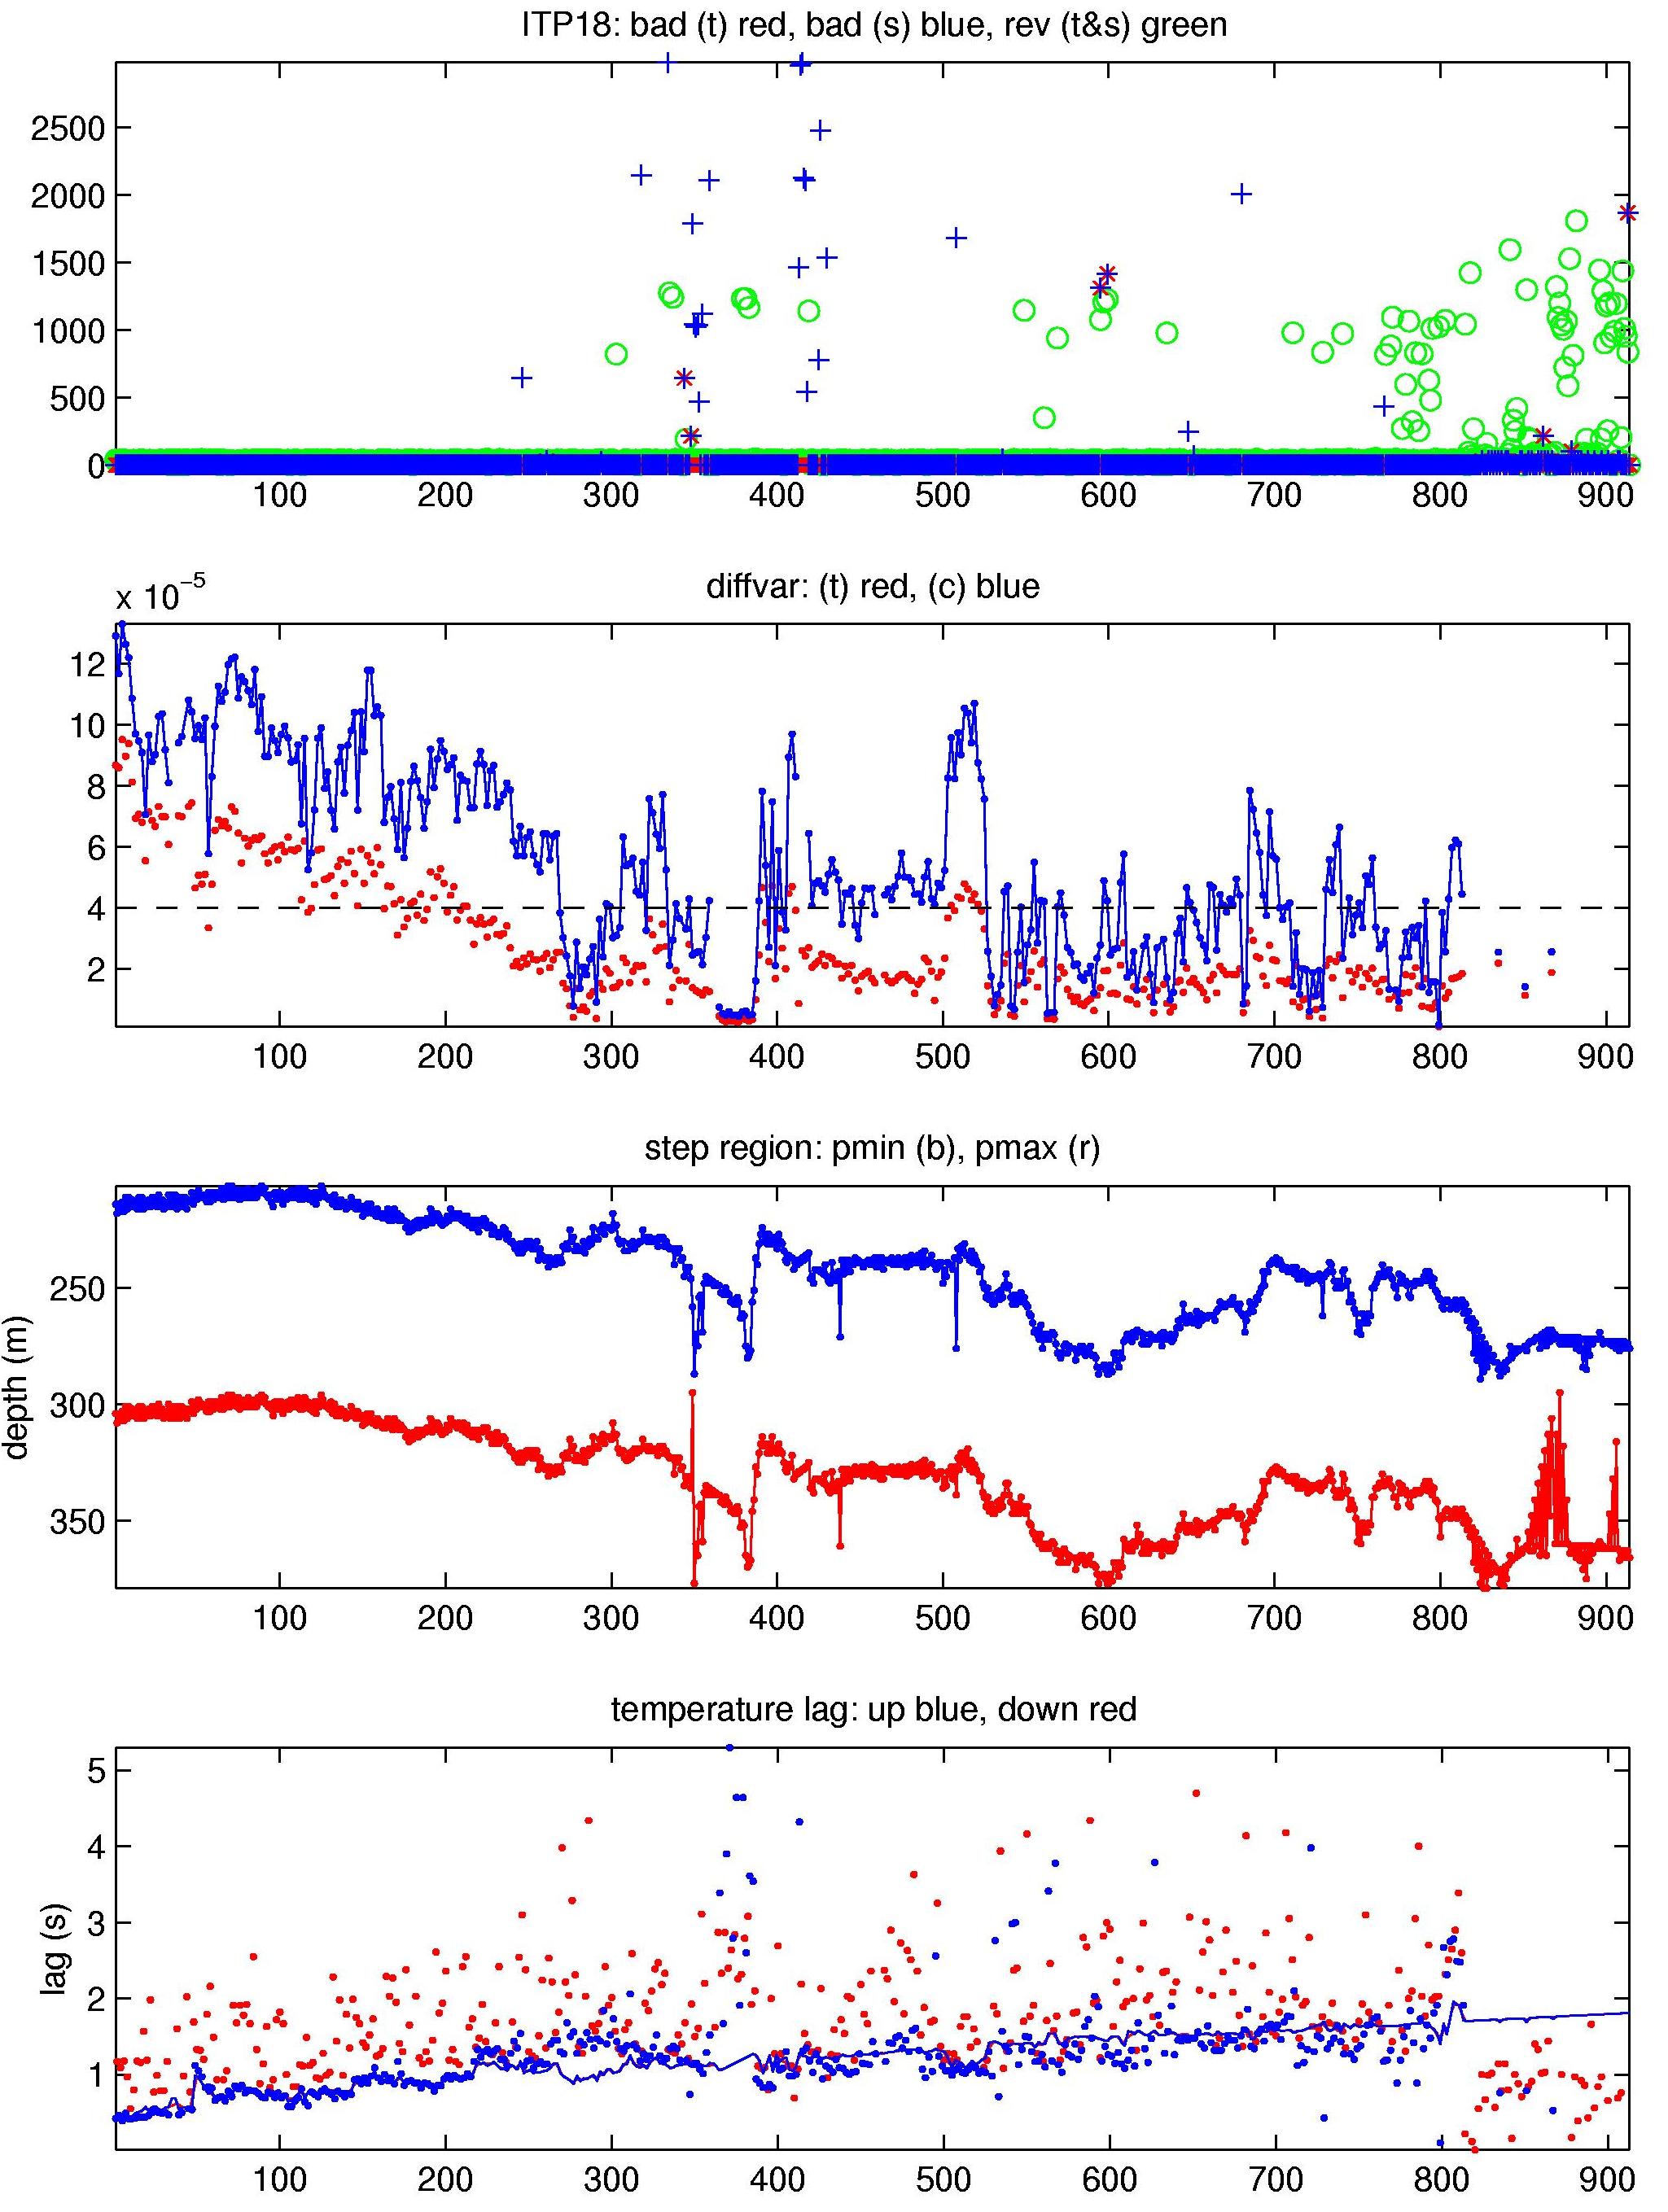
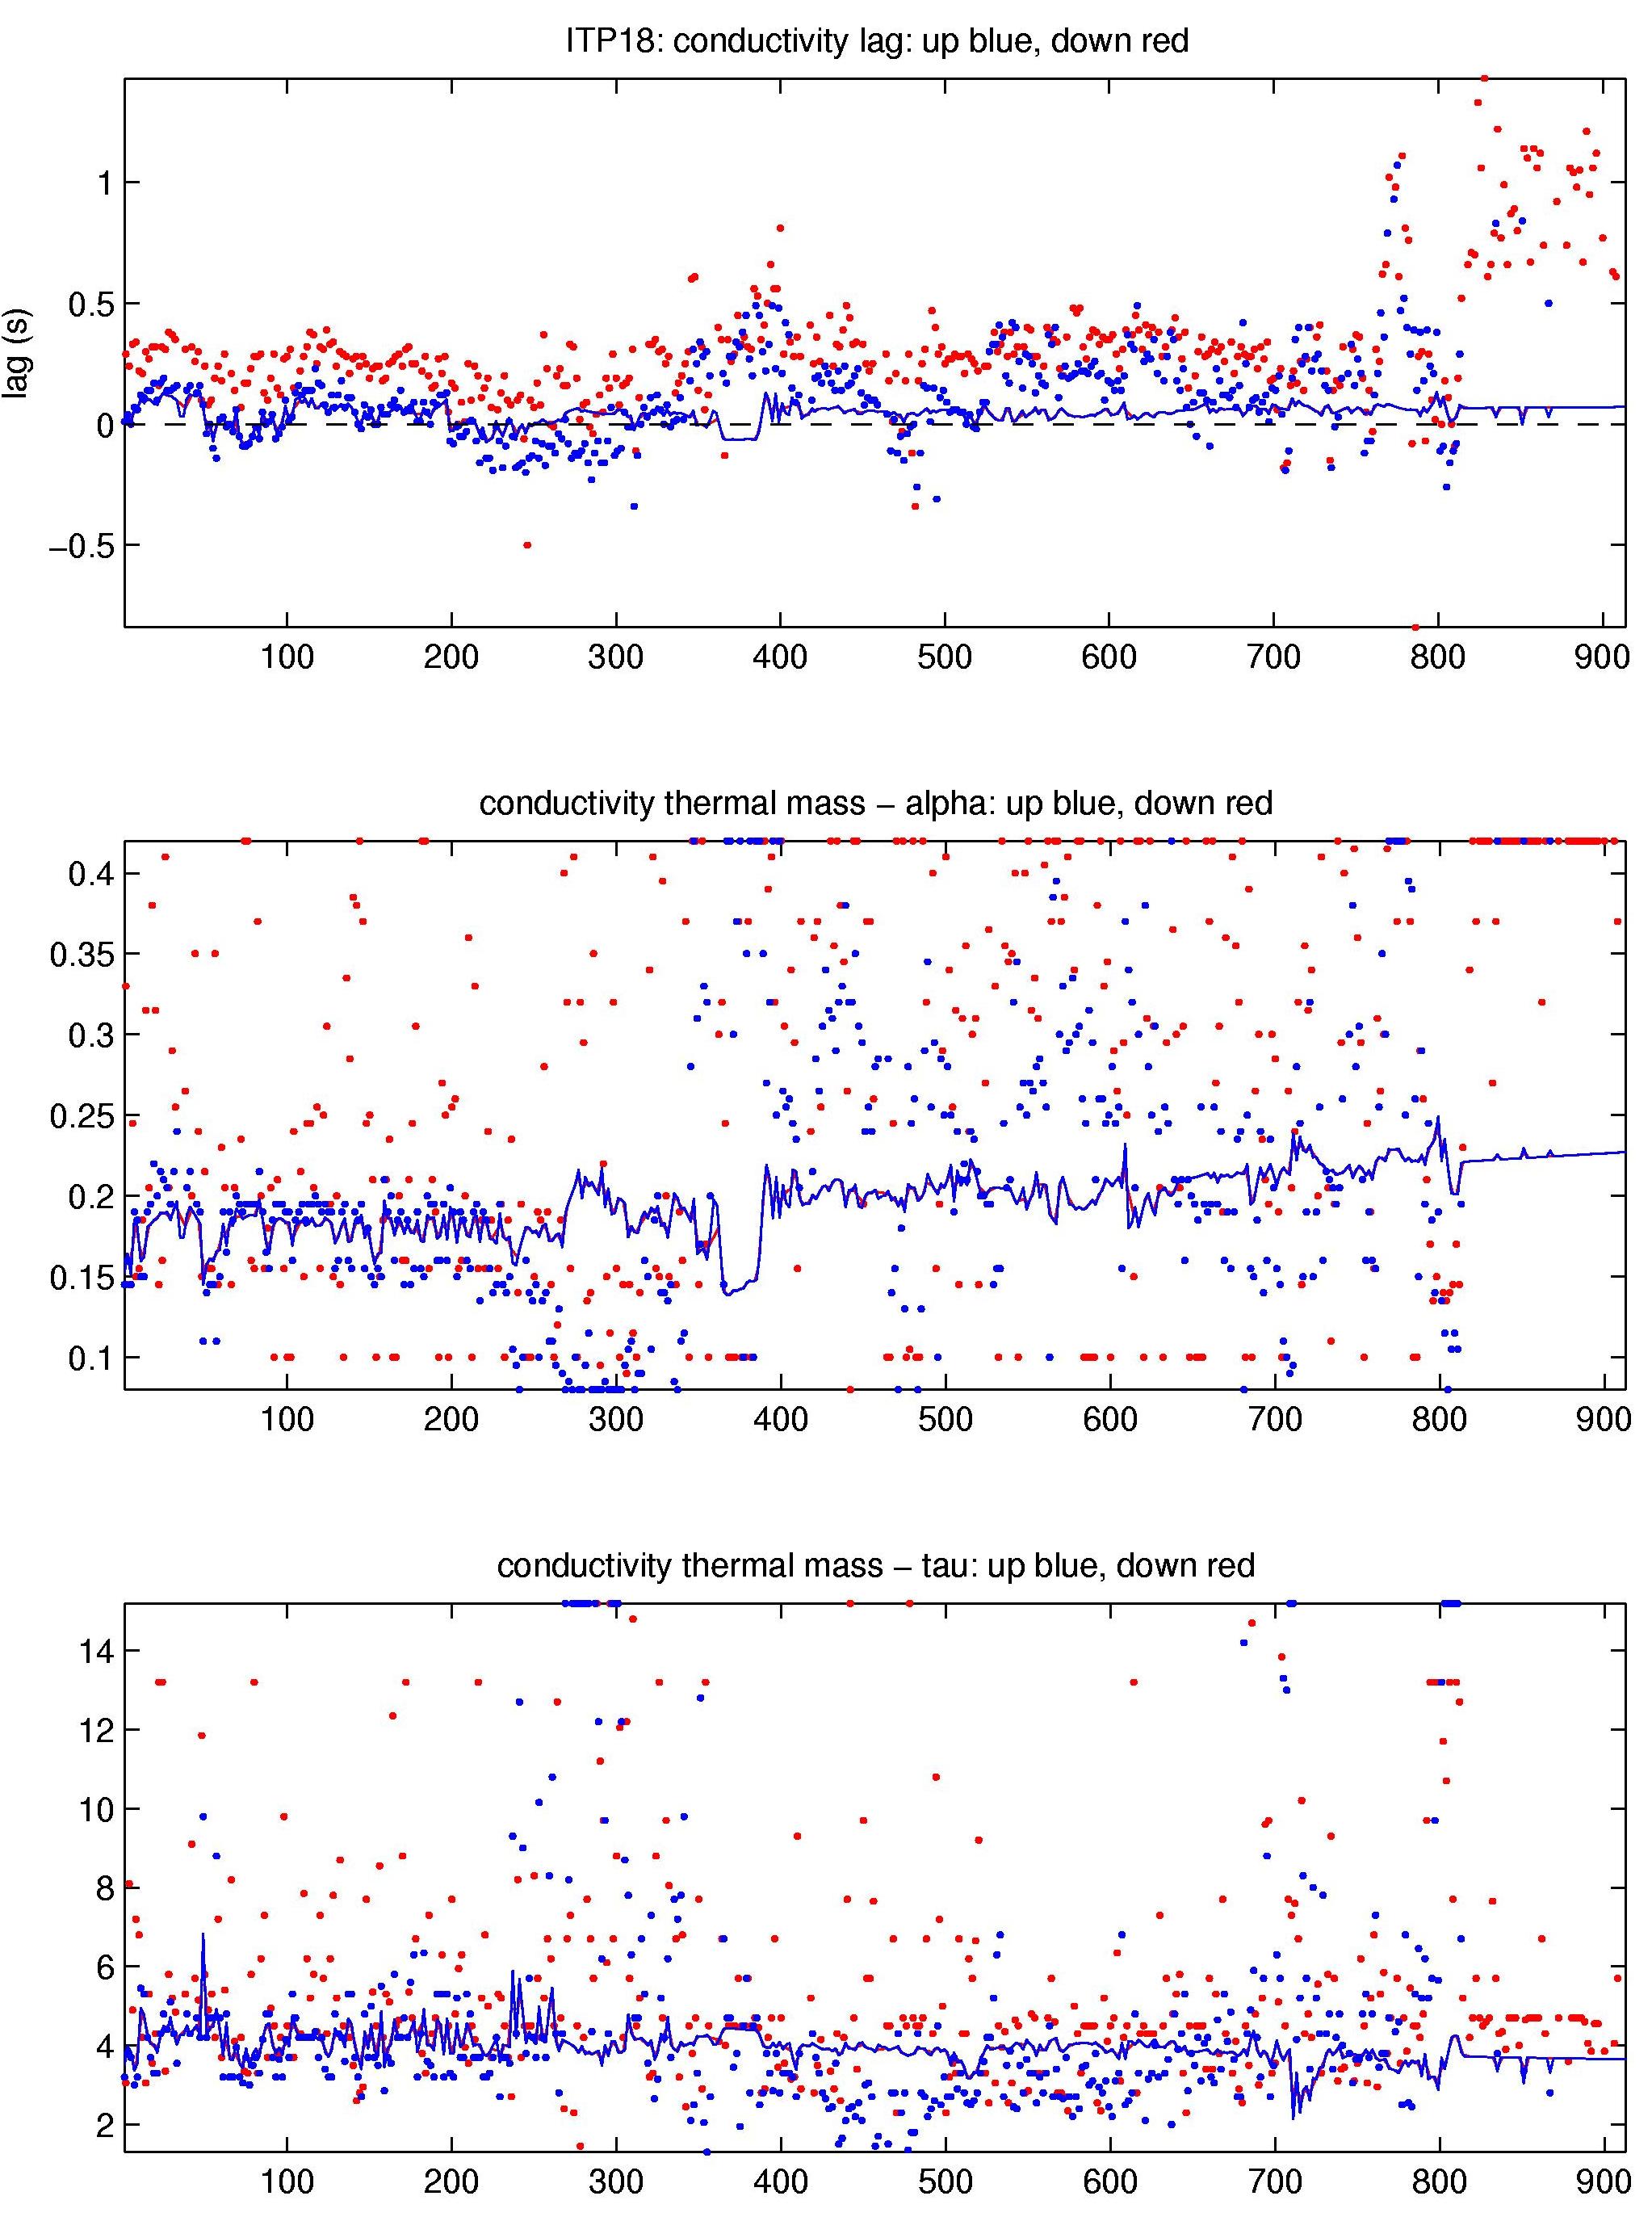
The 912 profiles that were recovered from the ITP were processed according to the procedures described in the ITP Updated Data Processing Procedures. The processing parameters for ITP 18 are shown in the figures to the right. From profile 815 to the end, the surface package was likely in marginal ice zone conditions or open water, and the vertical motion due to surface waves caused the profiler to settle at its neutrally buoyant depth between profiles, and produce either up or down half-profiles. Ice motion was not too great, as to prevent profiling due to drag. Forty-five profiles were interrupted due to the profiler software reset error. Some staircases were present frequently throughout the time series so sensor lags could be estimated. The CTD lags were in the typical range as previous systems and displayed only small amounts of drift over the year, while icing or bio-fouling instances were rare.
See the Data Products tab to the left for descriptions of the three levels (I, II, III) of data processing and to access all data.


