ITP59 Data Description
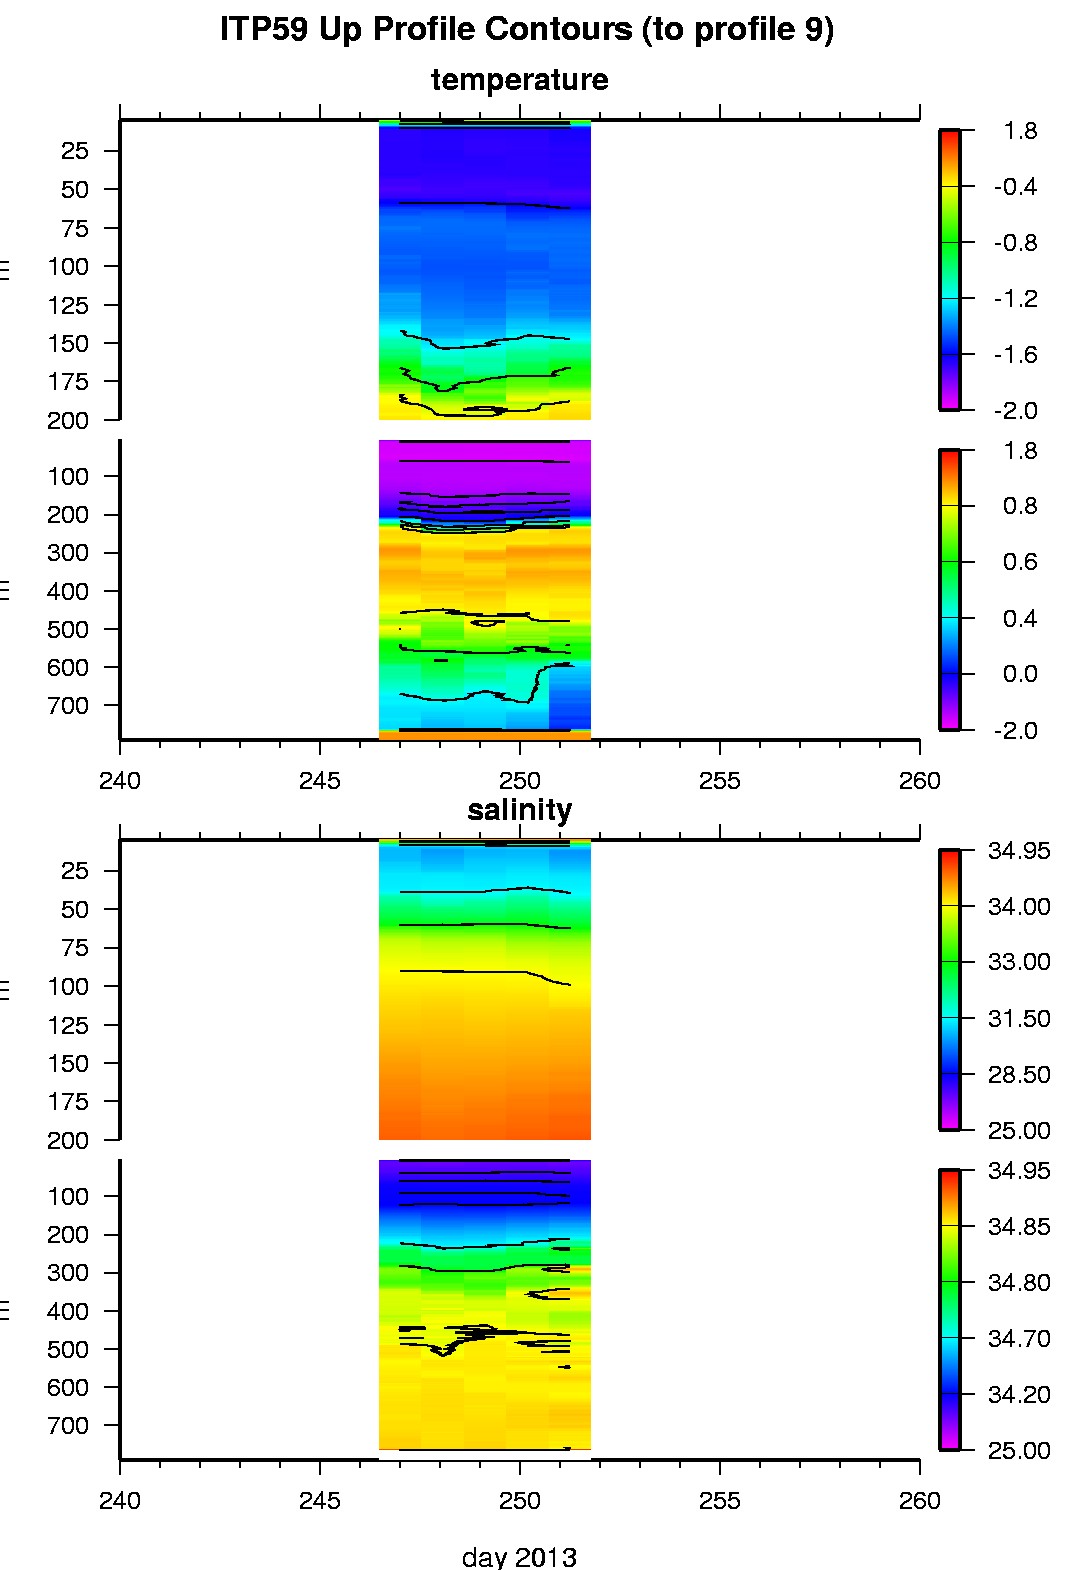
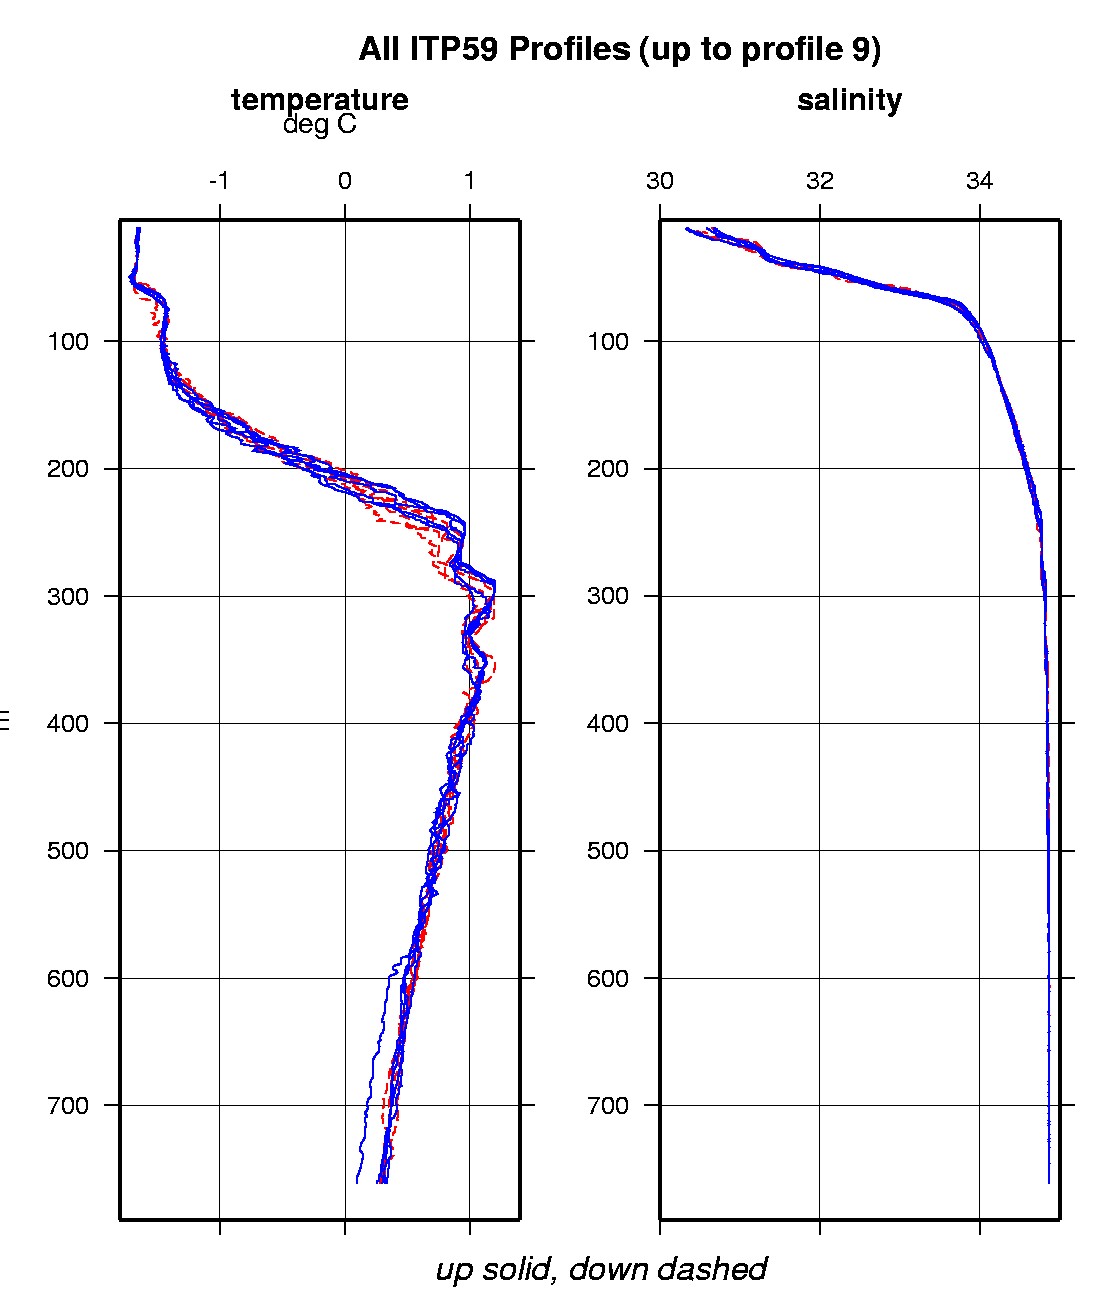
The ITP profiler was configured to operate on a standard sampling schedule of 2 one-way profiles between 7 and 750 m depth each day. In the surface package, the GPS receiver was powered hourly to obtain locations hourly, and buoy temperature and battery voltage status were recorded.
For unknown reasons, the profiler could not communicate with the surface package only 5 days after deployment. The surface package did not receive any wakeup tones from the profiler between September 8 and November 8, 2013 when one more engineering file from the profiler (profile 10) was received indicating that the profiler was still intact at that time. No ring tones from the profiler were received thereafter.
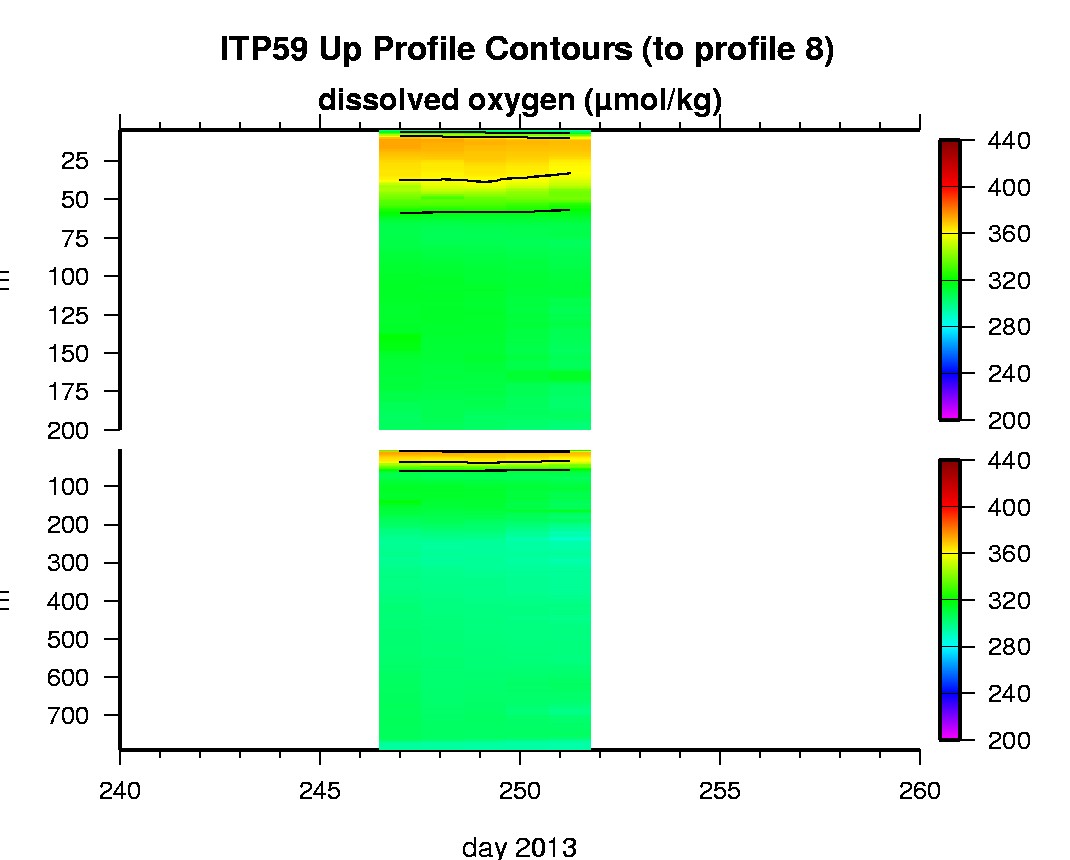
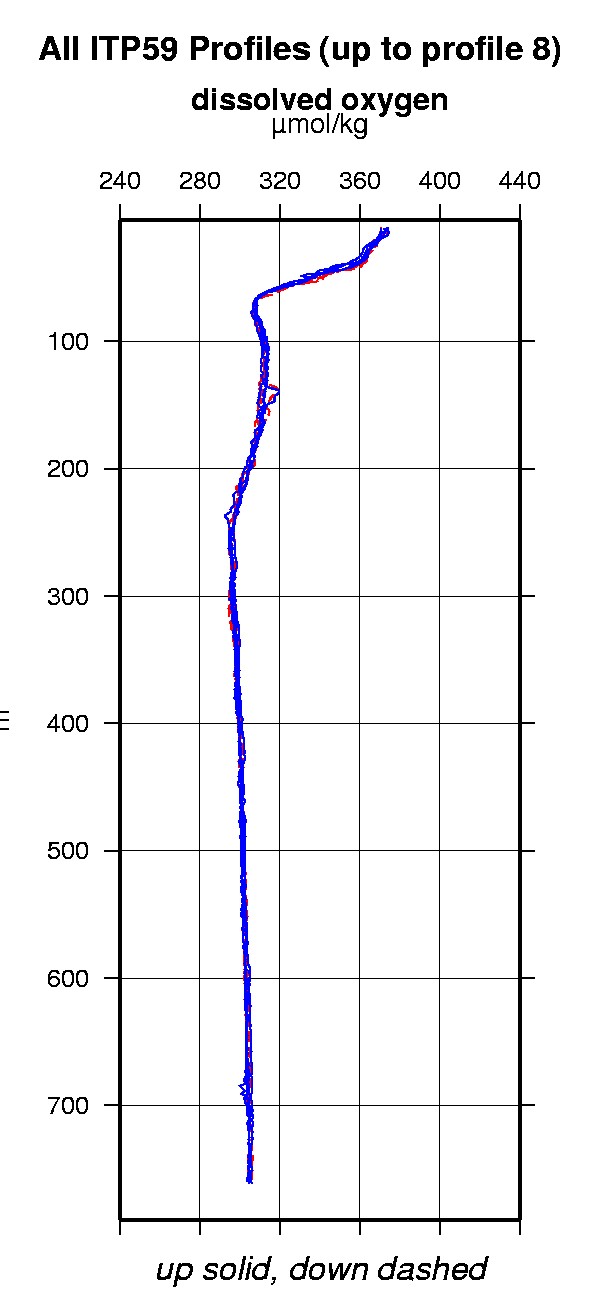
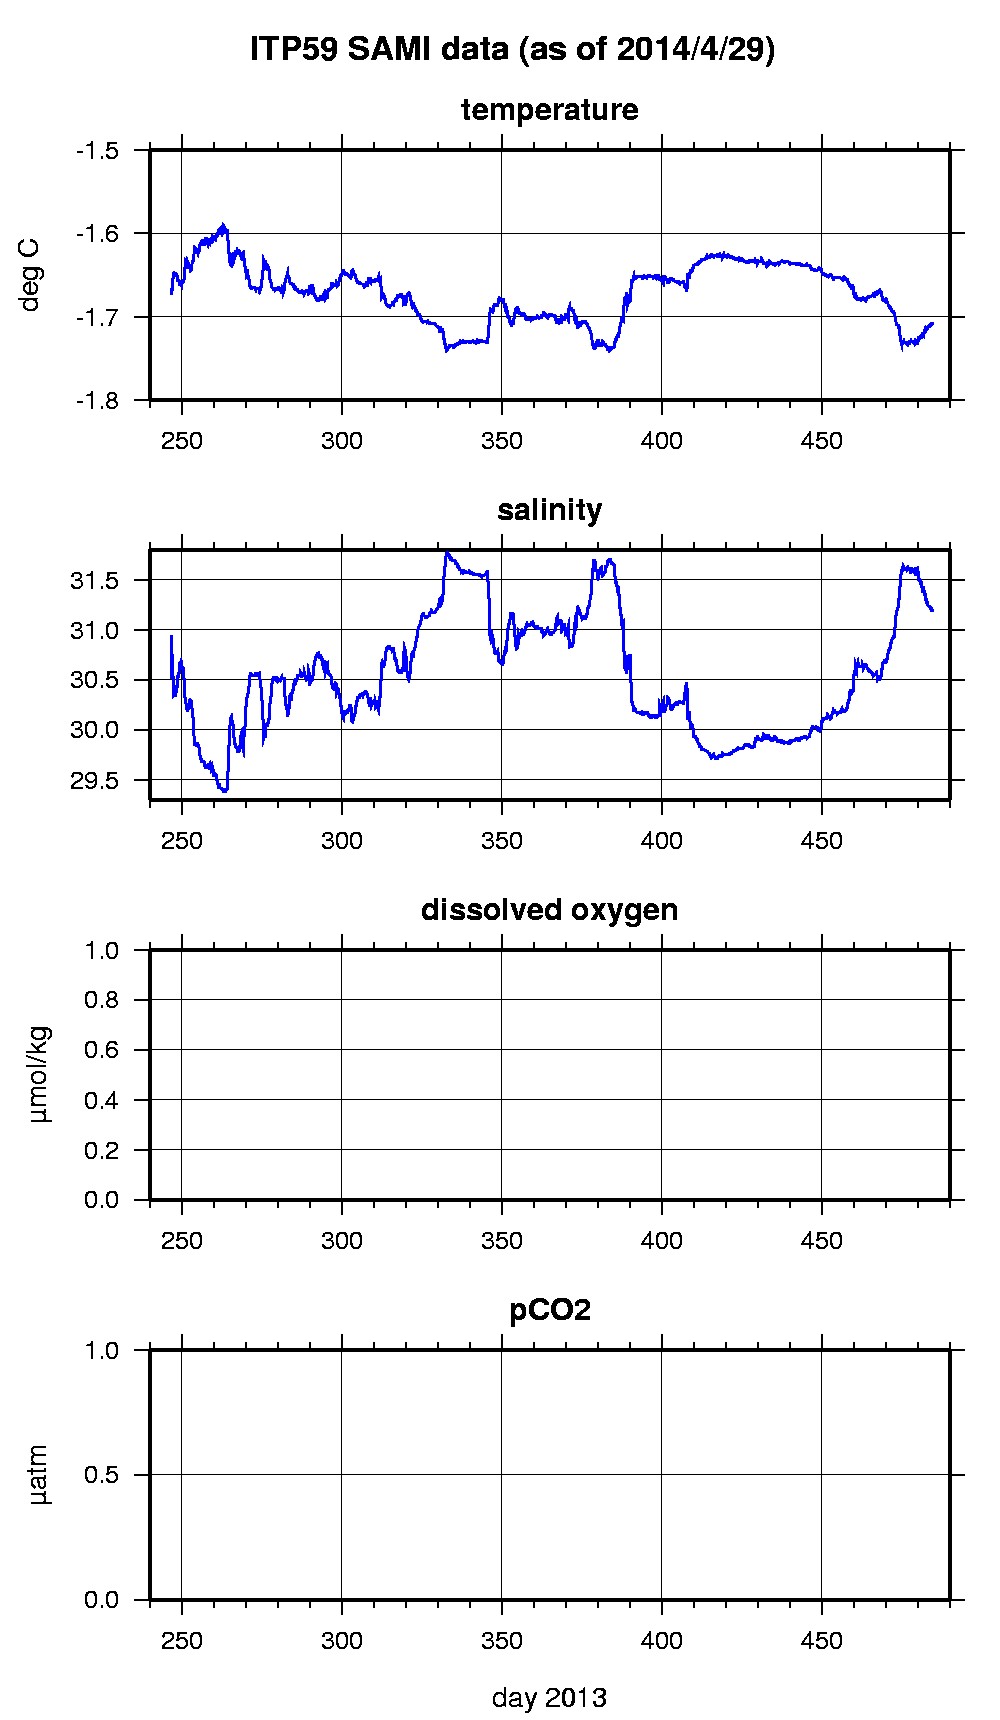
However, the surface package was able to successfully communicate with the SAMI pCO2 and SBE-37 microcat fixed on the ITP tether at 6 m depth for over 238 days until April 29, 2014 when communications between the instruments and their inductive modem ceased. The microcat provided a complete time series of temperature and salinity in the mixed layer every 2 hours during this period, but unfortunately the dissolved oxygen and SAMI pCO2 sensors did not produce good data.
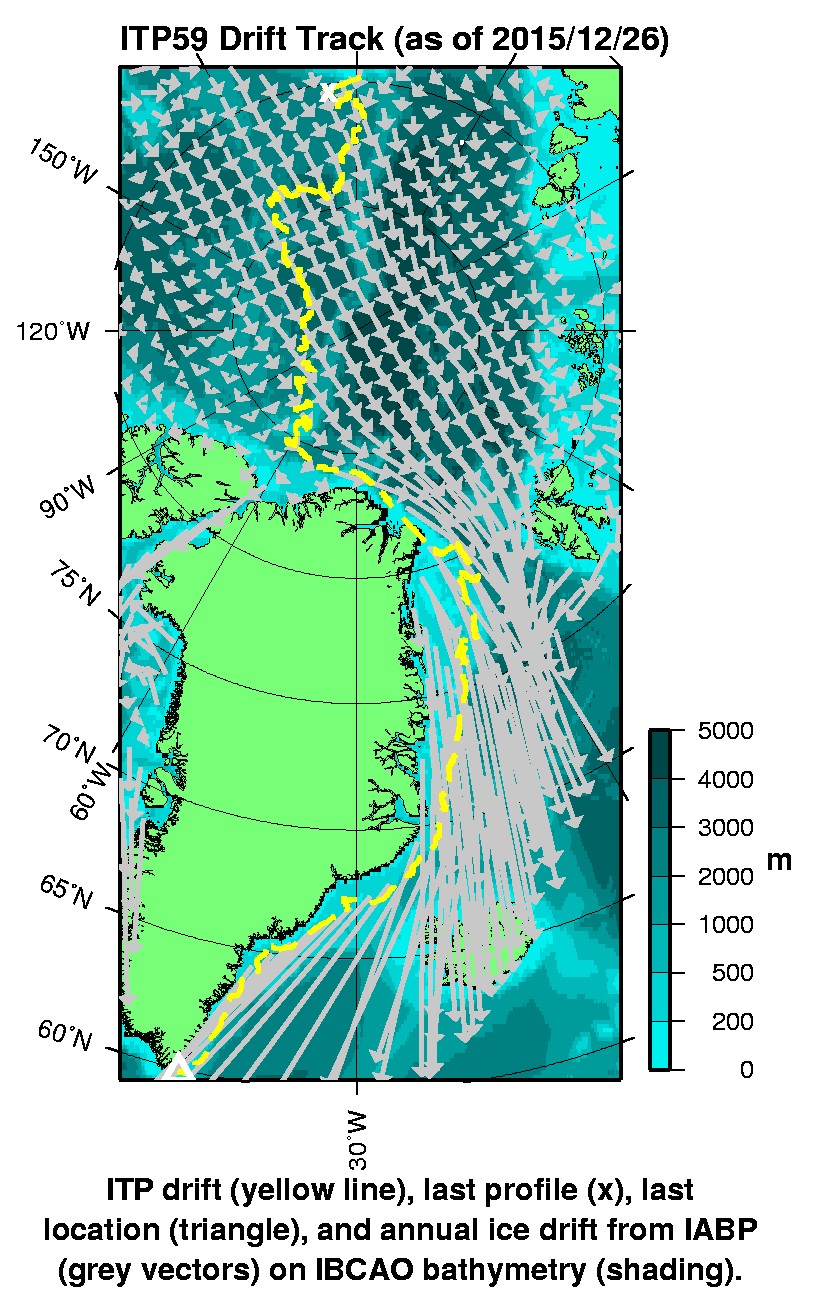
The Transpolar Drift current took the buoy across the Arctic Ocean generally along the western side of the Lomonosov Ridge, then southward along the north coast and east coasts of Greenland. The last communications from the surface package 844 days after deployment were near Cape Farewell, Greenland.
The plots to the right are of the final, calibrated, edited data (as opposed to the raw data presented on the active instrument pages).
See the Data Products tab to the left for descriptions of the three levels (I, II, III) of data processing and to access all data.
ITP 59 data can also be found at the links below:
Level II hourly buoy location data in ASCII format: itp59rawlocs.dat
Level III 1-Hz processed profile and SAMI Microcat data in MATLAB format: itp59cormat.tar.Z and itp59cormat.zip
Level III 1-db bin-averaged processed profile and SAMI Microcat data in MATLAB format: itp59final.mat
Level III 1-db bin-averaged processed profile and SAMI Microcat data in ASCII format: itp59final.tar.Z and itp59final.zip
