ITP 11 Data Processing
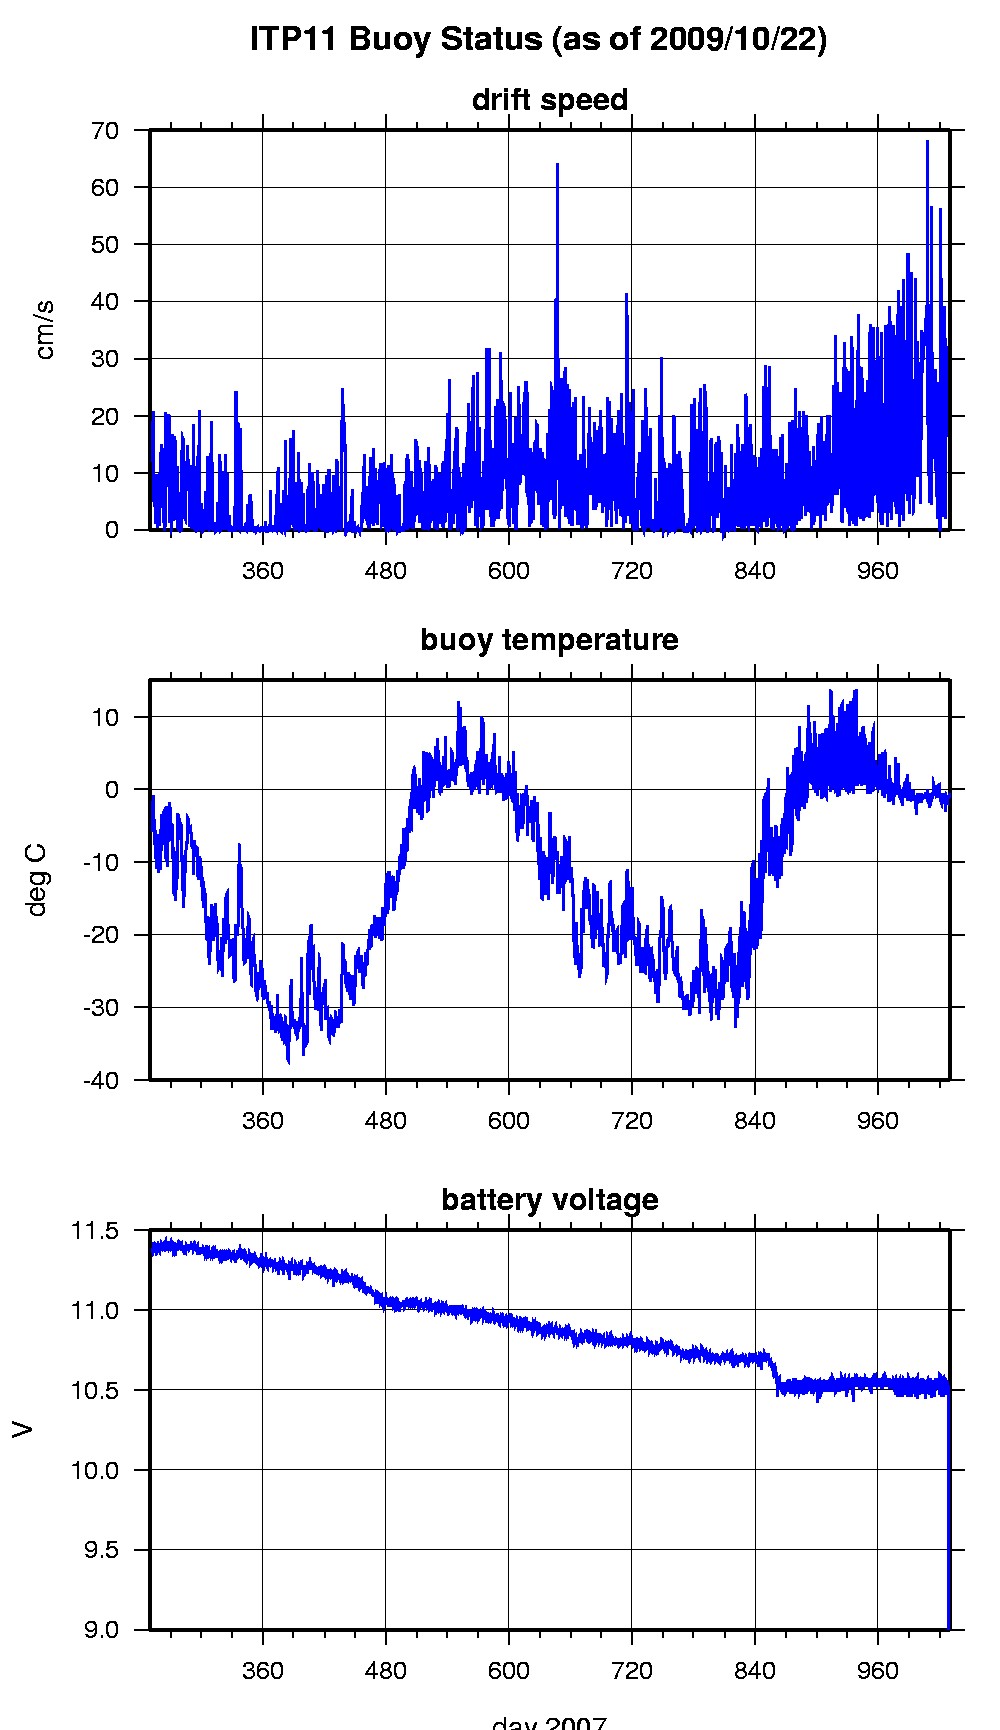
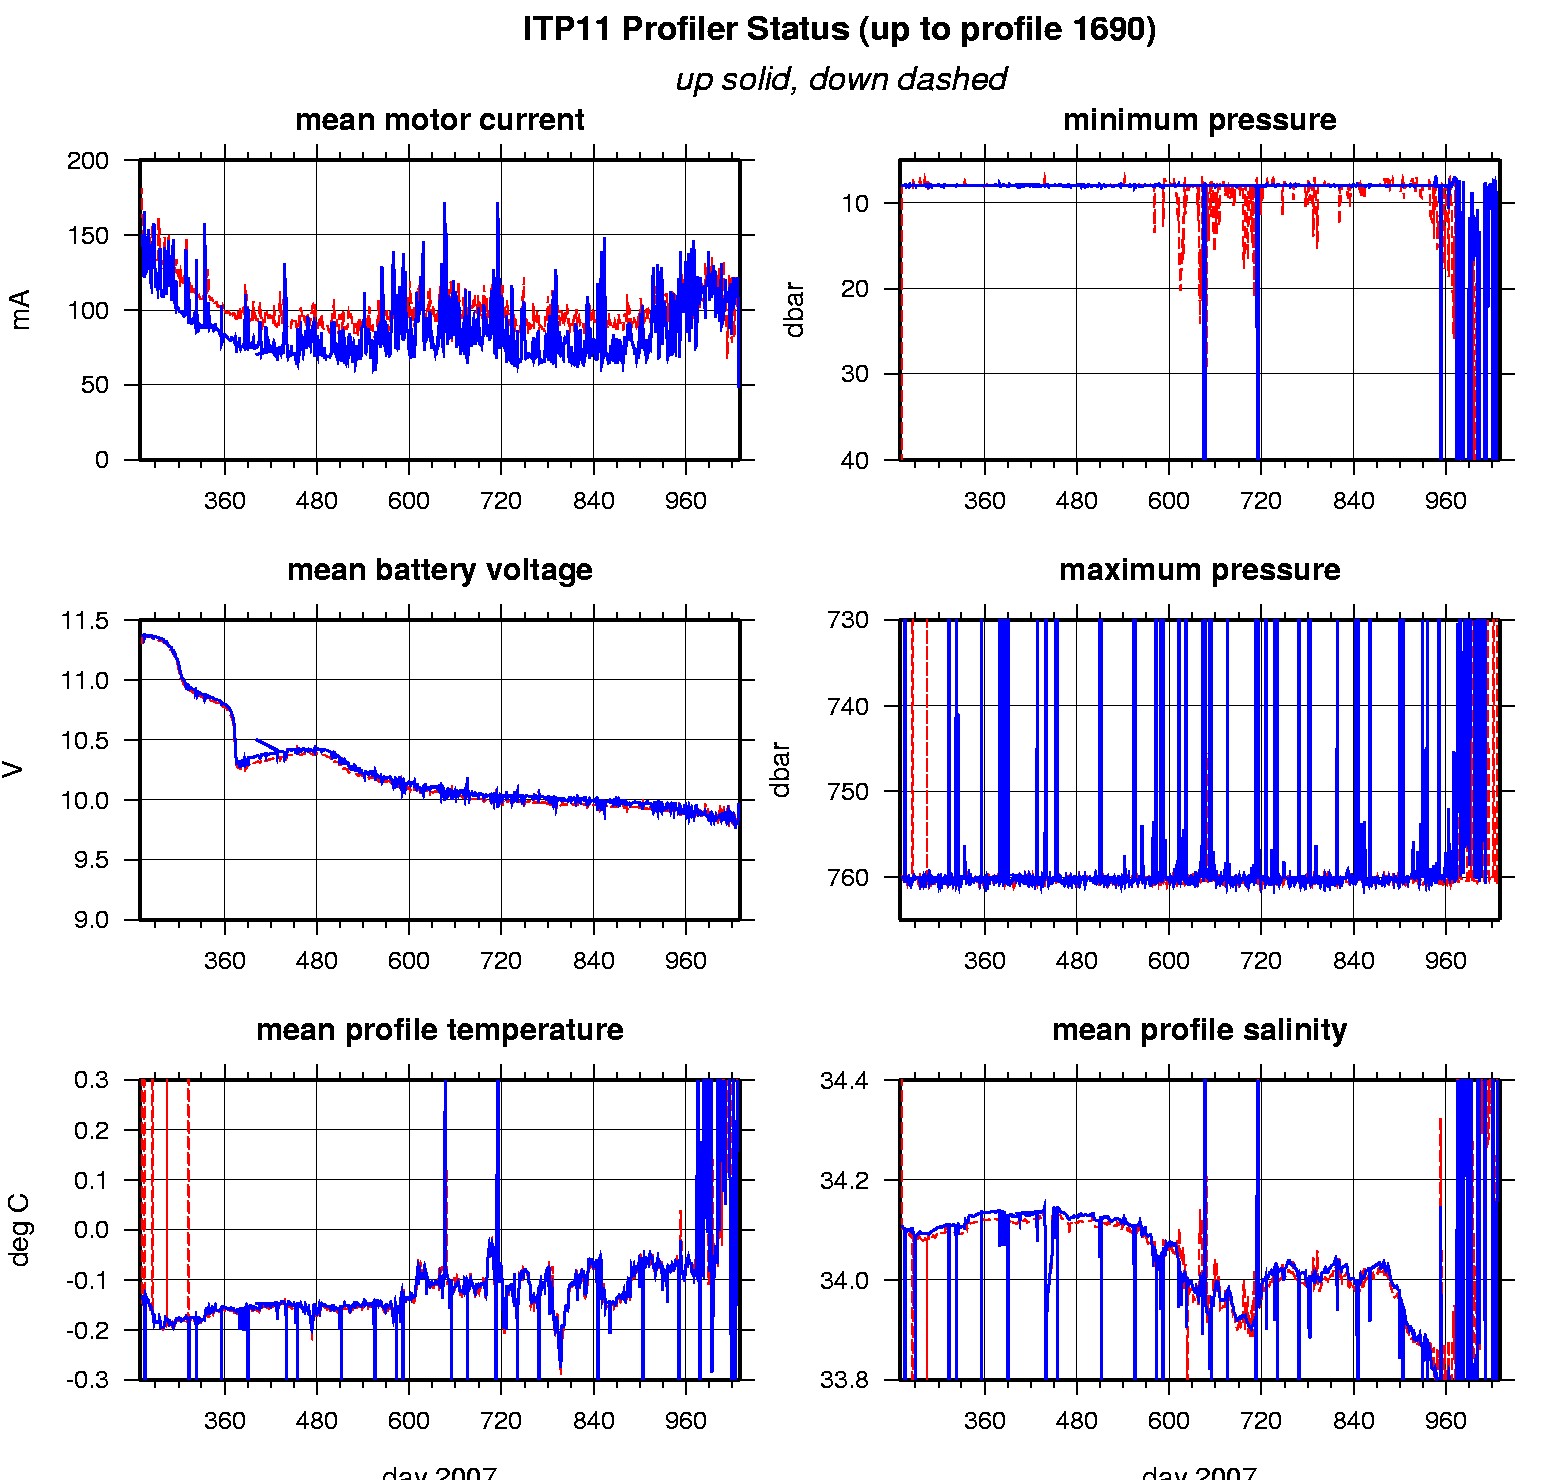
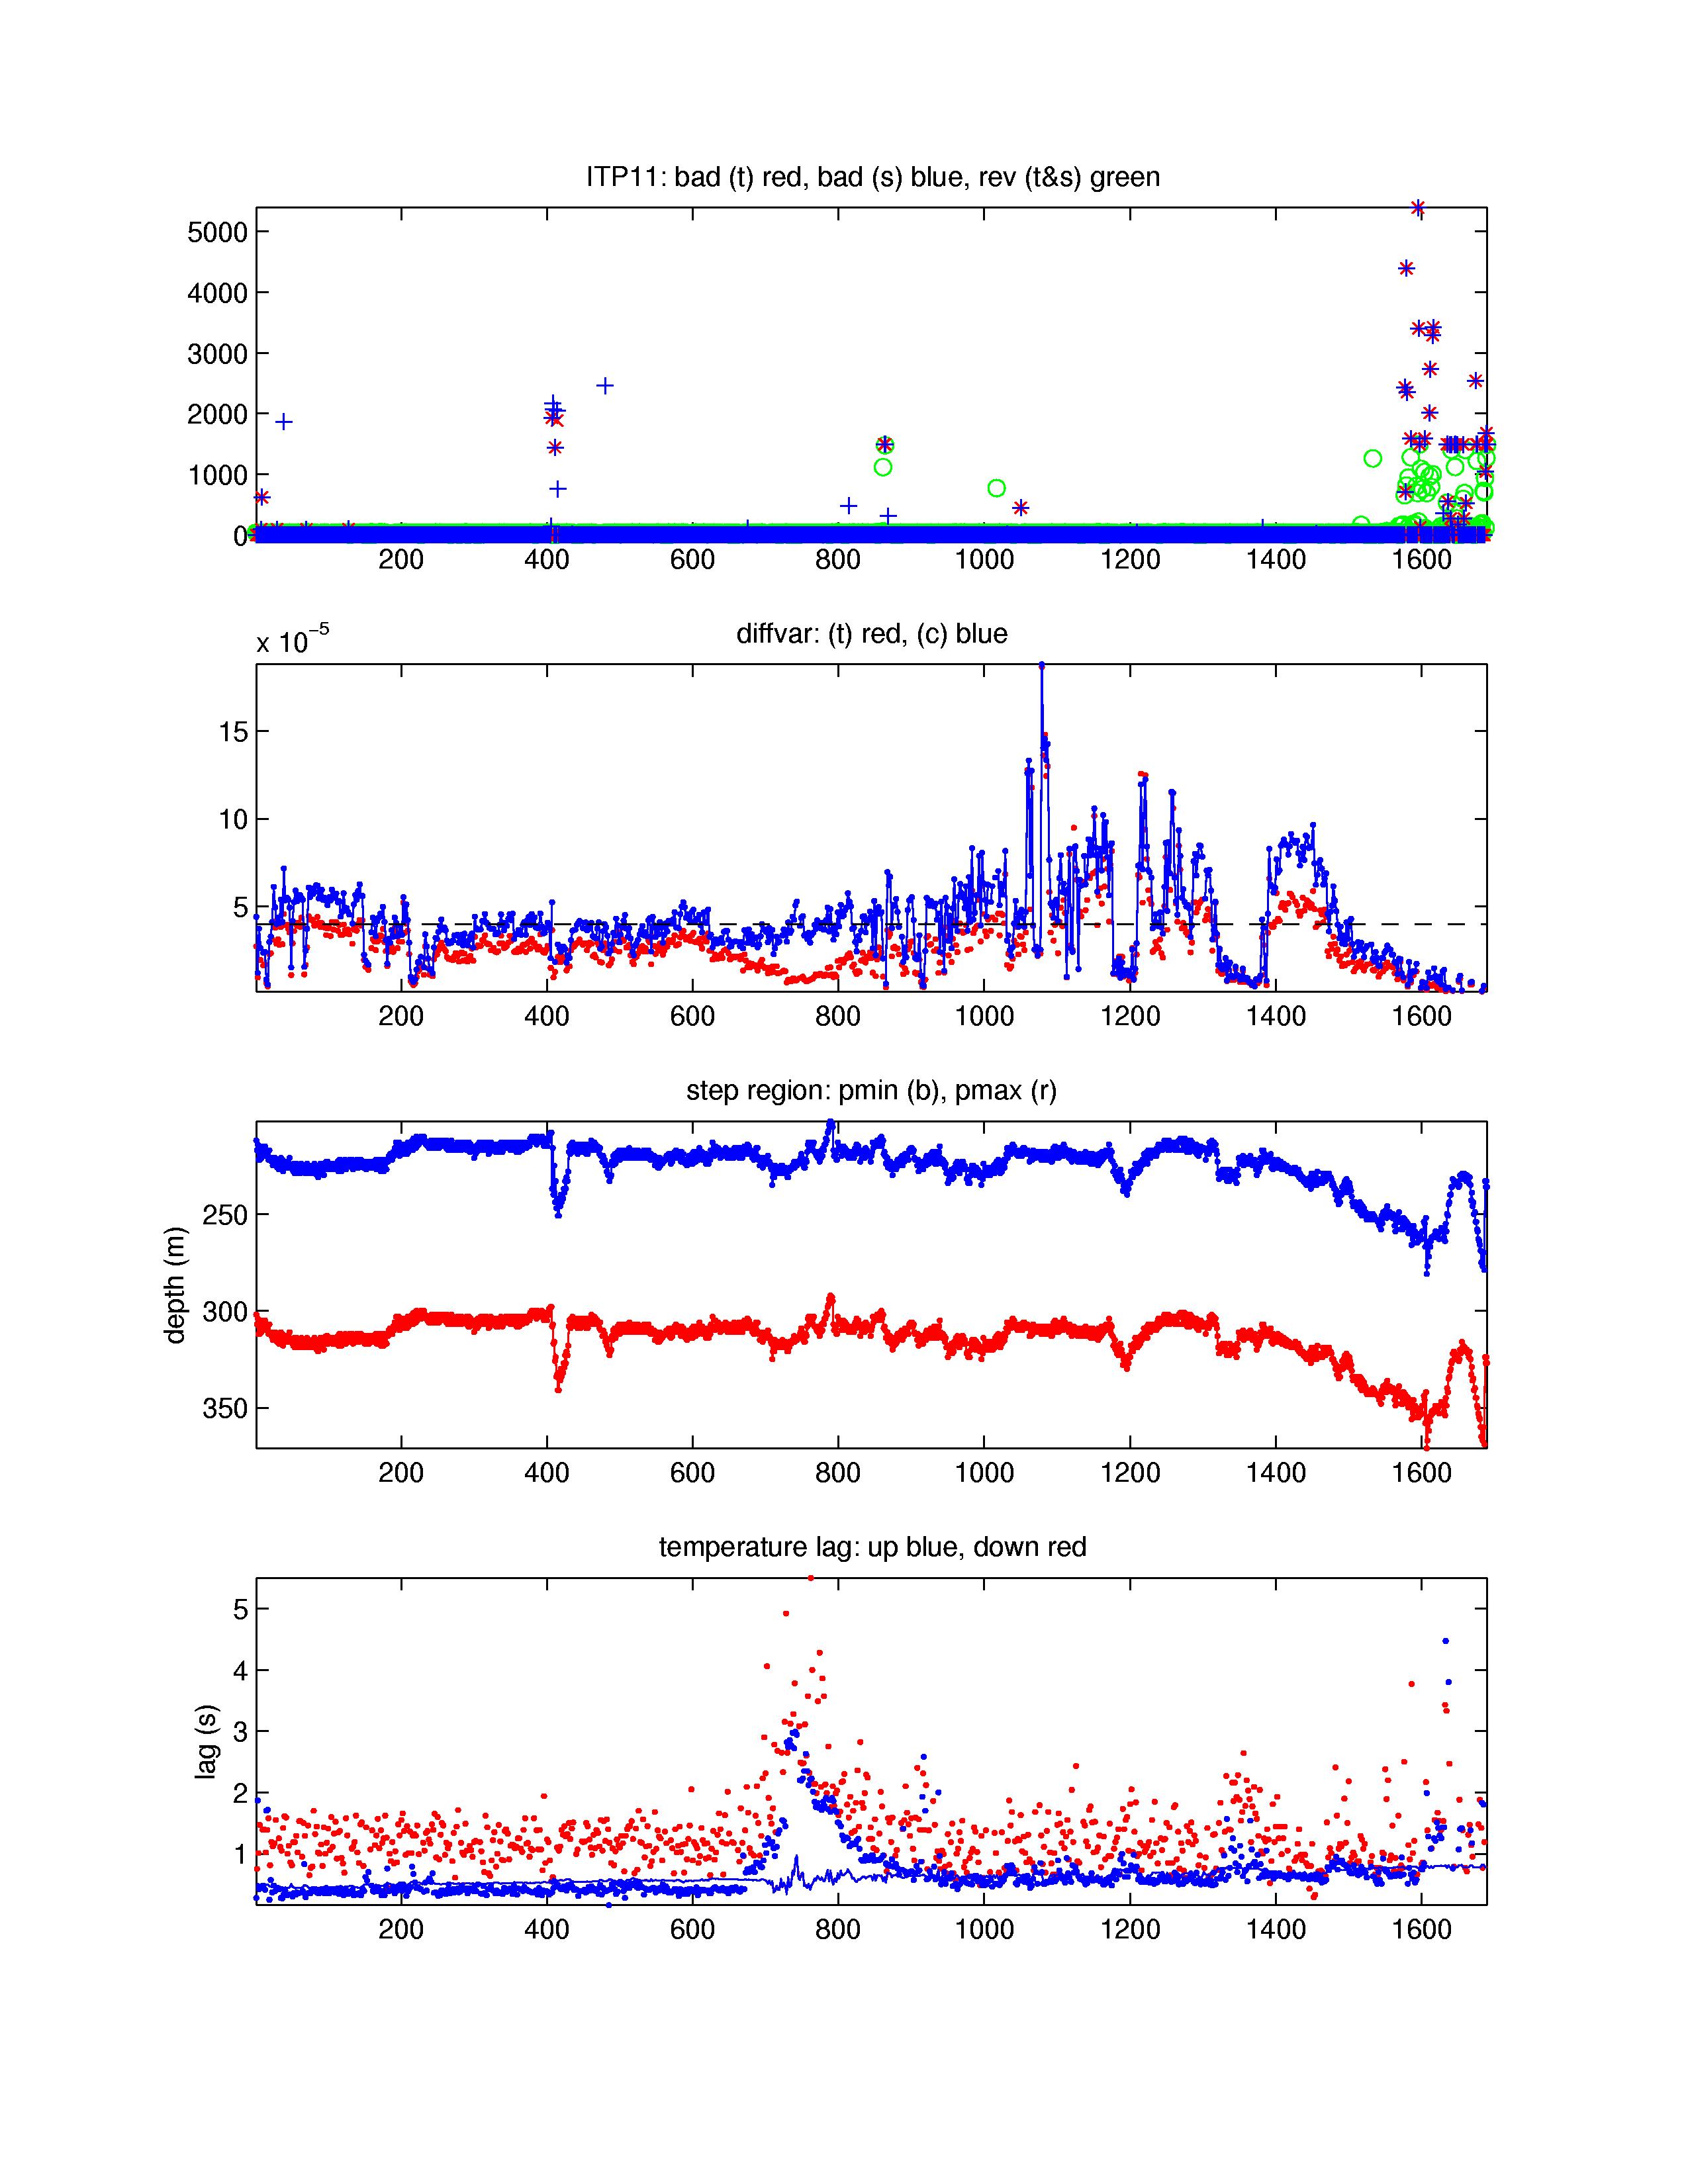
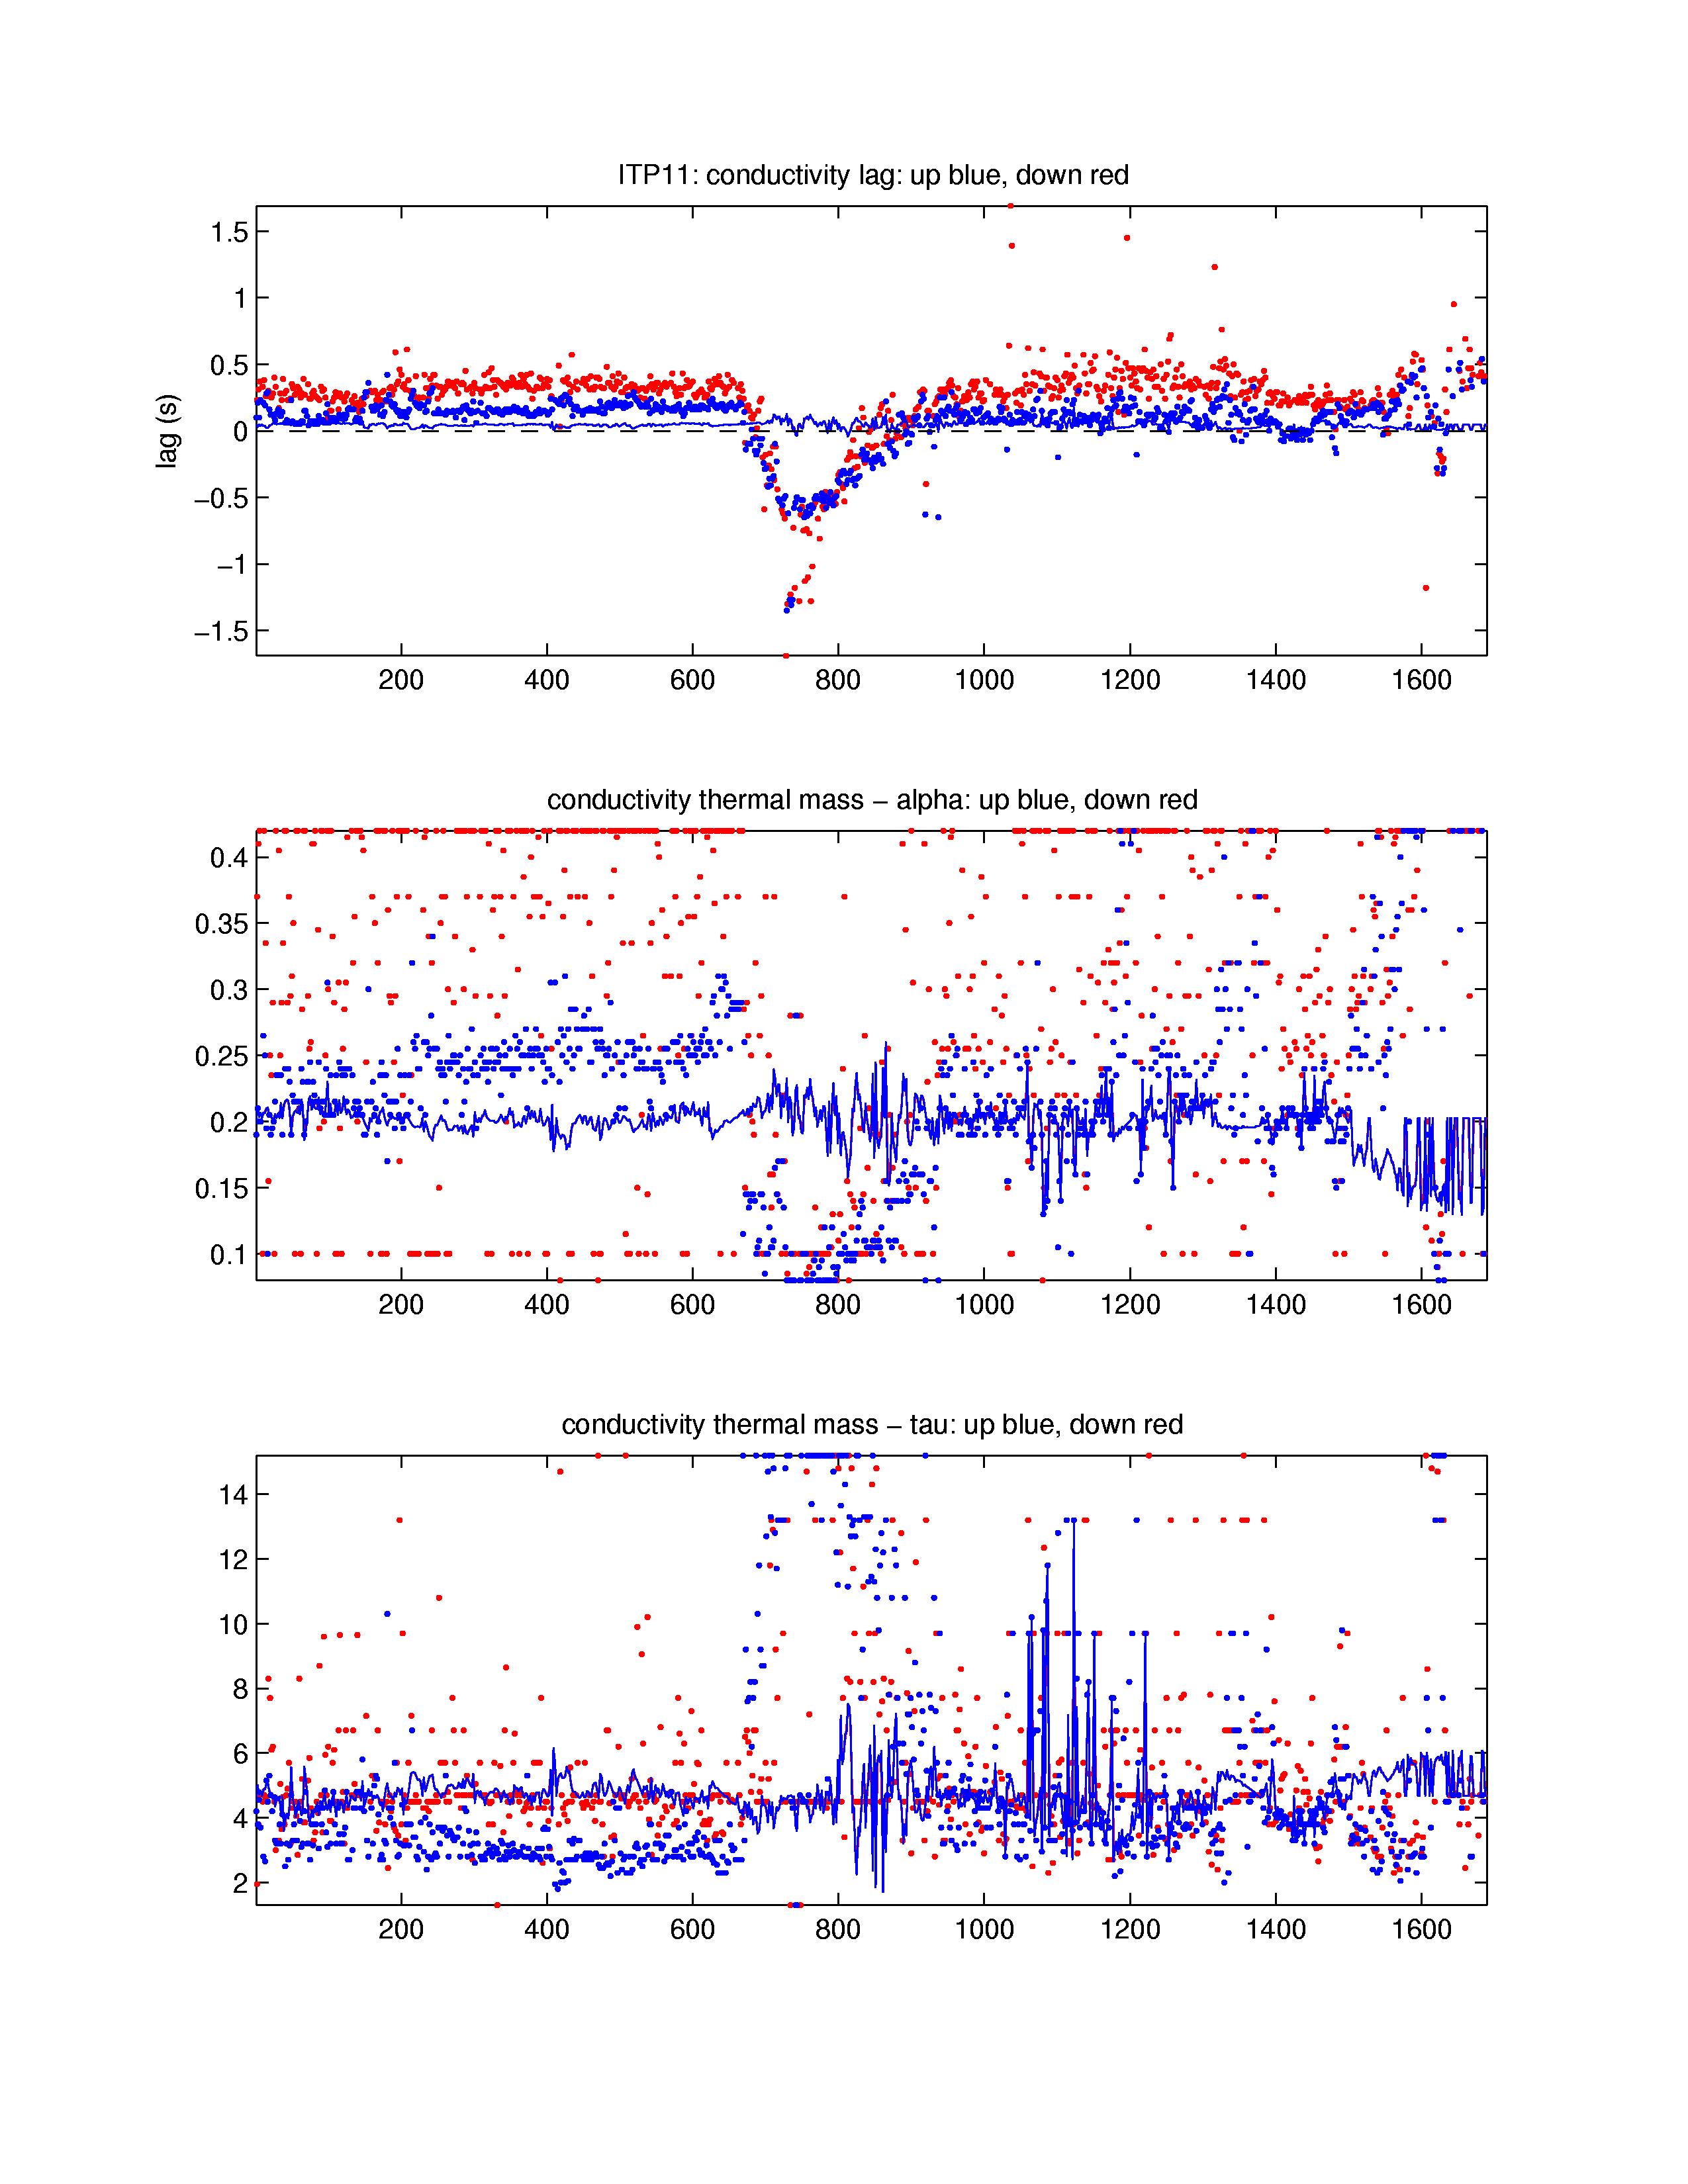
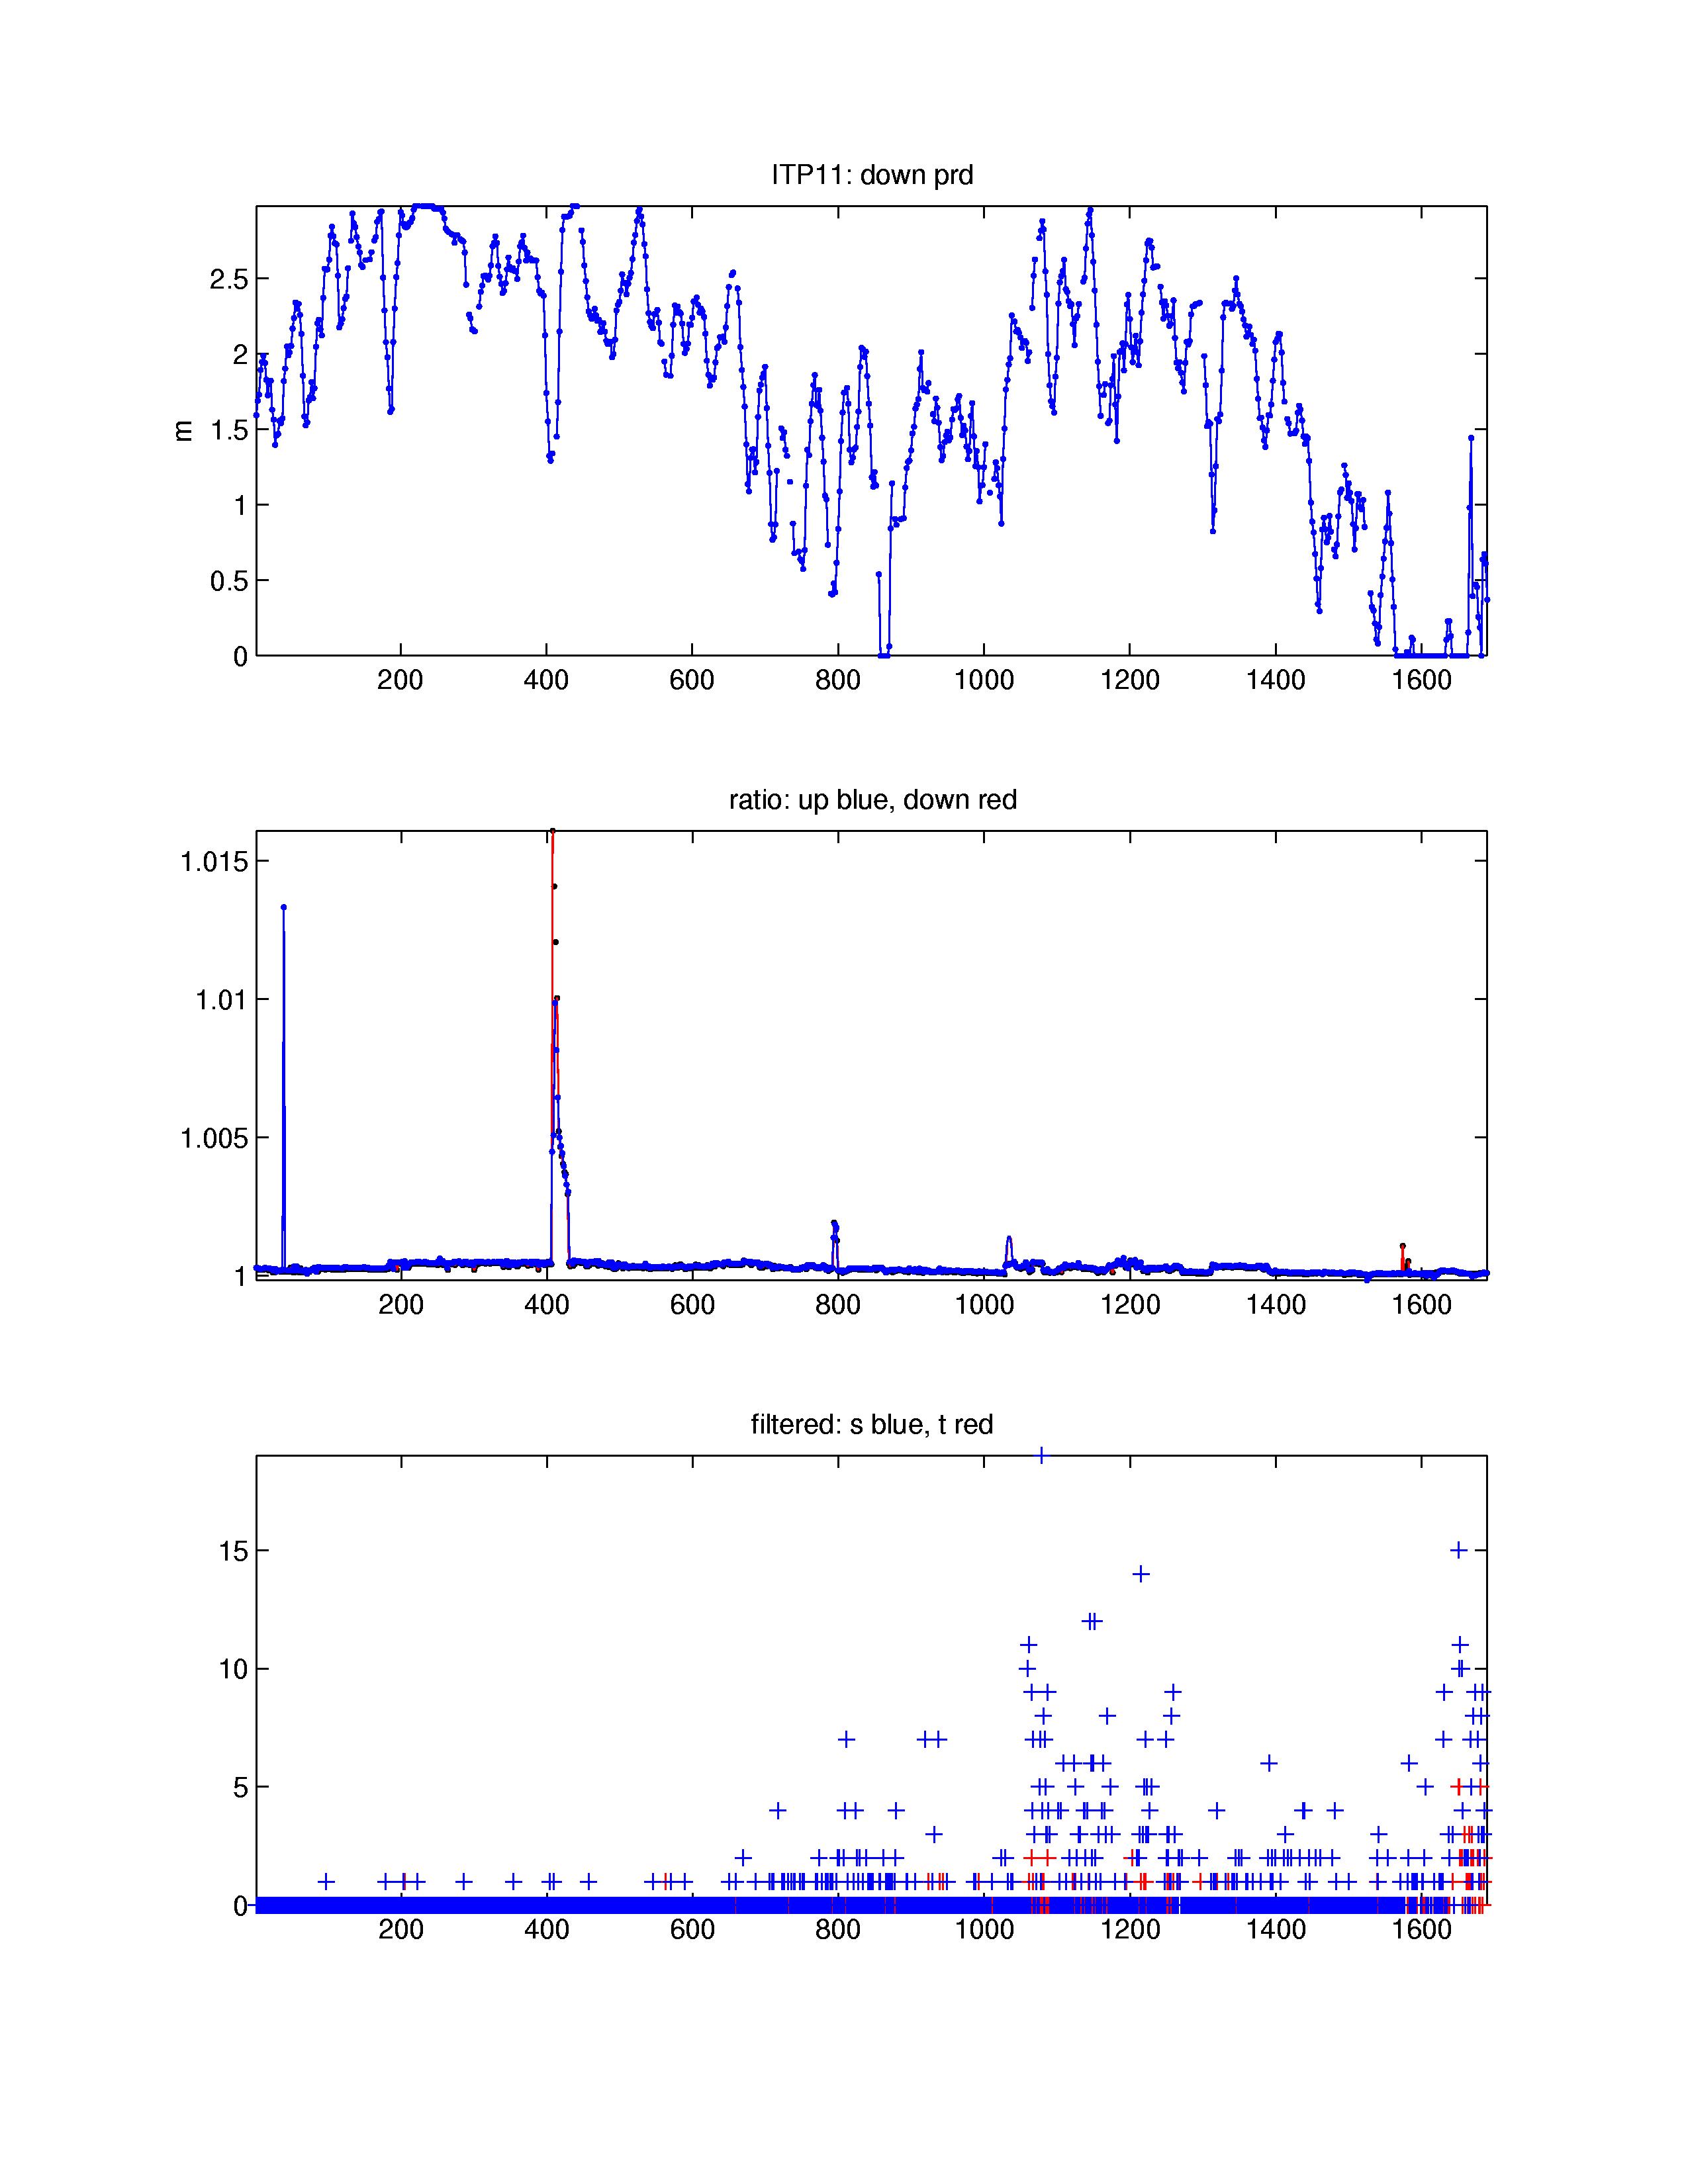
The 1690 profile attempts that were transmitted from the ITP were processed according to the procedures described in the ITP Data Processing Procedures. The processing parameters (described in ITP Data Processing Procedures) for ITP 11 are shown in the figures to the right. Thermohaline staircases were not prominent in the time series, but sufficient to sometimes compute lags which did not seem to vary (where steps were present) throughout. A step shift in conductivity occurred between profiles 407-429. Numerous profiles between 1060 and 1270 have odd T-S shapes above and through the Atlantic Water layer, but are stable in density. These profiles have some characteristics that differ from typical fouled sensor data and could portray horizontal seawater intrusions, so were not removed. The mooring likely dragged on the Chukchi shelf between profile 1638 and 1650, and the profiler recovered somewhat afterwards obtaining partial profiles (in higher drift speeds) up to profile 1686, when the battery rapidly exhausted. Due to the software overflow bug, ITP 11 experienced 68 resets with complete loss of data for these profiles, and typically incomplete vertical coverage for the next subsequent profiles.
See the Data Products tab to the left for descriptions of the three levels (I, II, III) of data processing and to access all data.
