ITP58 Data Processing
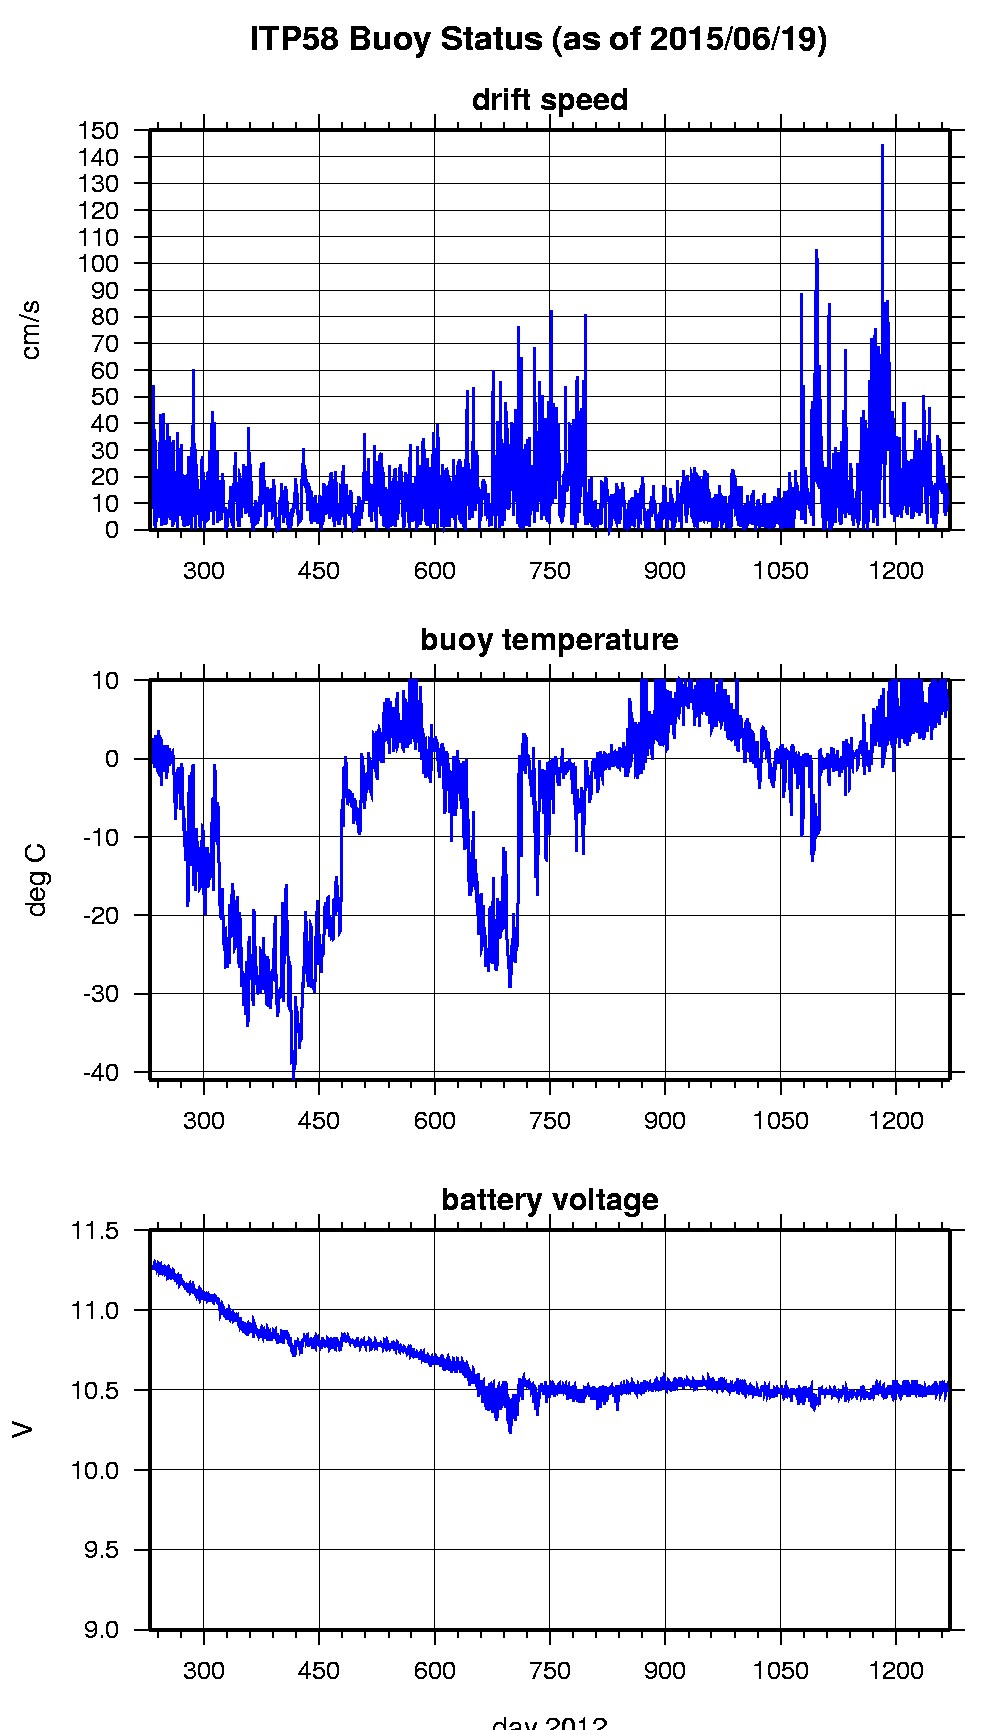
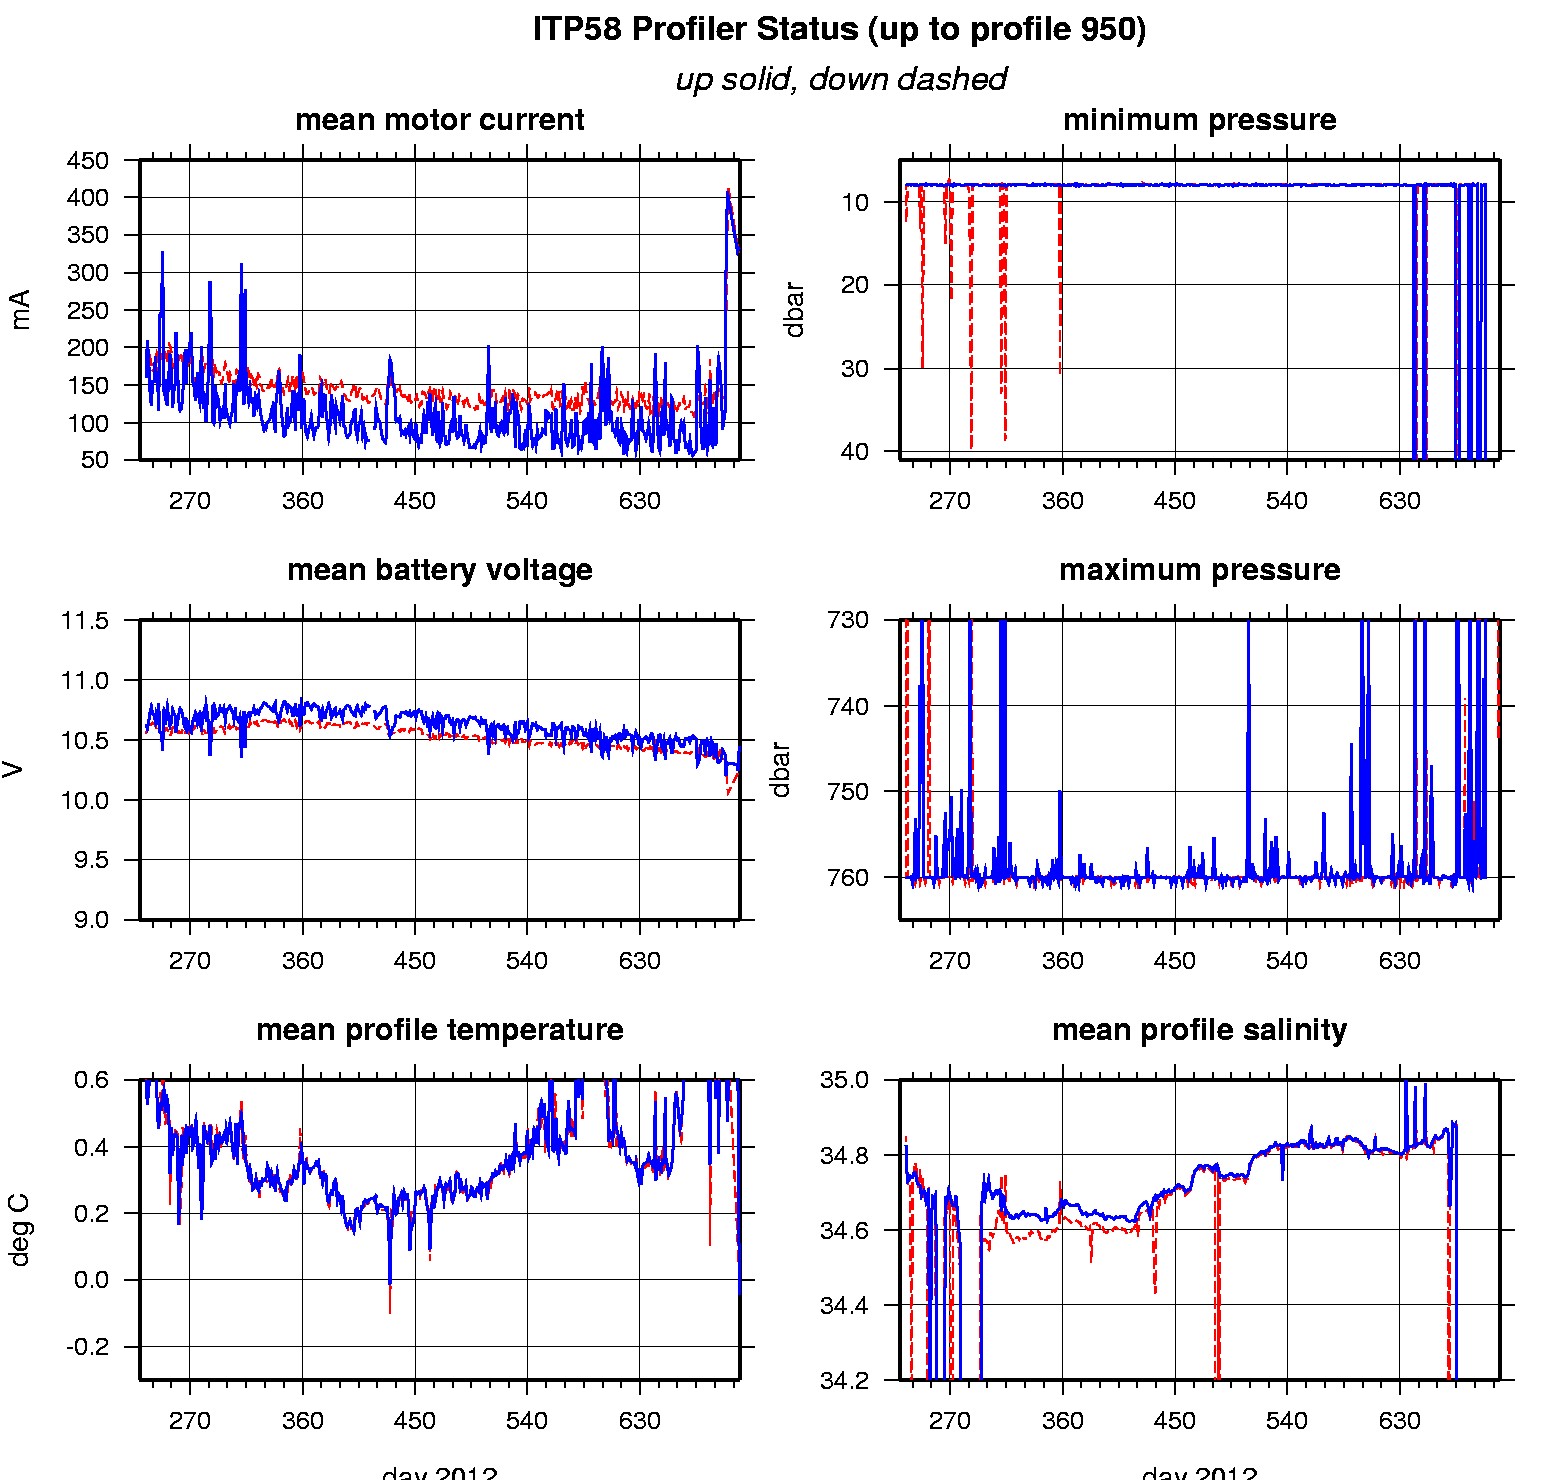
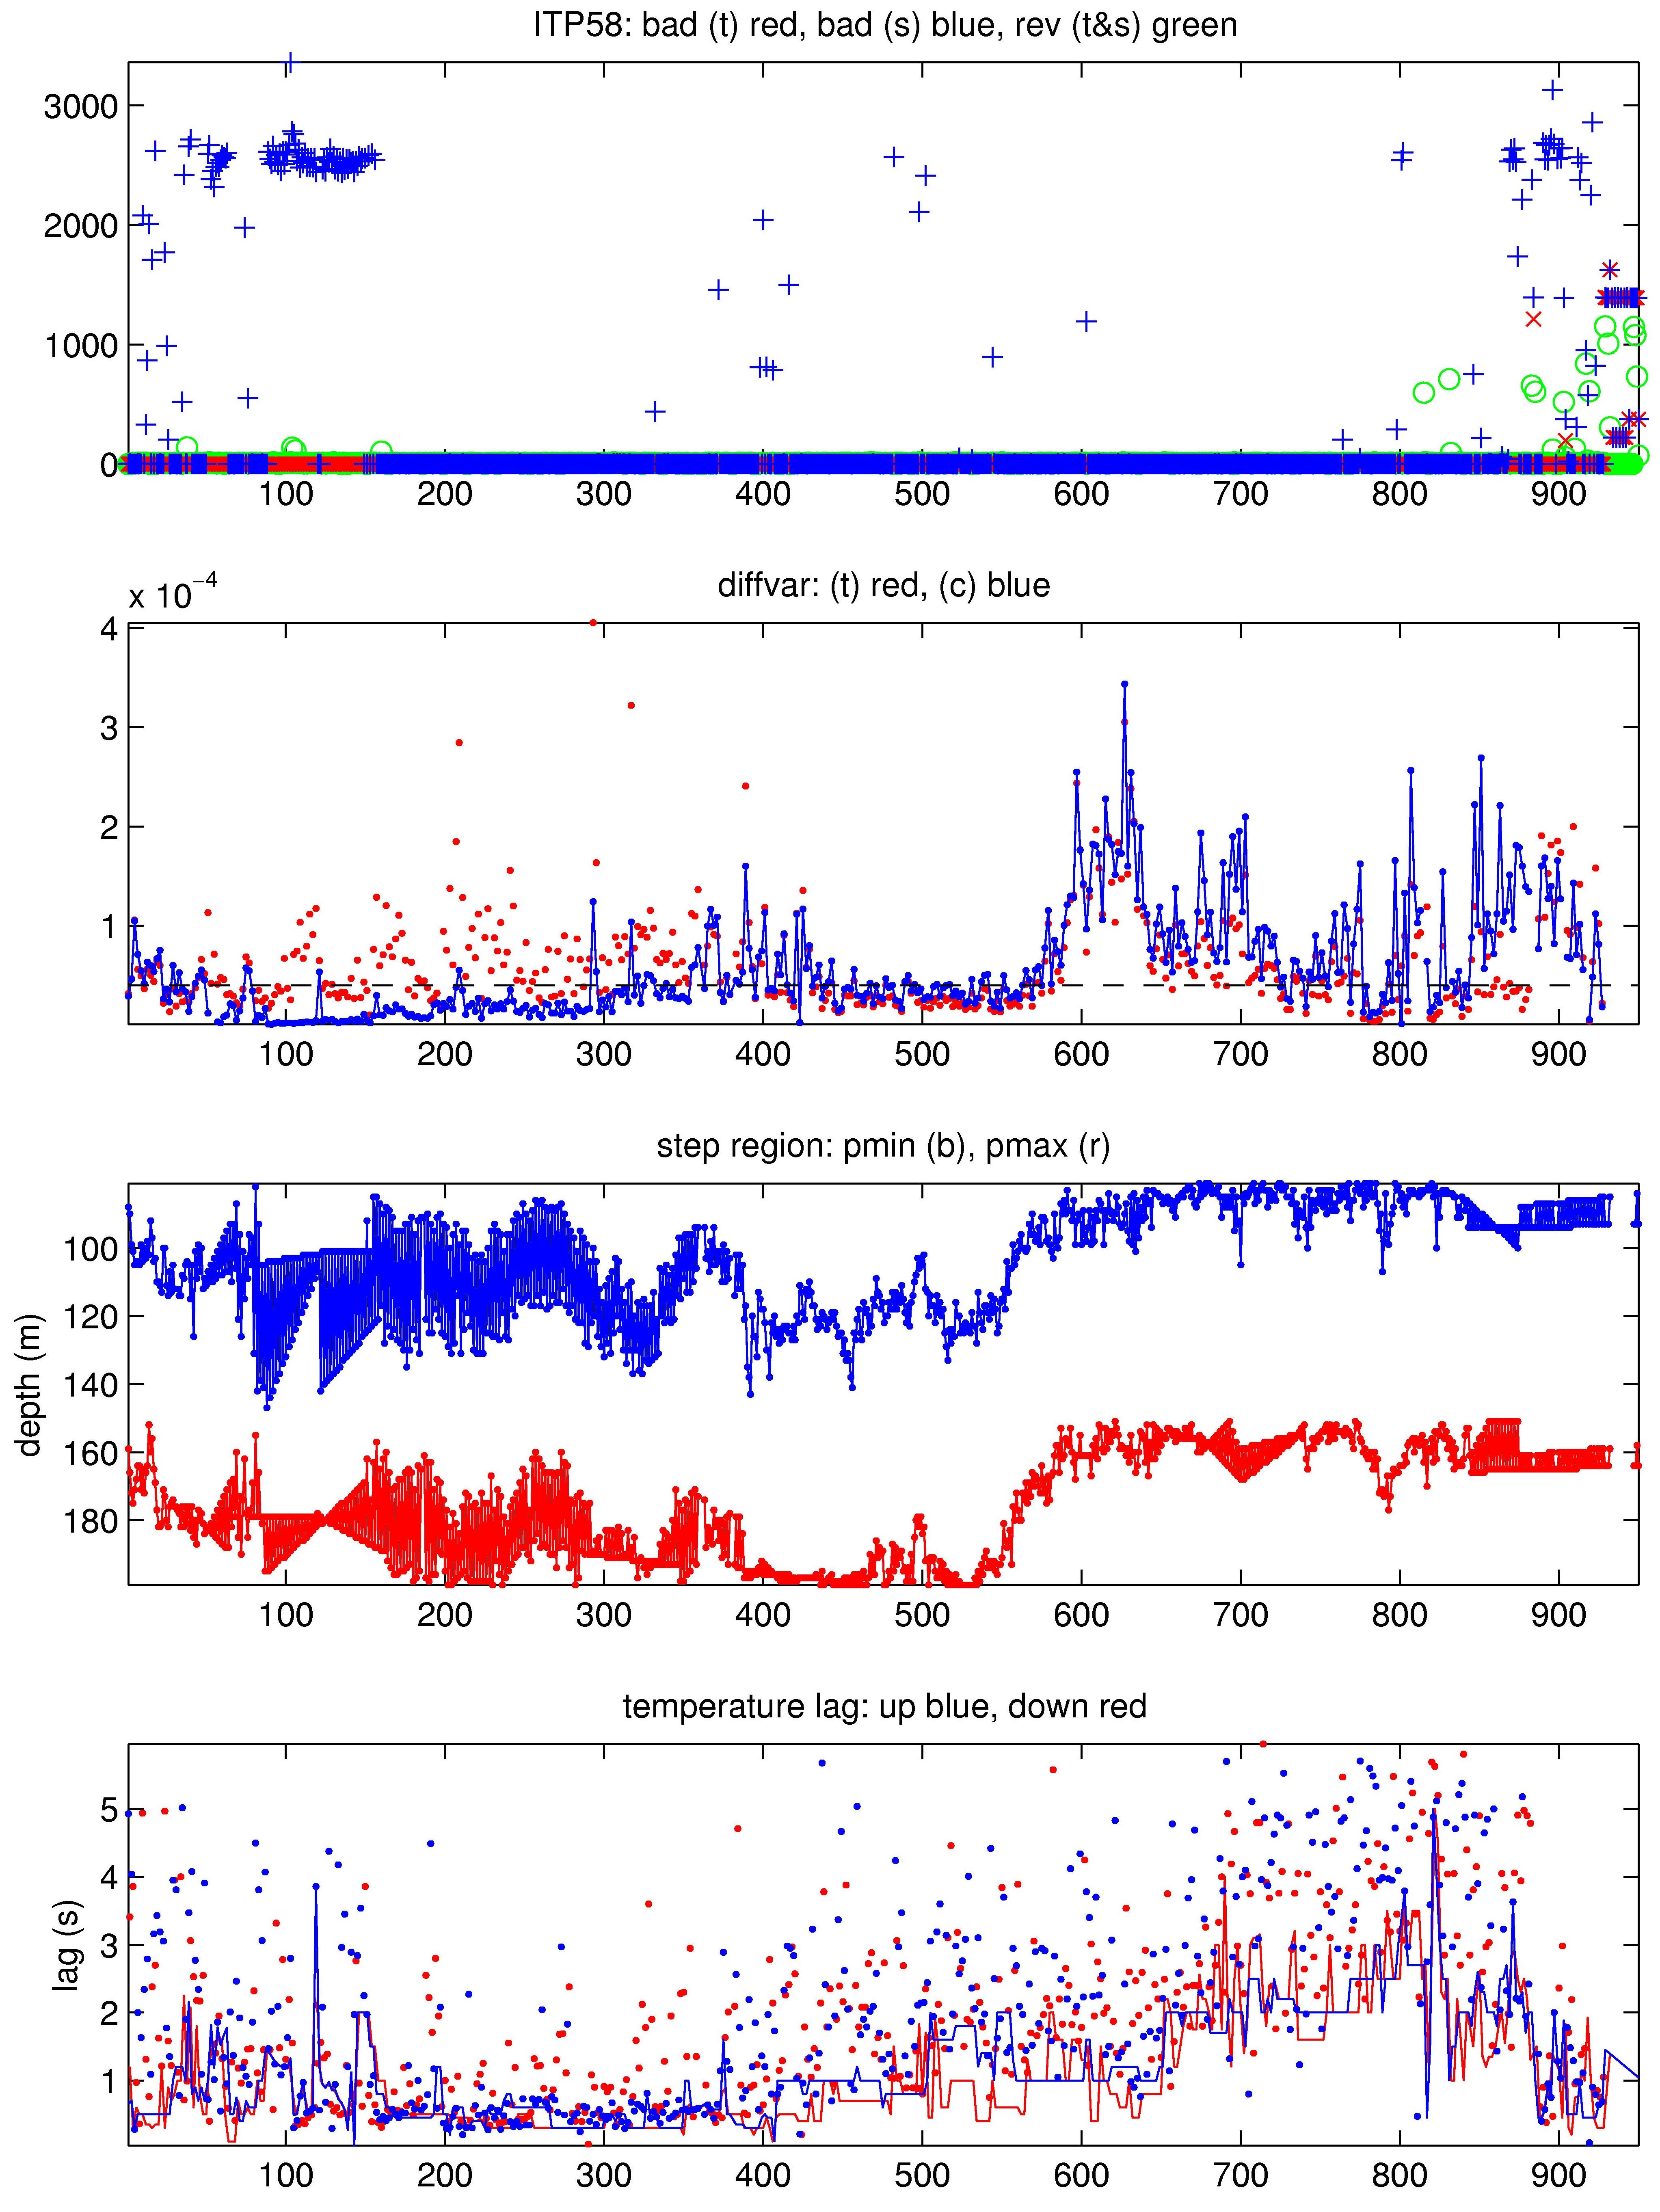
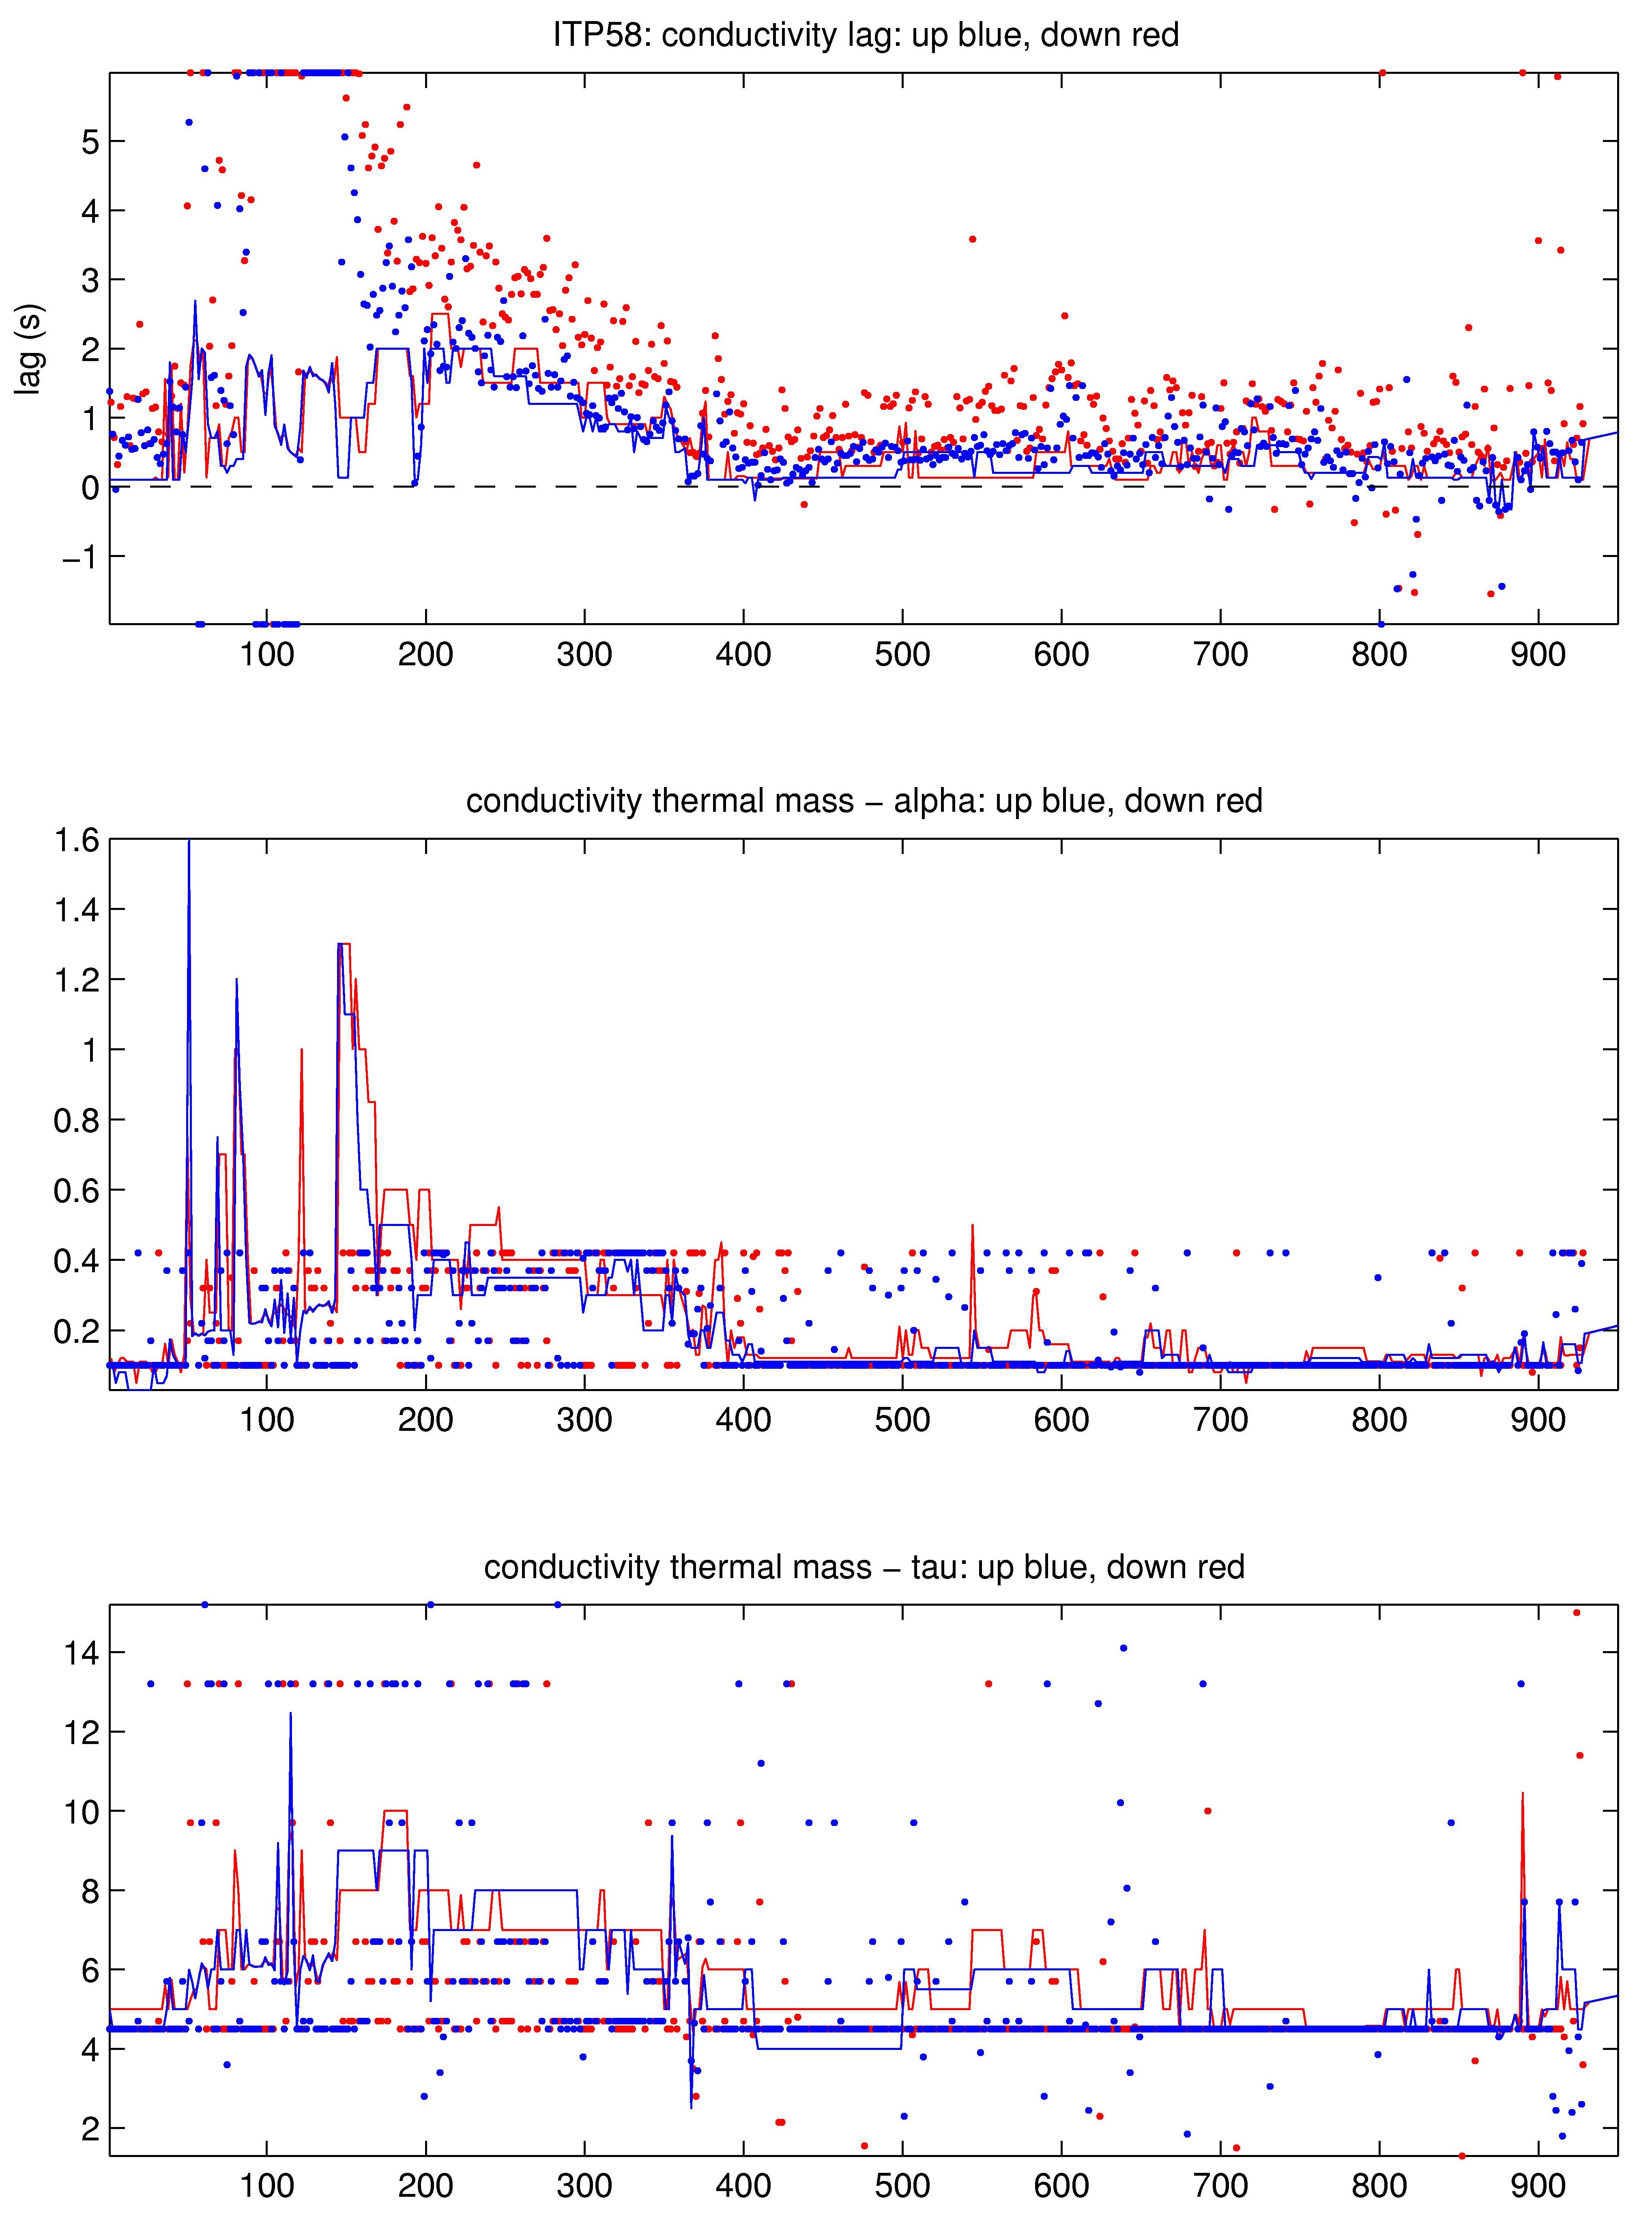
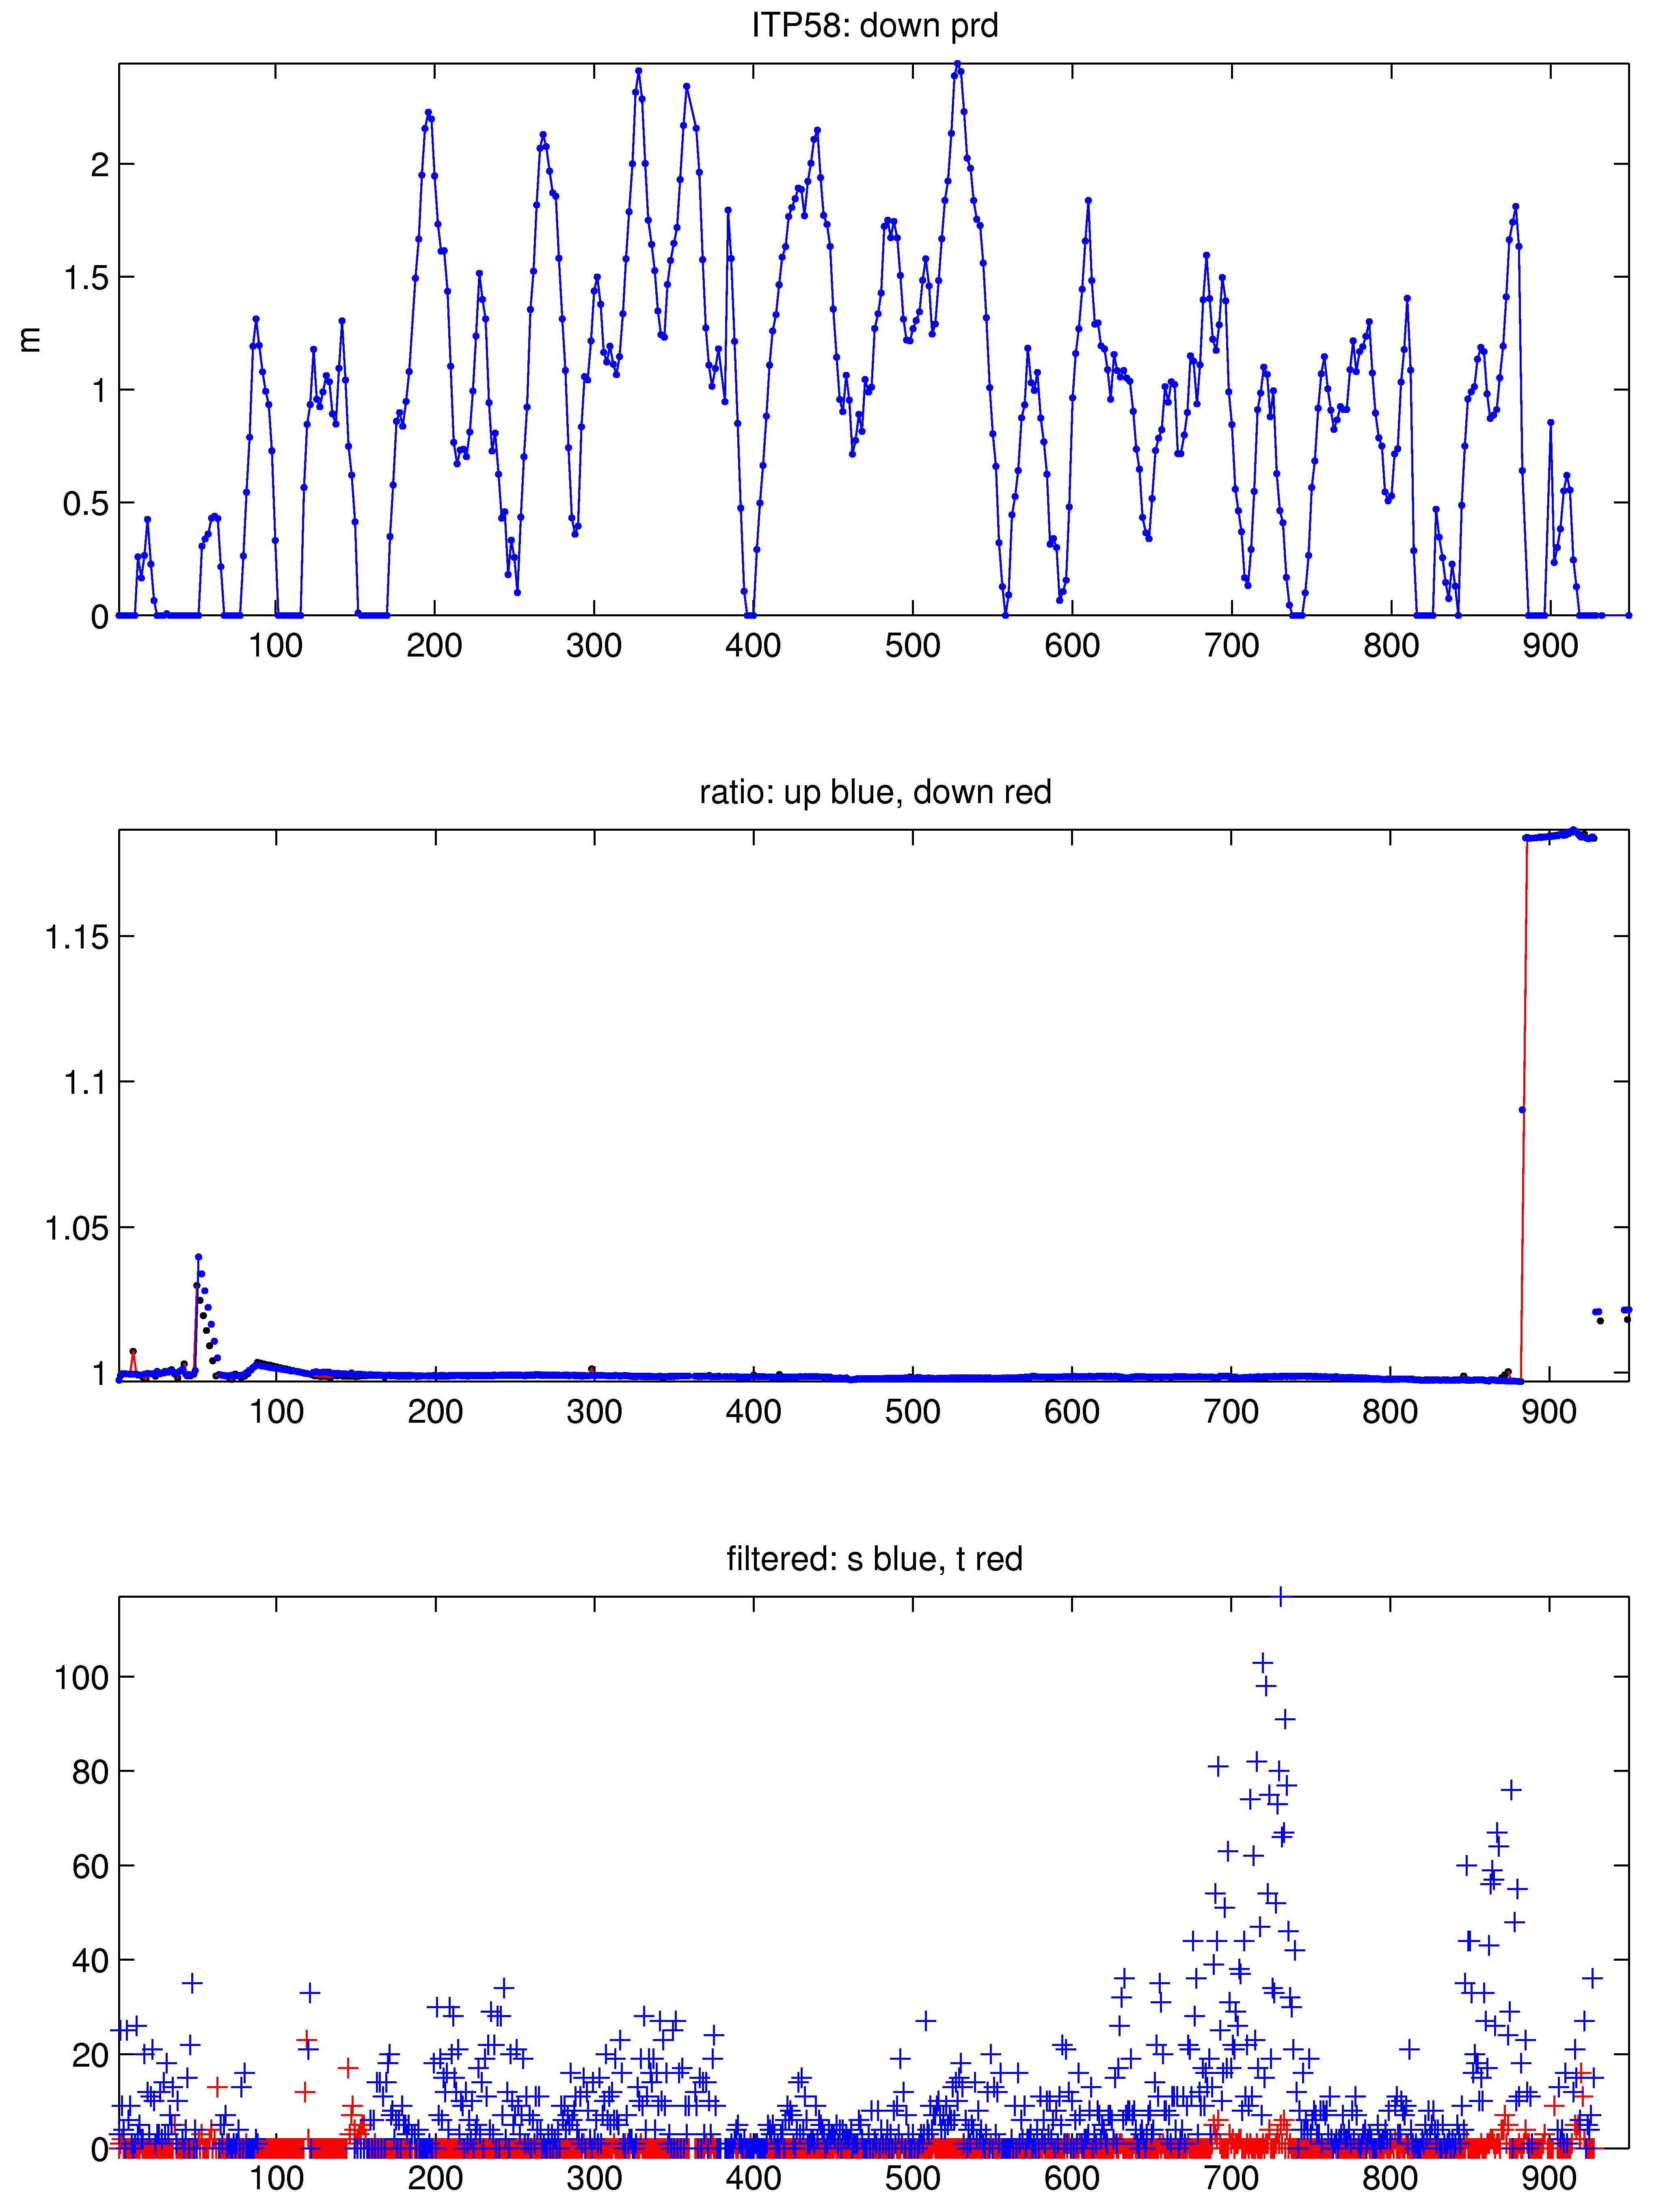
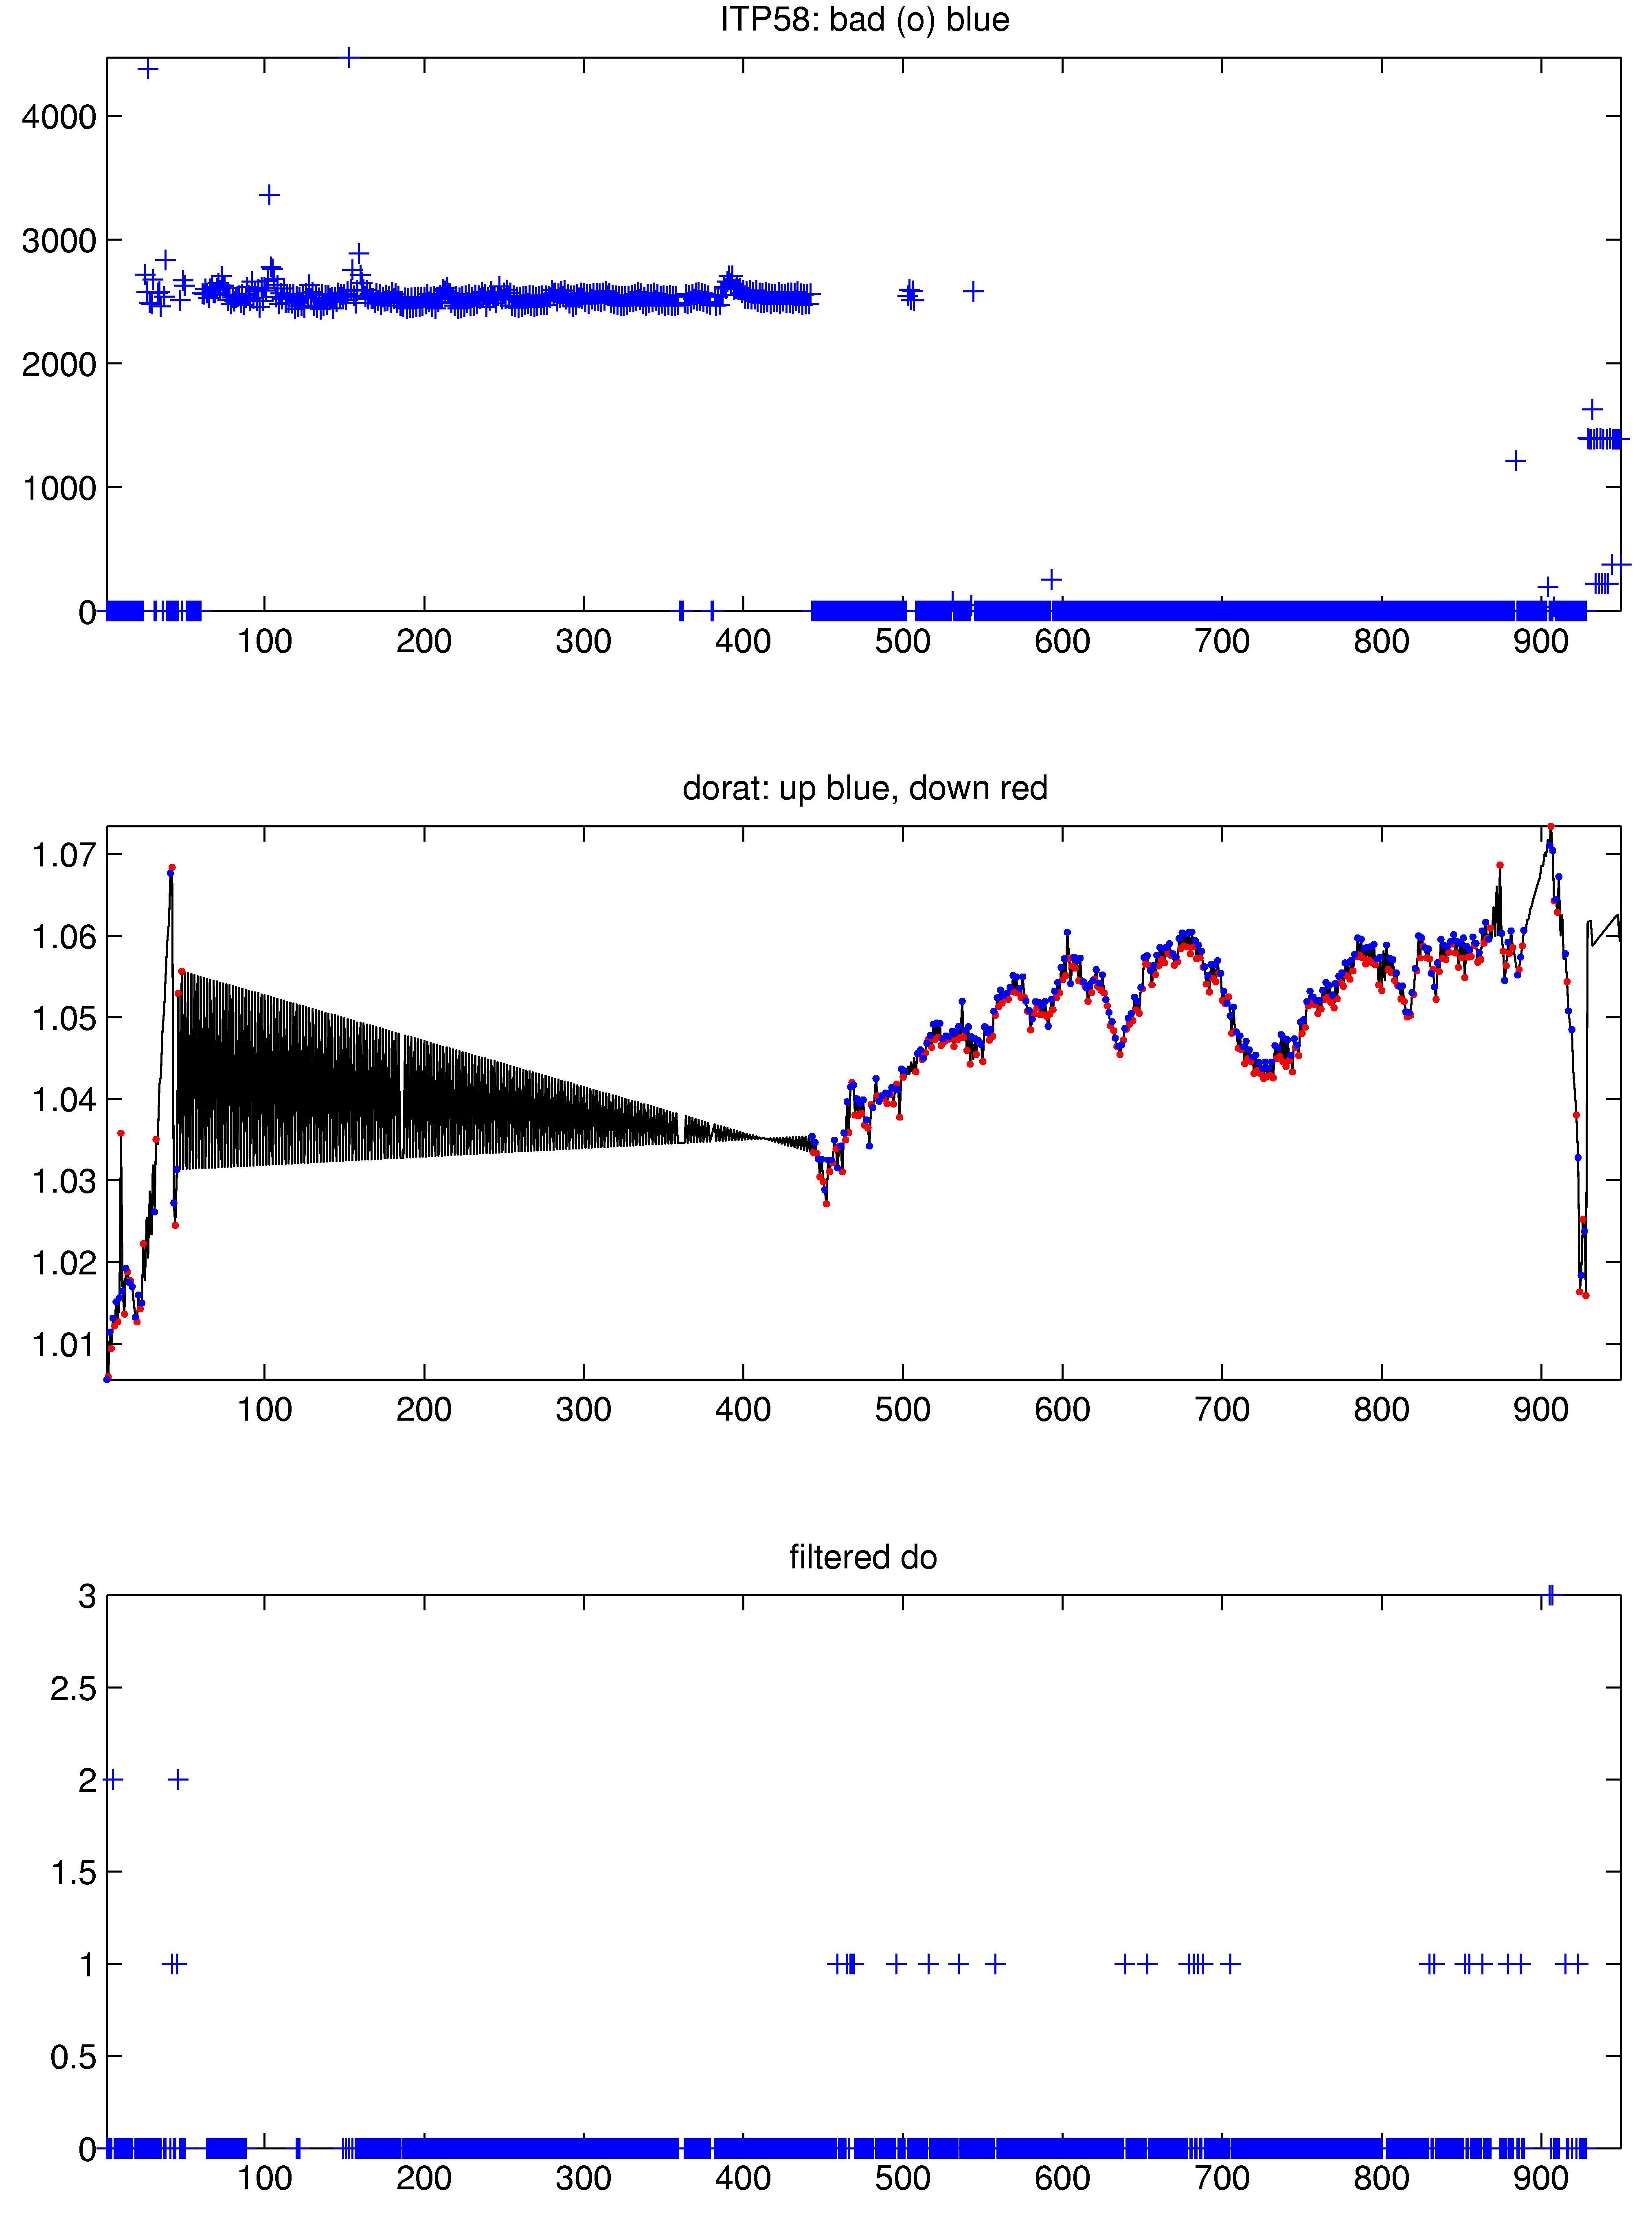
The 950 profiles that were transmitted from the ITP were processed according to the procedures described in the ITP Updated Data Processing Procedures. The processing parameters for this ITP are shown in the figures to the right.
Large series of fouled salinity profiles were removed between profiles 51-63, 89-148, and 890-904. Dissolved oxygen profiles between 49-440 were all removed due to presumed fouling, as the sensor recovered afterwards. Thermohaline staircases were not well defined, so that initial estimates for CTD lag corrections were poorly determined. These initial values were manually modified to reduce density spikes and inversions presumably related to reduced flow through the sensors. Thermal lag estimates were relatively large and variable, particularly after profile 400. On the other hand, the conductivity lag and thermal mass estimates were large and variable during the first 400 profiles, but stabilized at more typical values for later profiles. Dissolved oxygen ratio adjustments were also somewhat variable throughout. The potential conductivity adjustment increased nearly 20% after profile 882, all salinities and dissolved oxygen are questionable after profile 899, and all data from profiles after 928 were removed.
See the Data Products tab to the left for descriptions of the three levels (I, II, III) of data processing and to access all data.
