ITP38 Data Processing
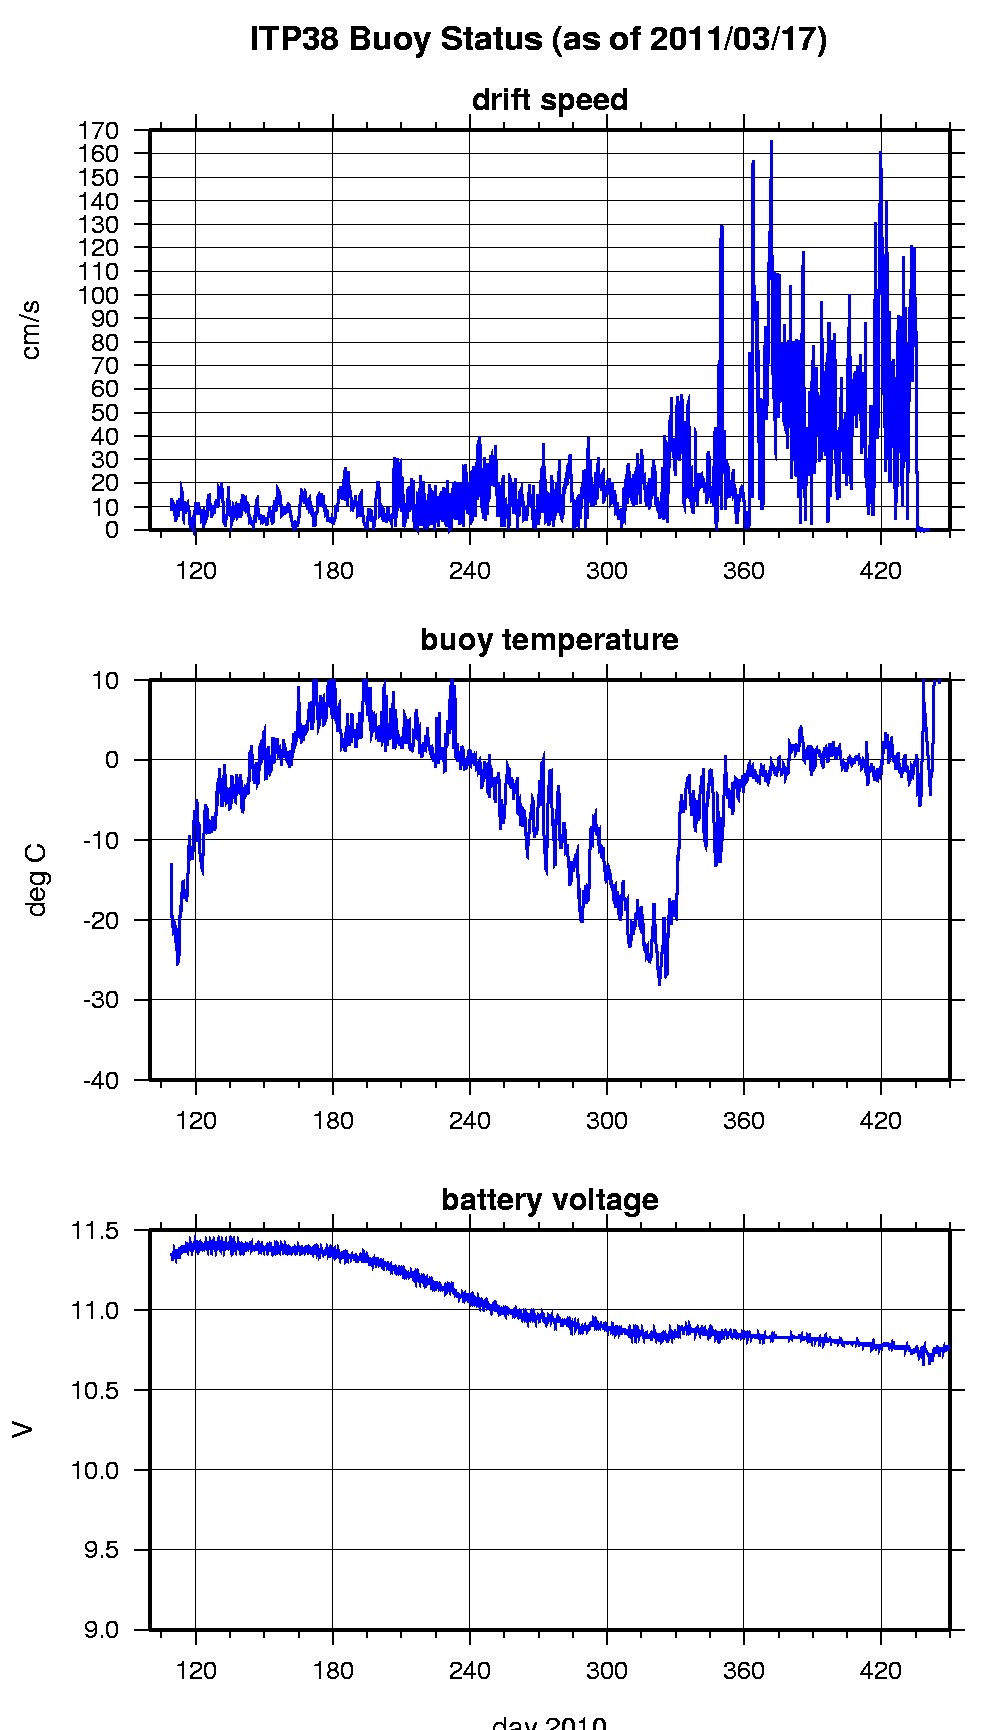
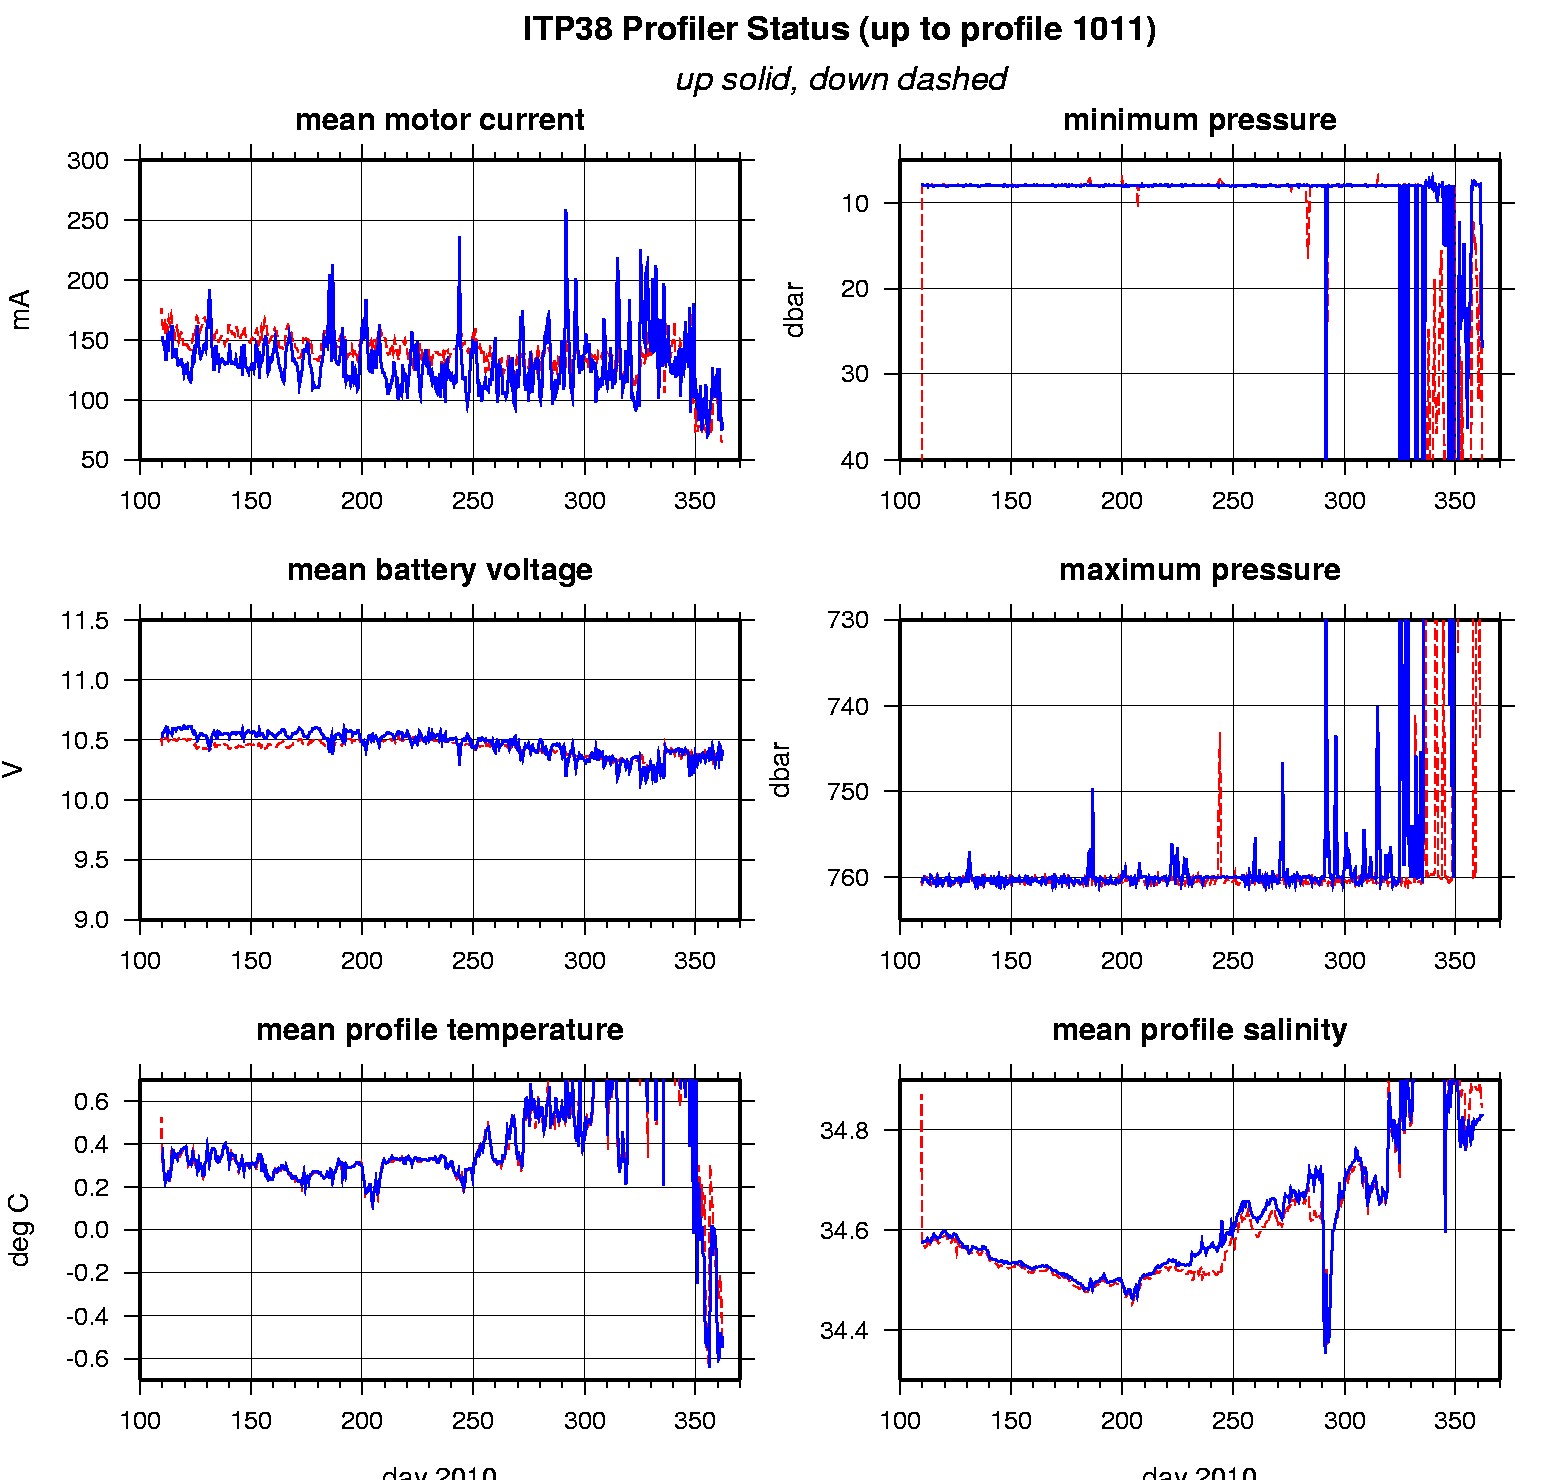
The 1011 profiles that were recovered from the ITP were processed according to the procedures described in the ITP Updated Data Processing Procedures. However, vertical coverage became intermitted when first up profiles (beginning with number 905) and then also down profiles (beginning with number 958) failed to cover the full depth range. Downs recovered for a few profiles just before the record ended.
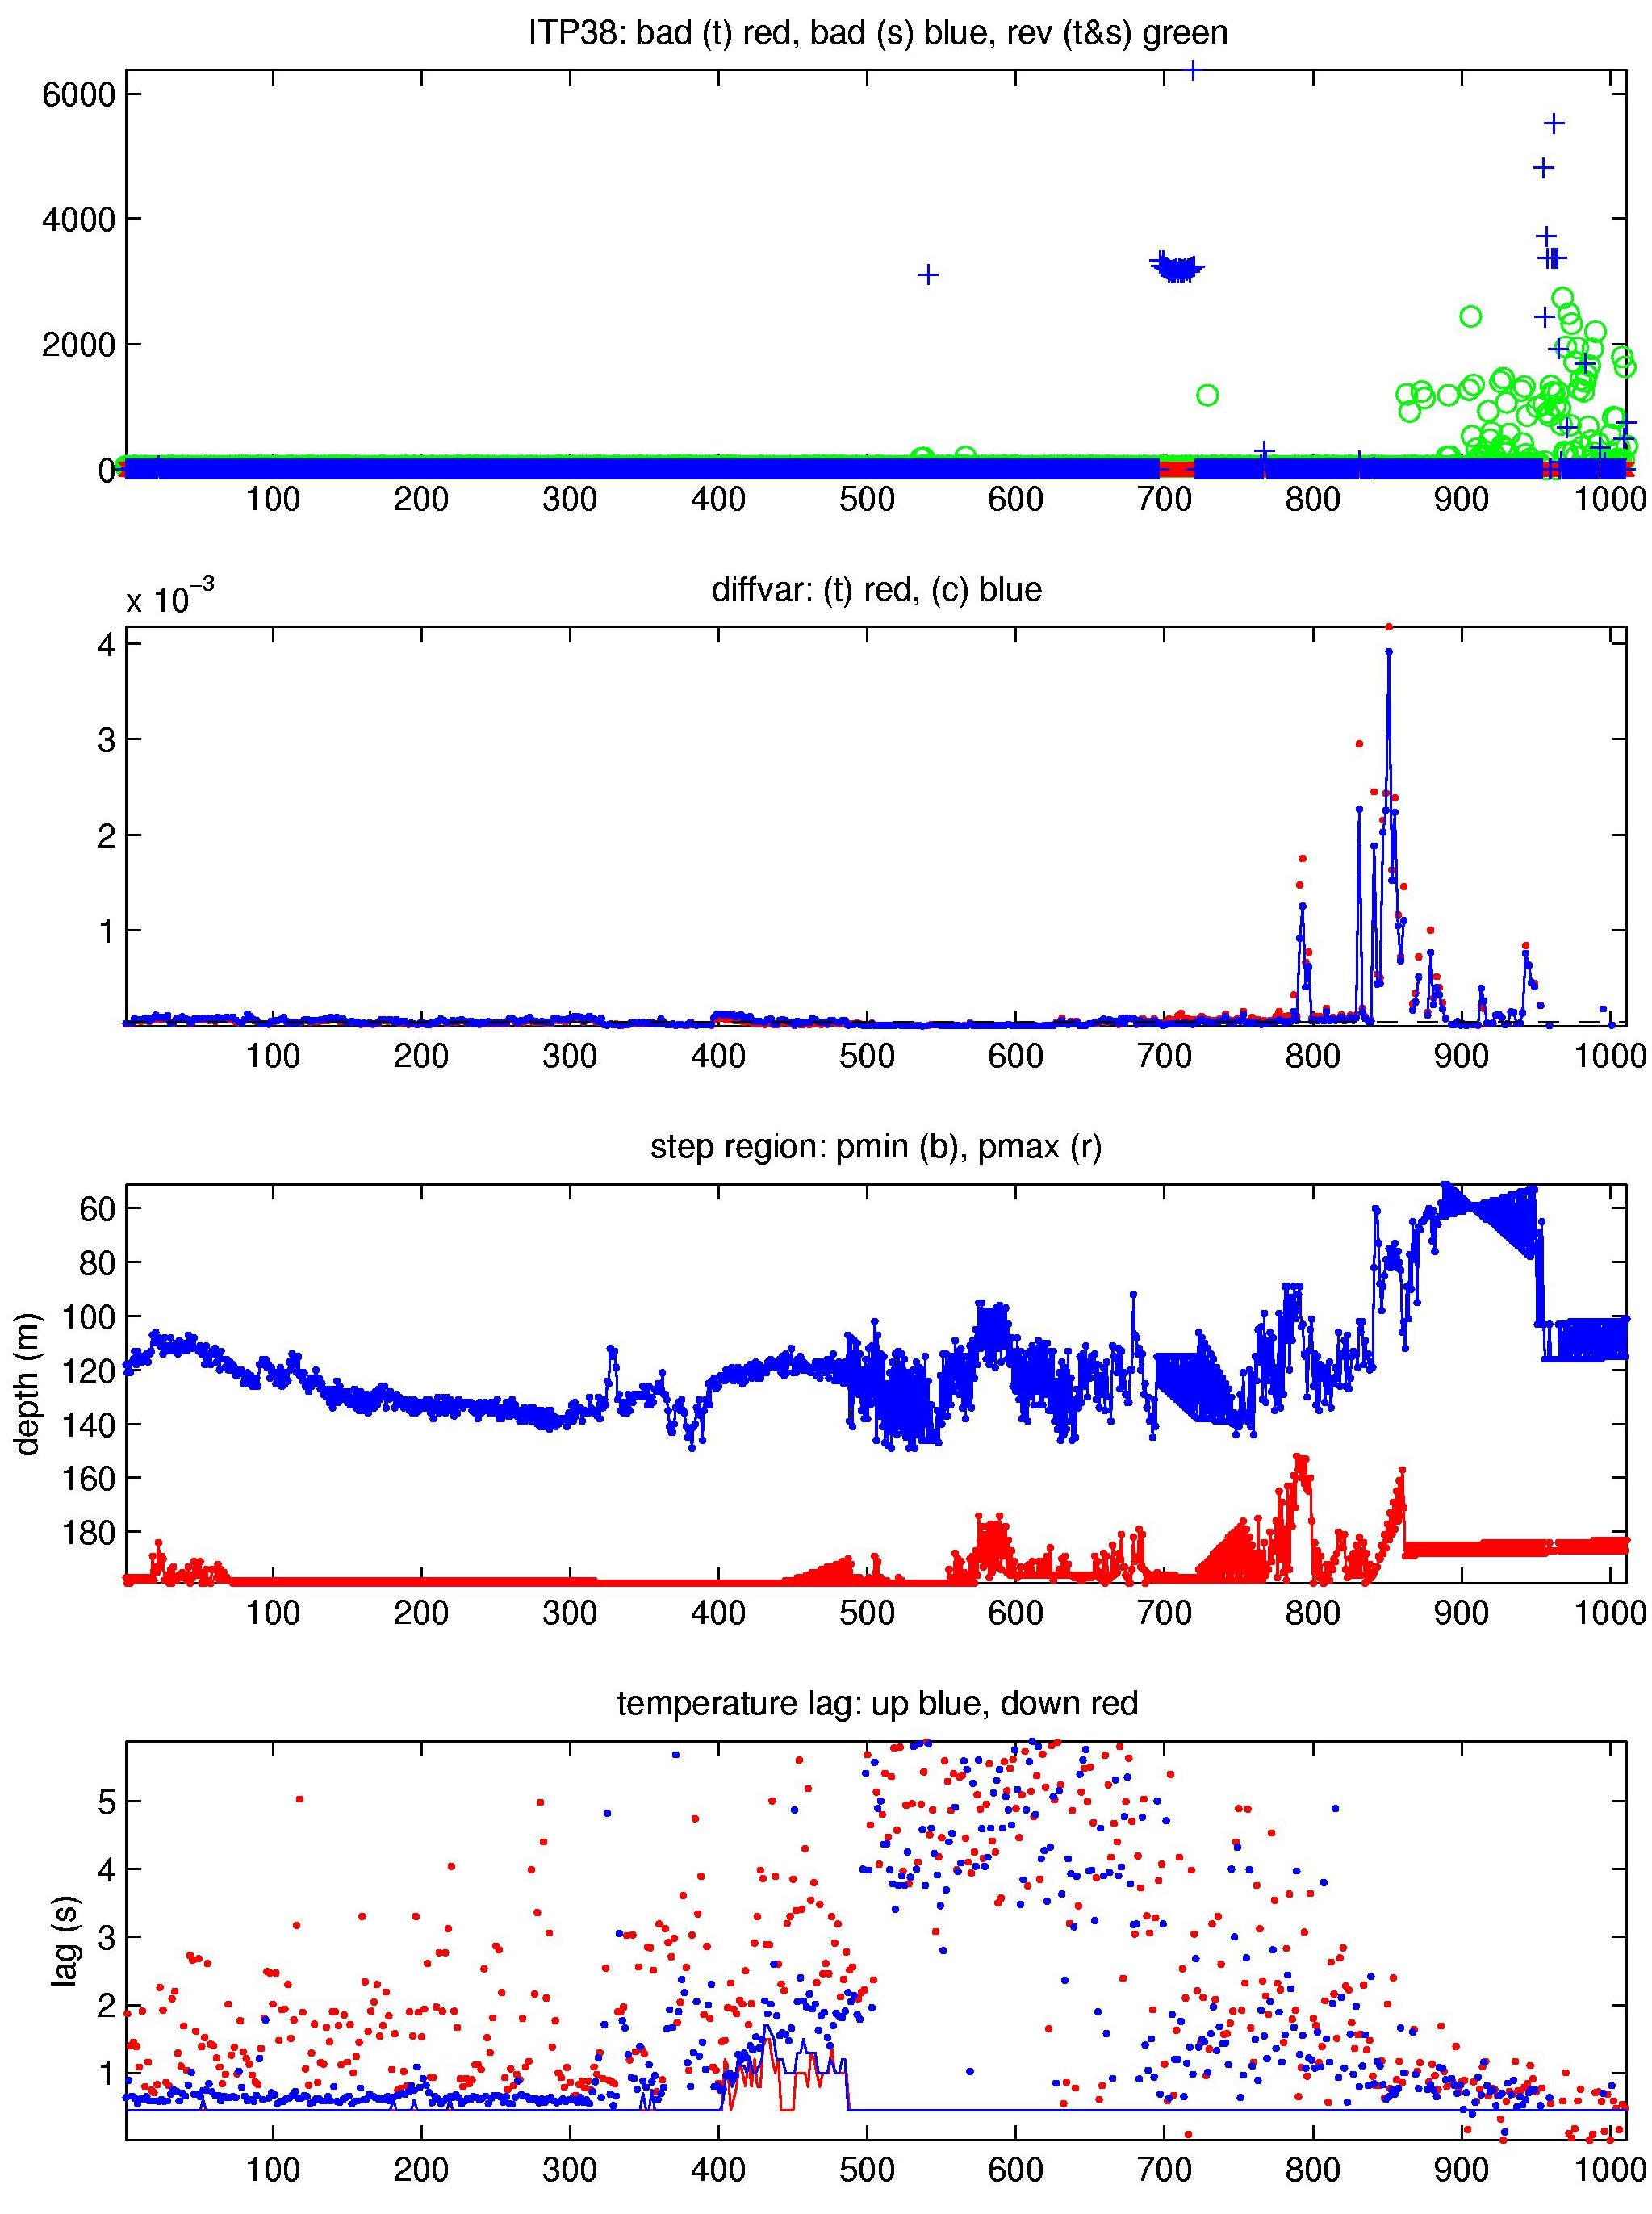
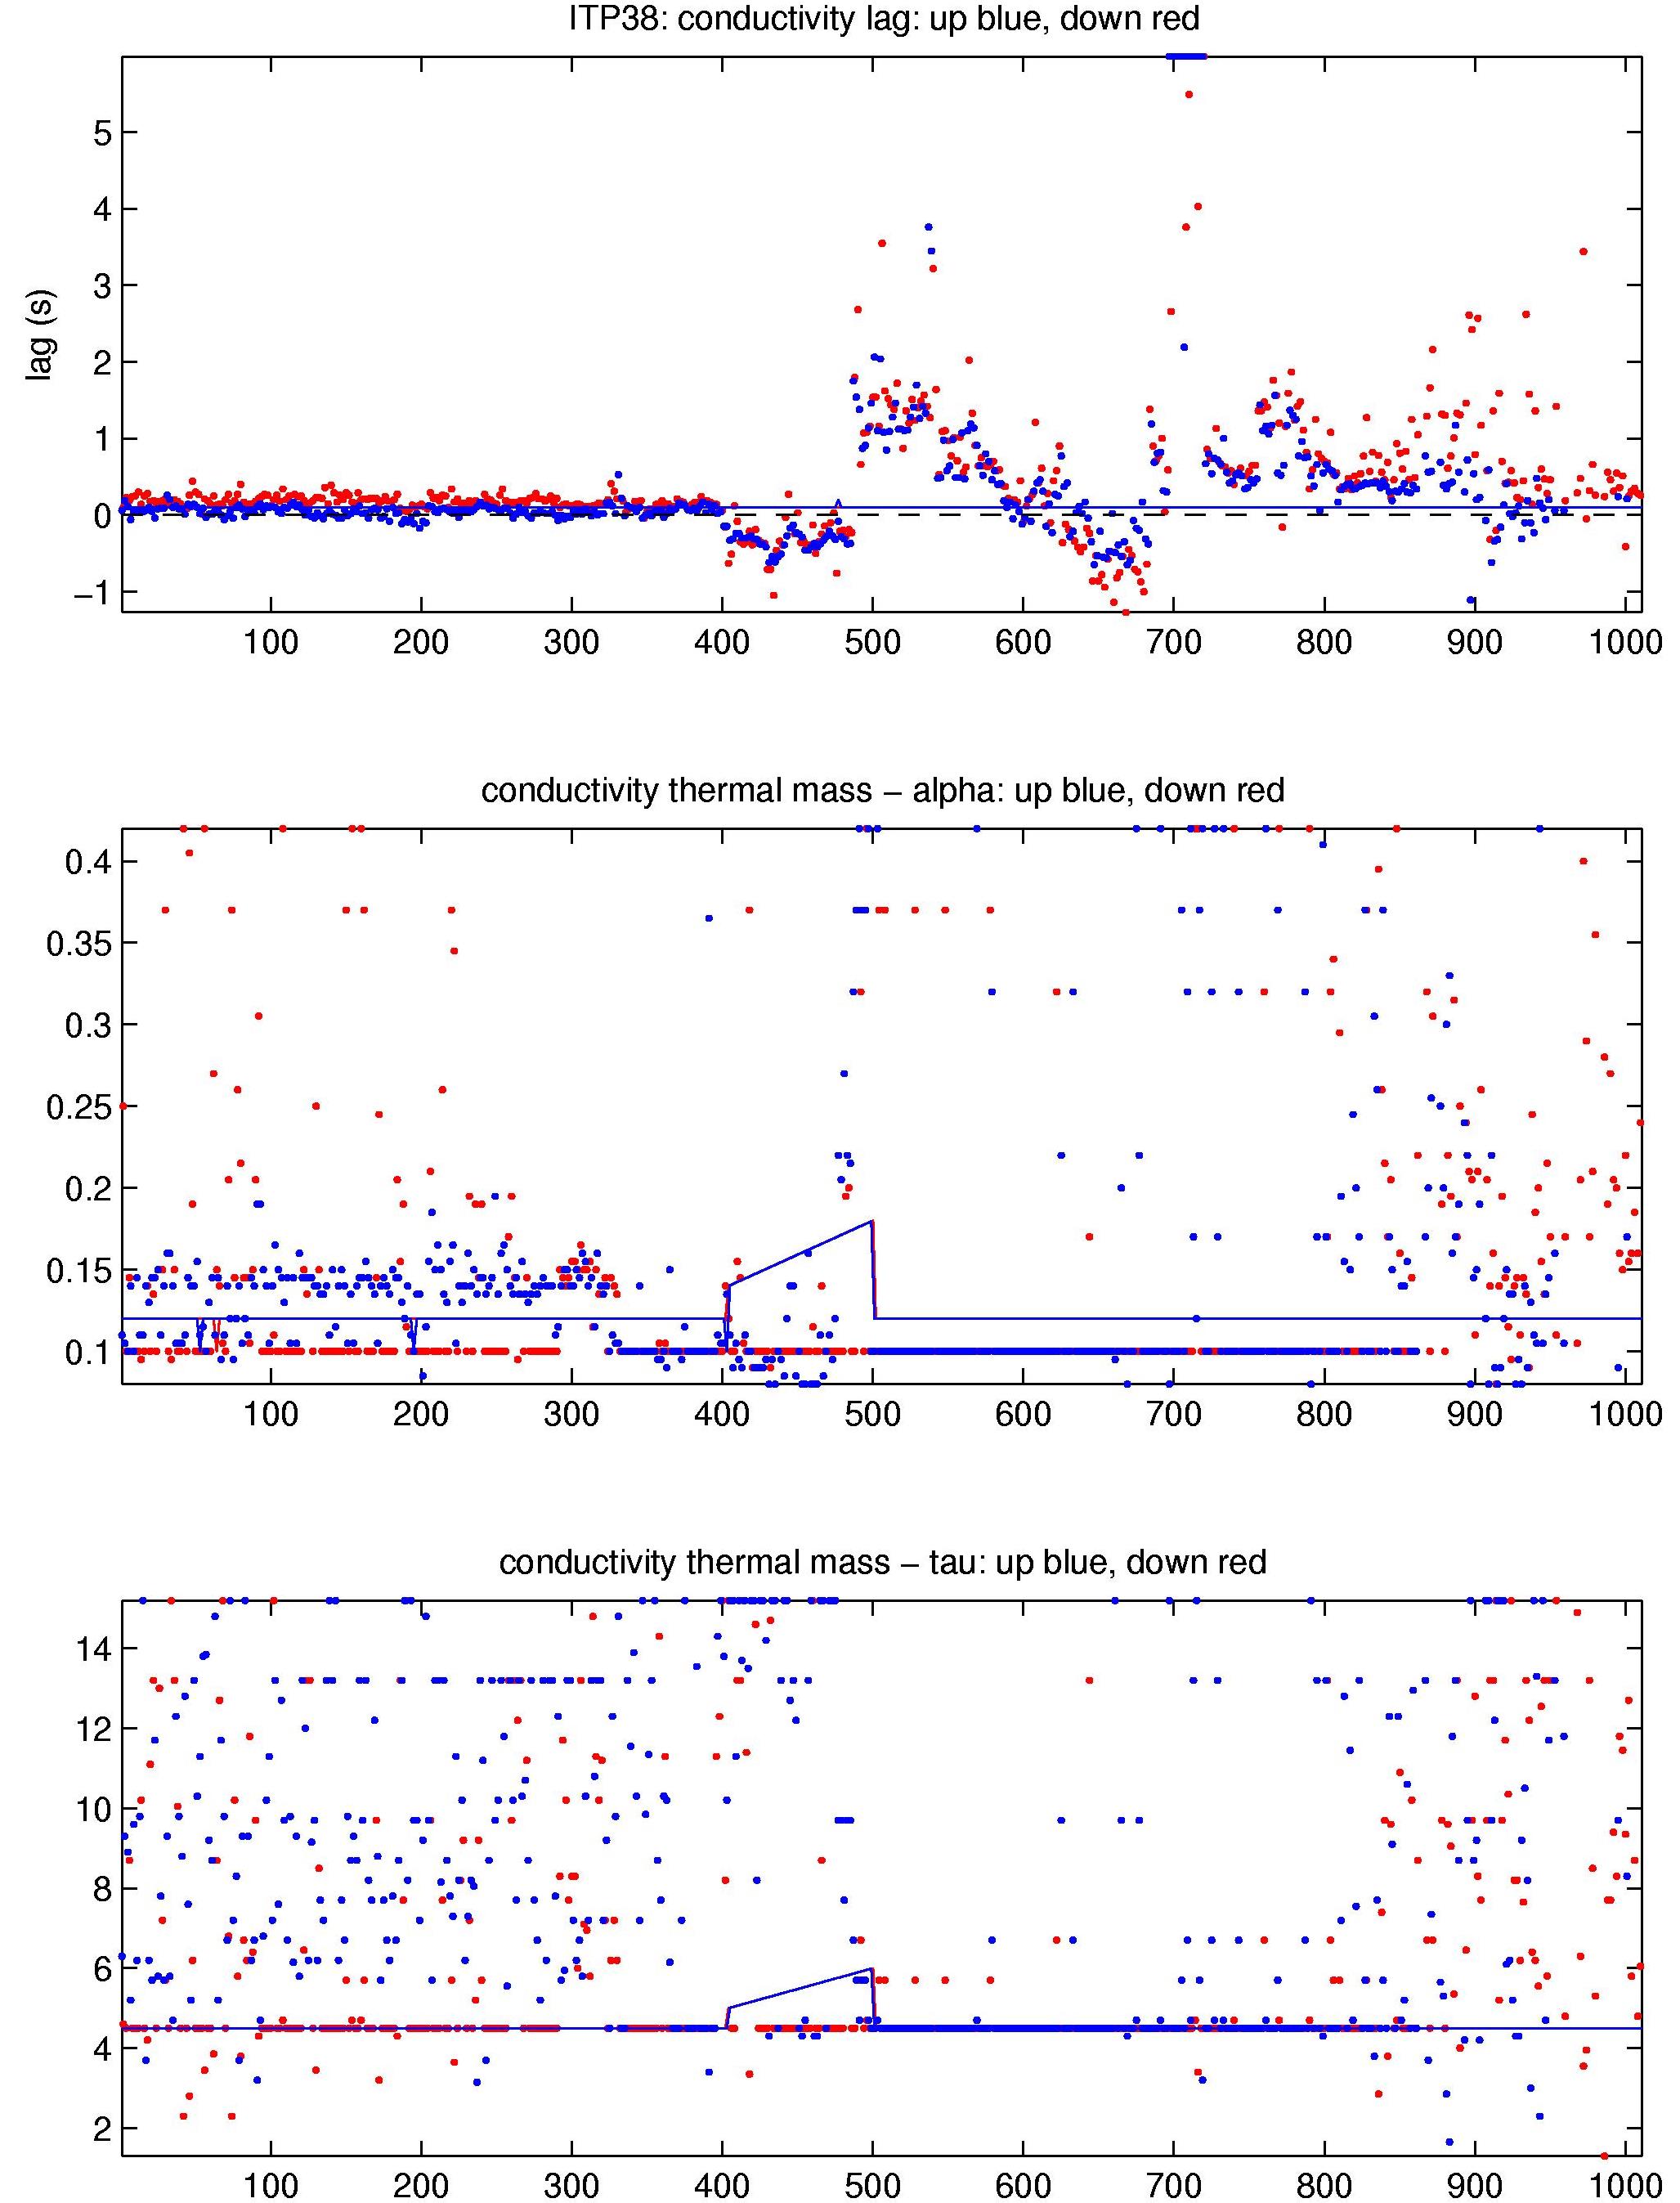
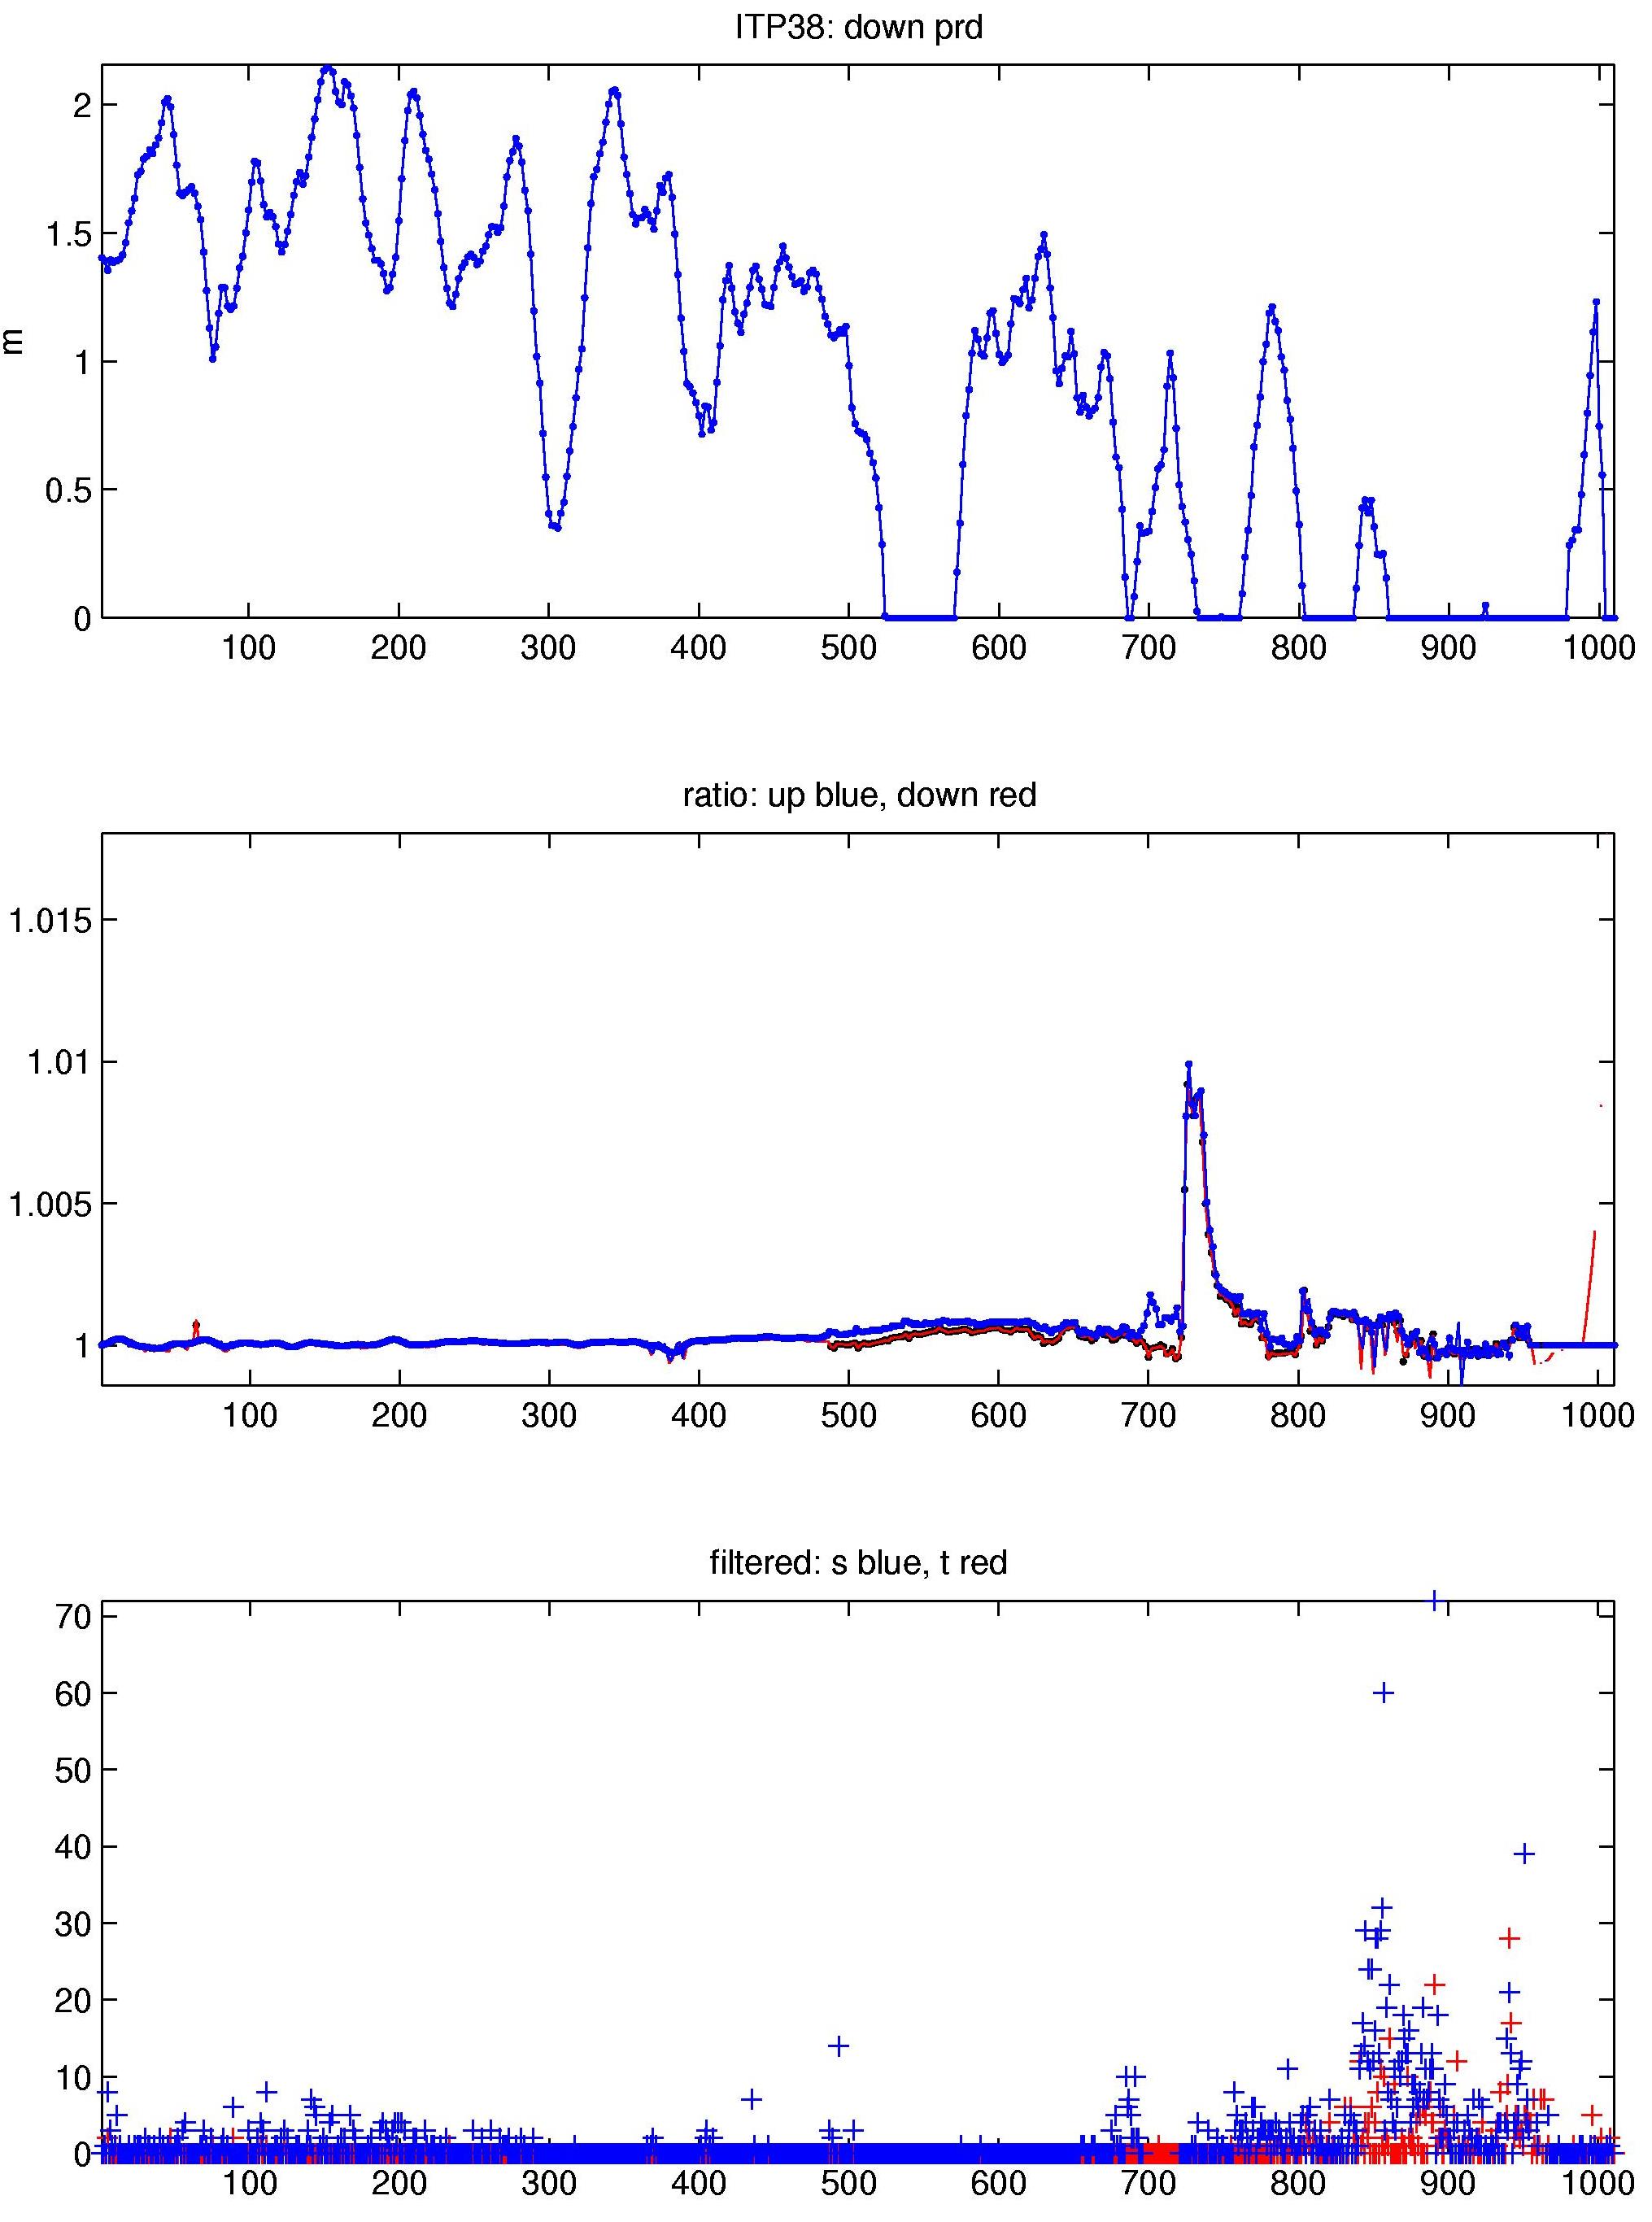
Following a very clean first half of the record, a significant difference between up and down profiles suddenly appeared by profile 487, and, together with increased profile noise, remained for the rest of the dataset. Various attempts to remove the hysteresis via sensor lags were unsuccessful. However, these profiles seemed "not bad enough" to be completely removed, and instead were marked as "questionable" (quality flag = 1).
The dataset was processed according to the procedures described in the ITP Updated Data Processing Procedures. The processing parameters for this ITP are shown in the figures to the right. Thermohaline staircases were initially present but not well developed (and not recognizable after profile 486). After comparing different options, we relied primarily on standard lag settings that had worked well in the past for well operating ITPs, with small adjustments to correct small up/down hysteresis between profiles 404 to 486, or to correct spikes, etc. when possible.
The noise and up/down hysteresis during the second half of the record showed some variability. In particular, a set of profiles from 698 to 721 was significantly worse, and also included the only large "spike" in the conductivity adjustment ("rat"). Presumably it was affected by an additional contamination, and together with a small number of individual outlier profiles, was removed from the dataset, as were some of the very short profiles towards the end of the record.
See the Data Products tab to the left for descriptions of the three levels (I, II, III) of data processing and to access all data.
