ITP35 Data Description
The ITP profiler was configured to operate on a pattern sampling schedule of vertical profiles interspersed with parked measurement intervals. Profiles were obtained every 4 hours to 150 m depth, with 2 of those extending to 750 m depth. Twice daily the profiler was parked near 6 m depth to sample for 40 minutes to observe turbulent fluctuations. In the surface package, the GPS receiver was powered hourly to obtain locations, and buoy temperature and battery voltage status were recorded.
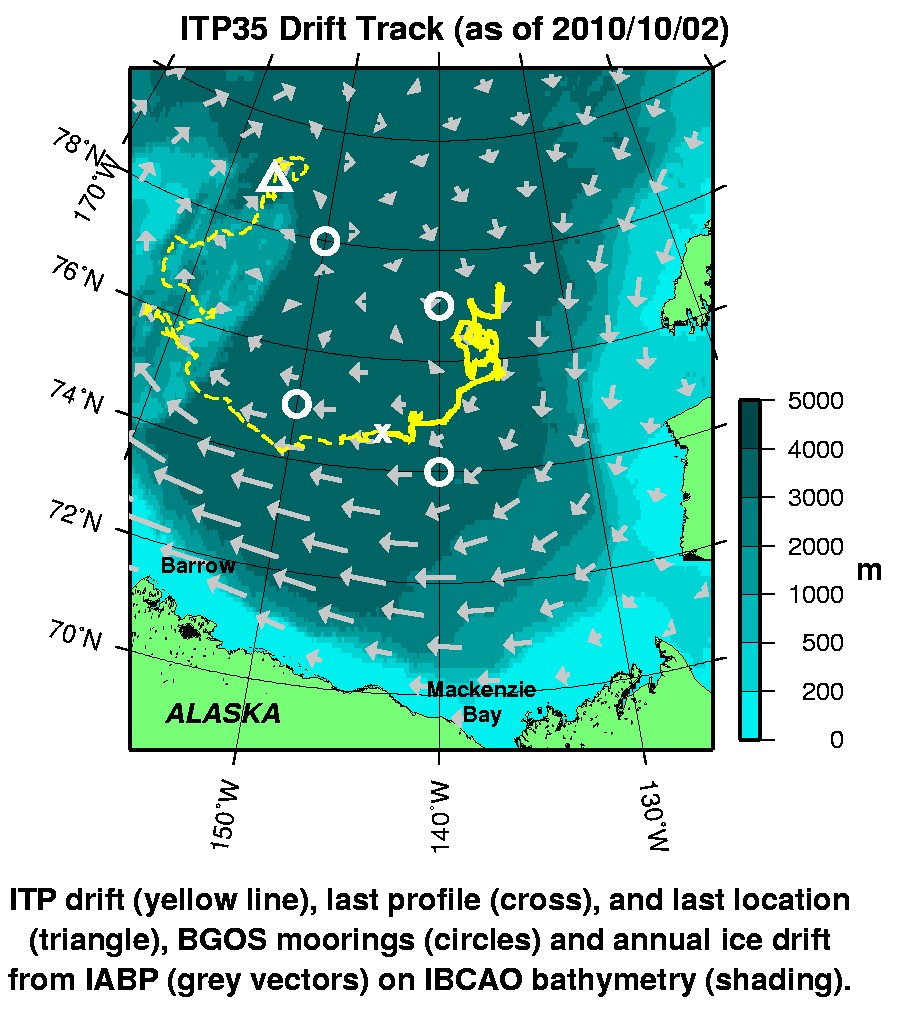
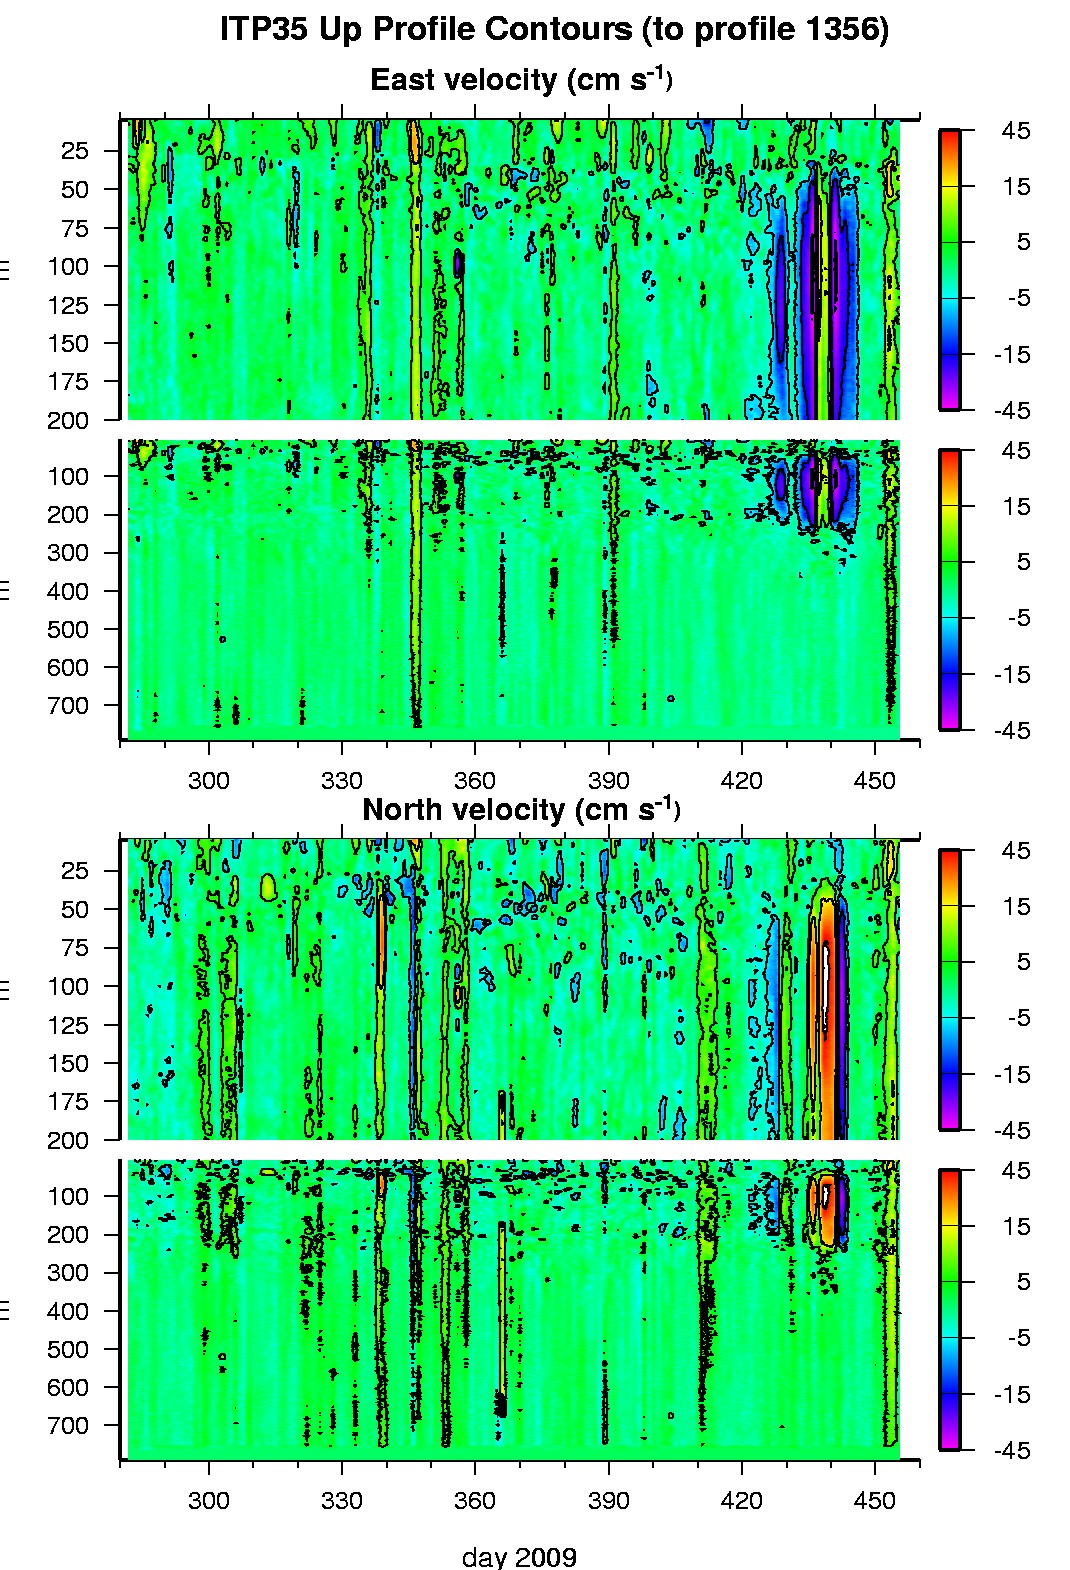
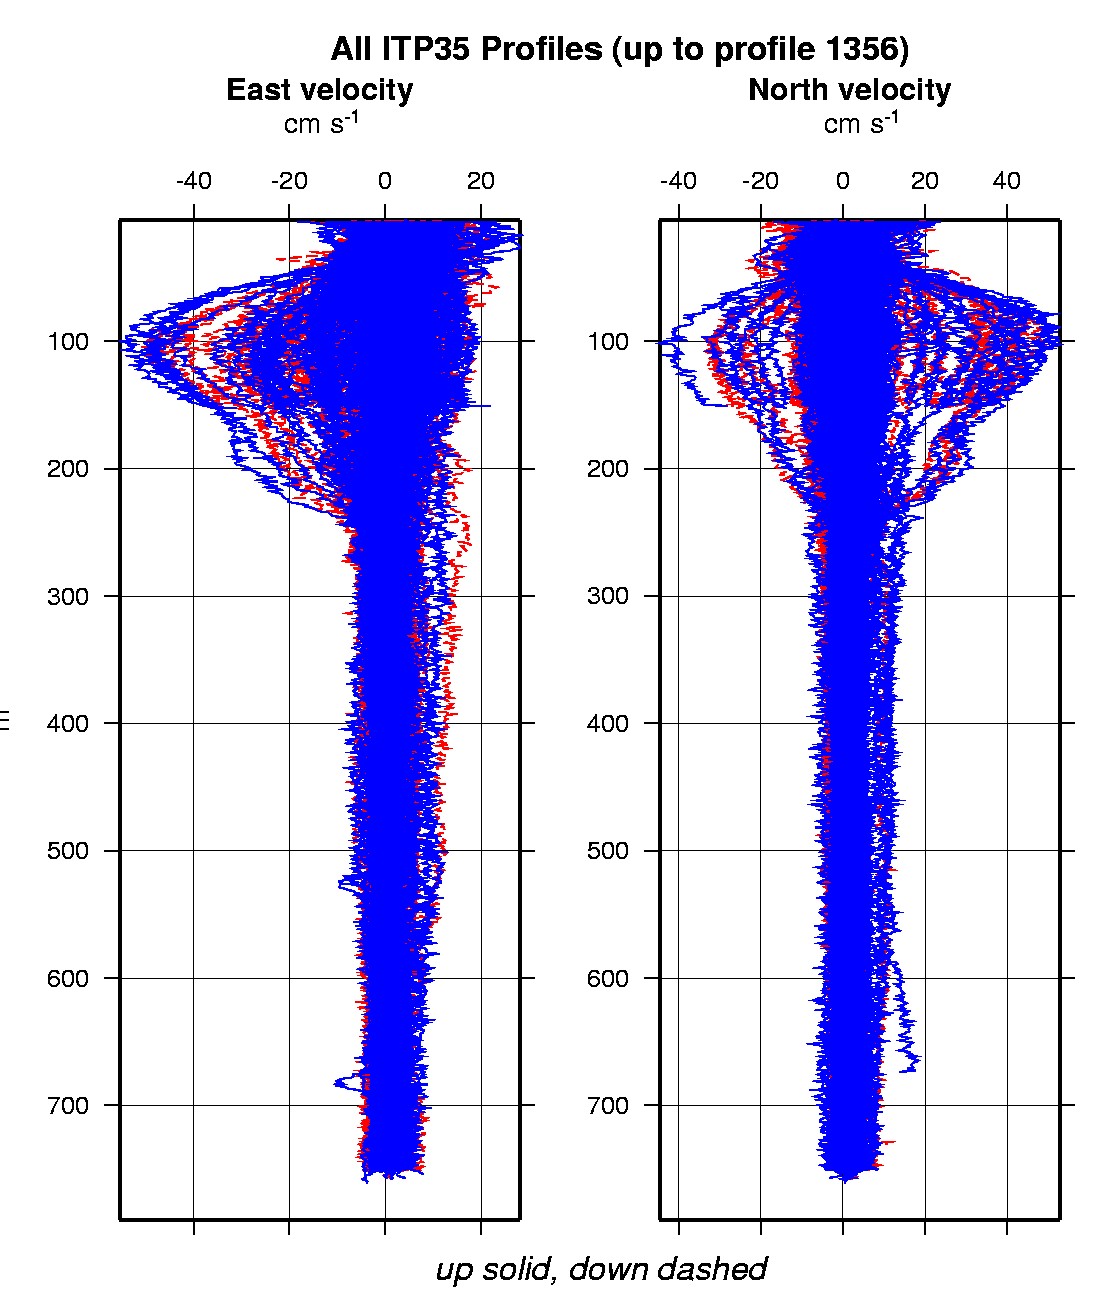
The buoy drifted south then west through the BGOS mooring array without any data after the first CTD profile from the underwater unit reaching the surface package. A timing problem between the surface package and underwater unit due to the large size of the velocity files prevented the transfer of data. However, the profiler continued to obtain data reliably and store the information internally, finally ceasing to profile on March 31, 2010 because the flash card directory limit was reached, not due to power limitations or instrument failure. Later the underwater unit dragged on the Northwind Ridge, but fortuitously was not torn from the tether so that all of the data could be retrieved when the unit was recovered. See Thwaites et al. (2011) and Cole et al. (2014) for detailed descriptions of the velocity data including turbulence, Ekman veering, and internal wave results.
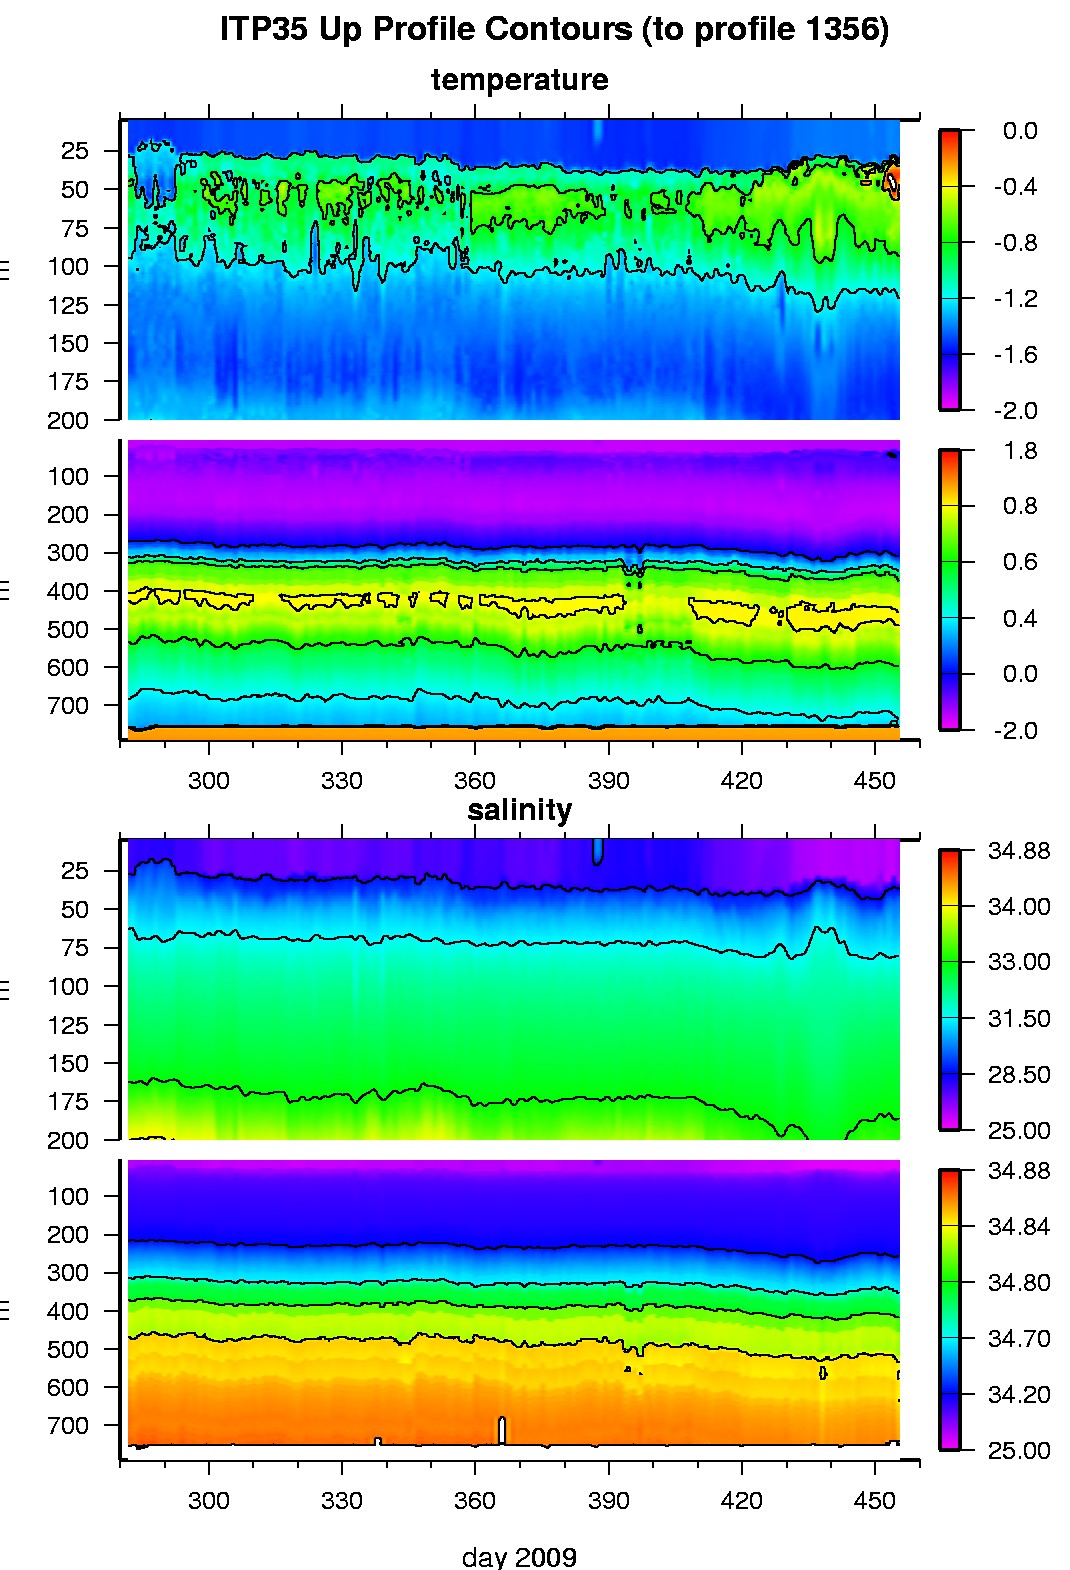
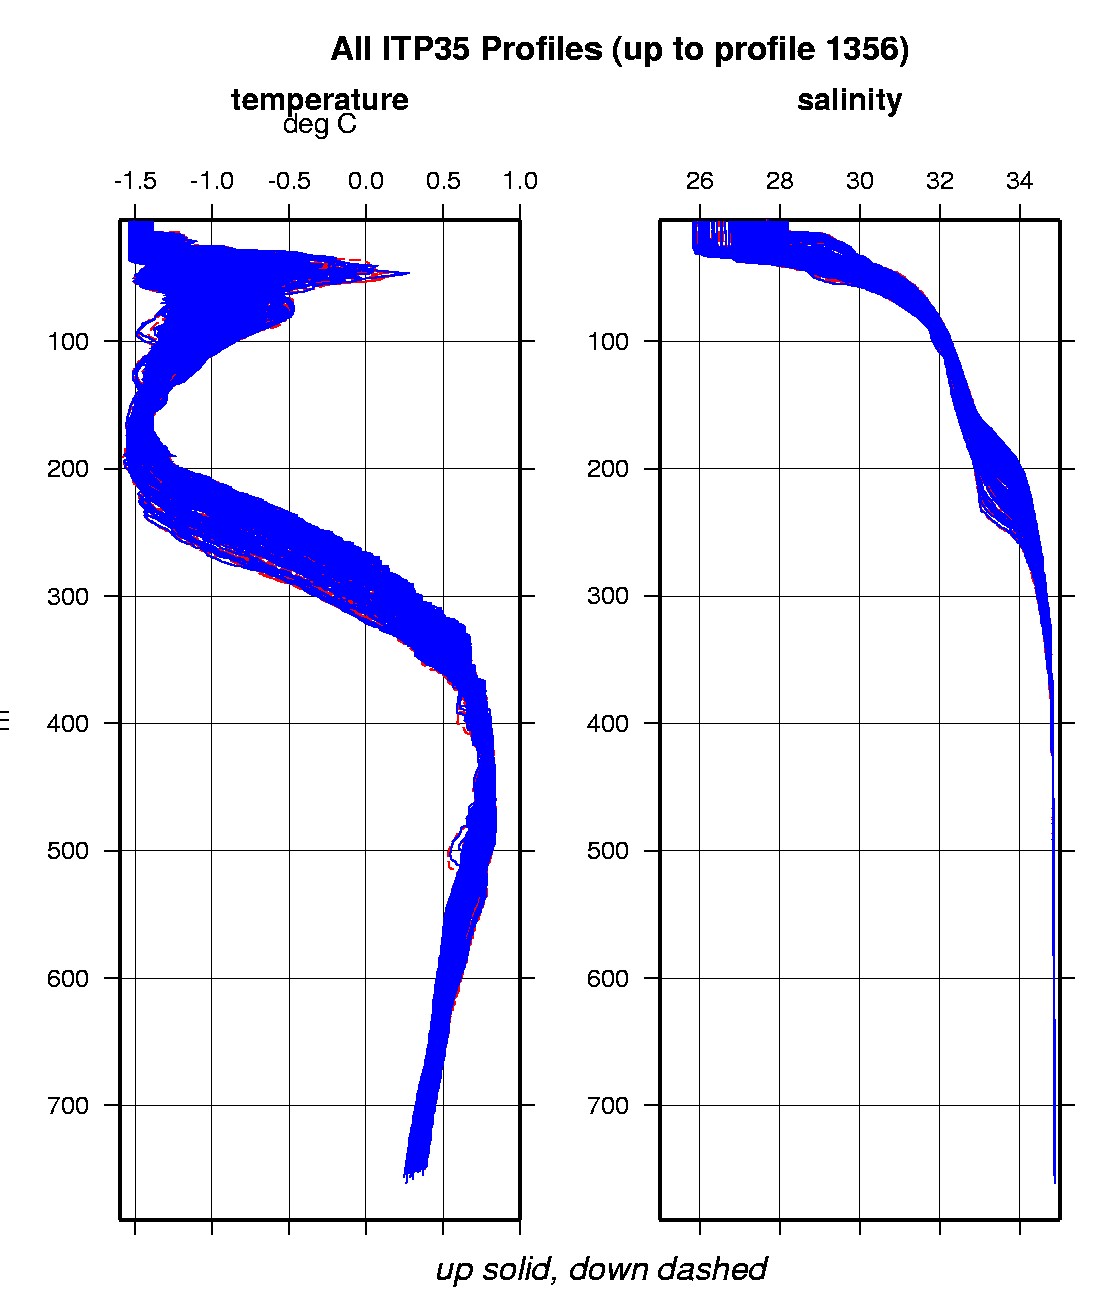
The plots to the right are of the final, calibrated, edited data (as opposed to the raw data presented on the active instrument pages).
See the Data Products tab to the left for descriptions of the three levels (I, II, III) of data processing and to access all data.
References:
Thwaites, F. T., R. Krishfield, M.-L. Timmermans, J. M. Toole, and A. J. Williams 3rd, 2011. Flux Measurements from an Ice-Tethered Profiler: First Look. Proceedings, Oceans 2011-Santander Spain, 6-9 June 2011, IEEE/OES.
Cole, S., M.-L. Timmermans, J. Toole, R. Krishfield, F. Thwaites, 2014. Ekman veering, internal waves, and turbulence observed under Arctic sea-ice. Journal of Physical Oceanography, Vol. 44, doi:10.1175/JPO-D-12-0191.1.
ITP 35 data can also be found at the links below:
Level II hourly buoy location data in ASCII format: itp35rawlocs.dat
Level III 1-Hz processed profile data in MATLAB format: itp35cormat.tar.Z and itp35cormat.zip
Level III 1-db bin-averaged processed profile data in MATLAB format: itp35final.mat
Level III 1-db bin-averaged processed profile data in ASCII format: itp35final.tar.Z and itp35final.zip
