ITP48 Data Processing
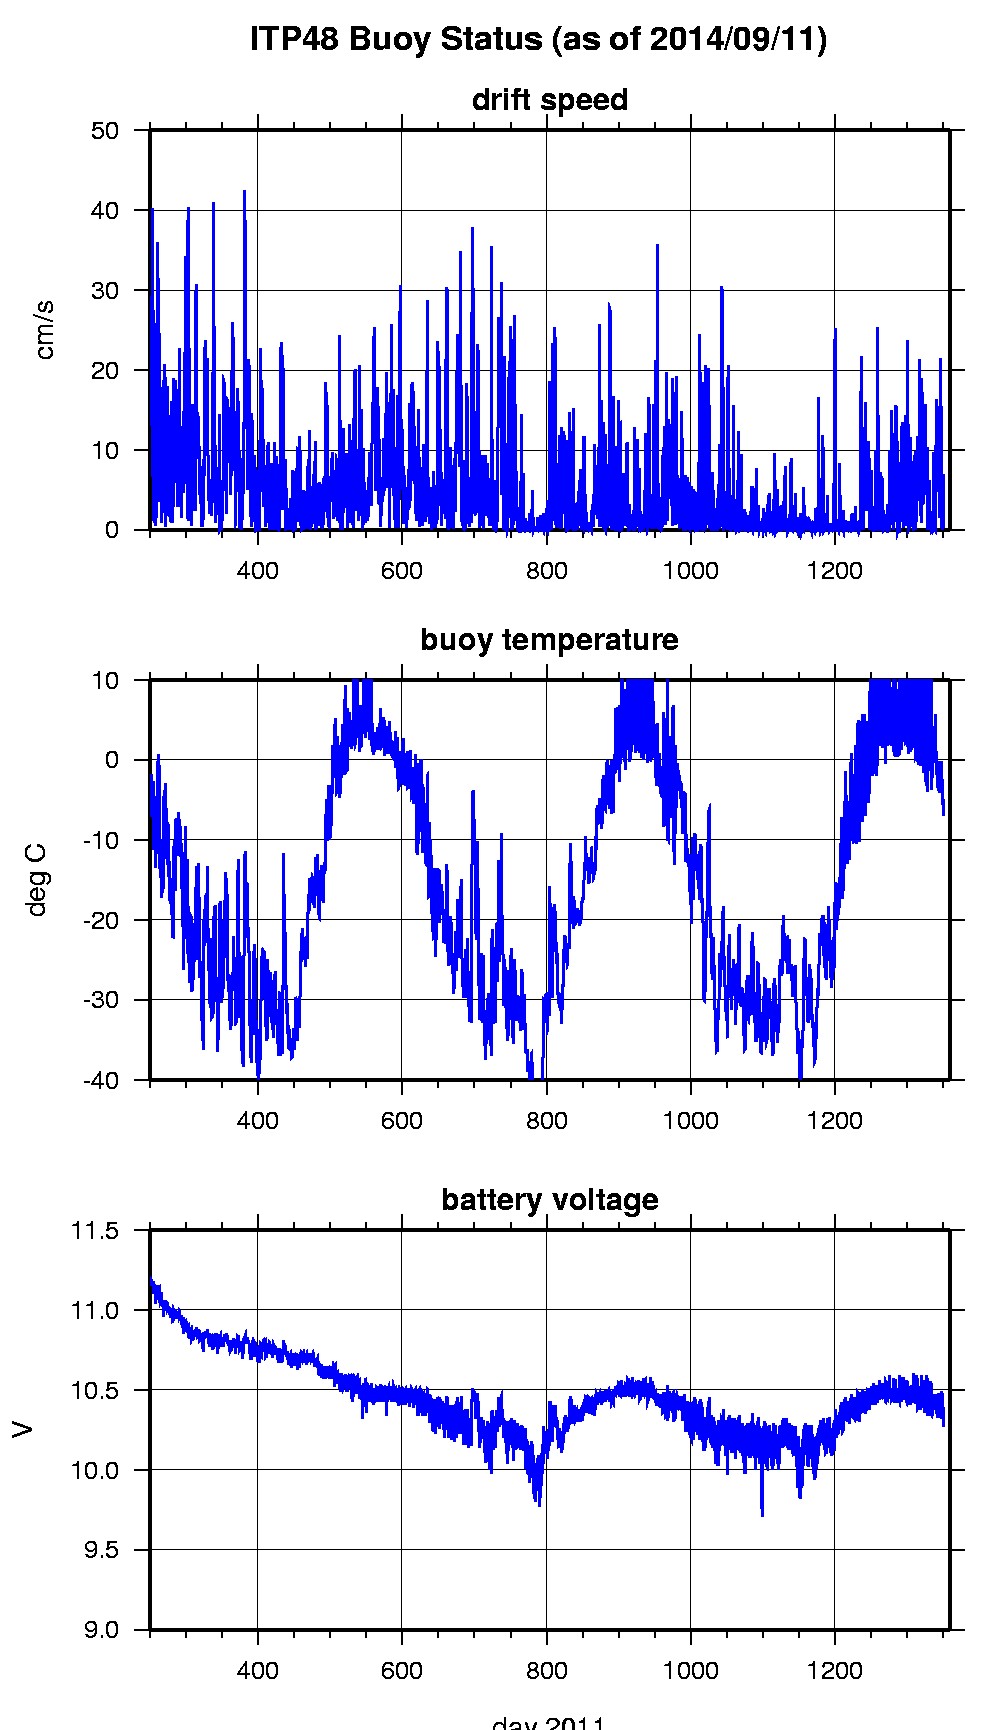
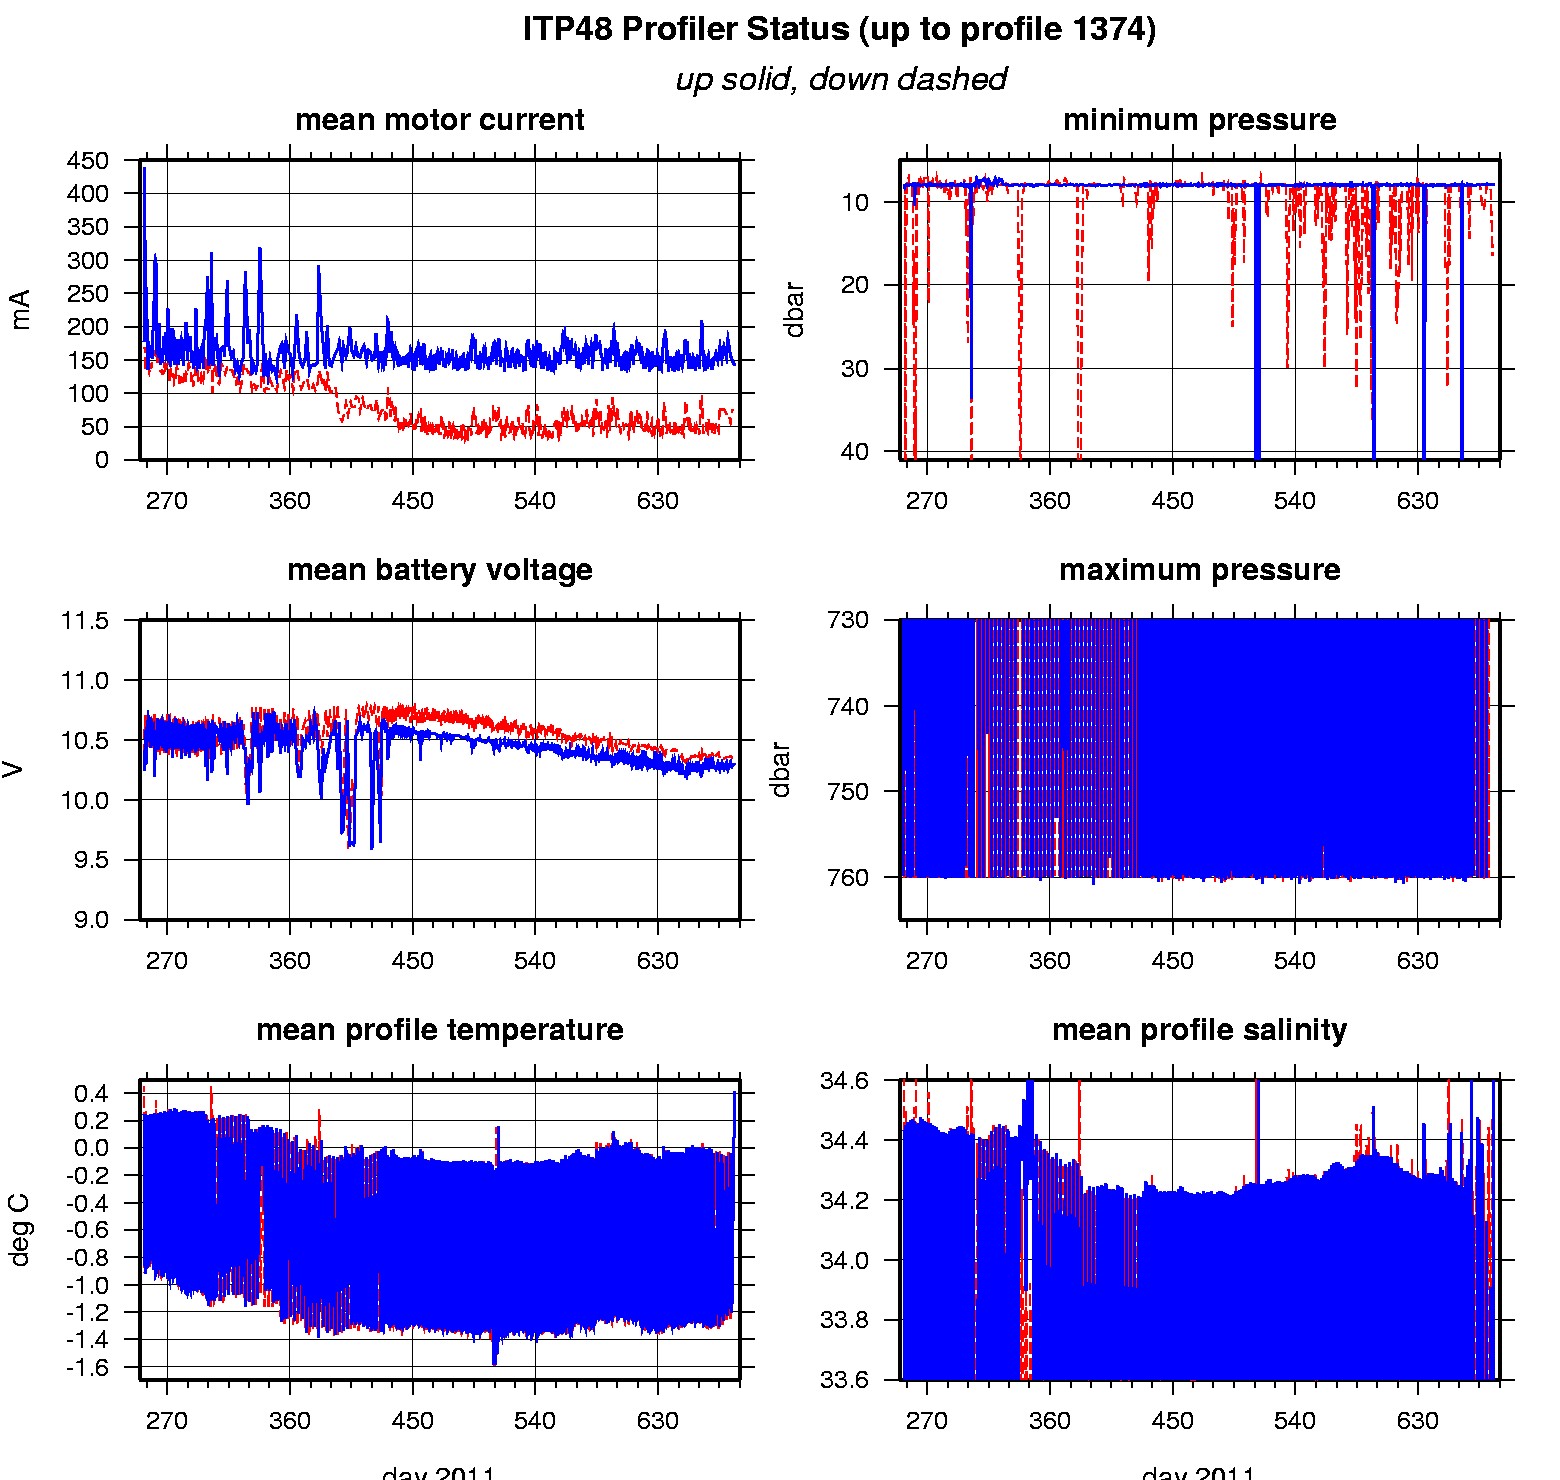
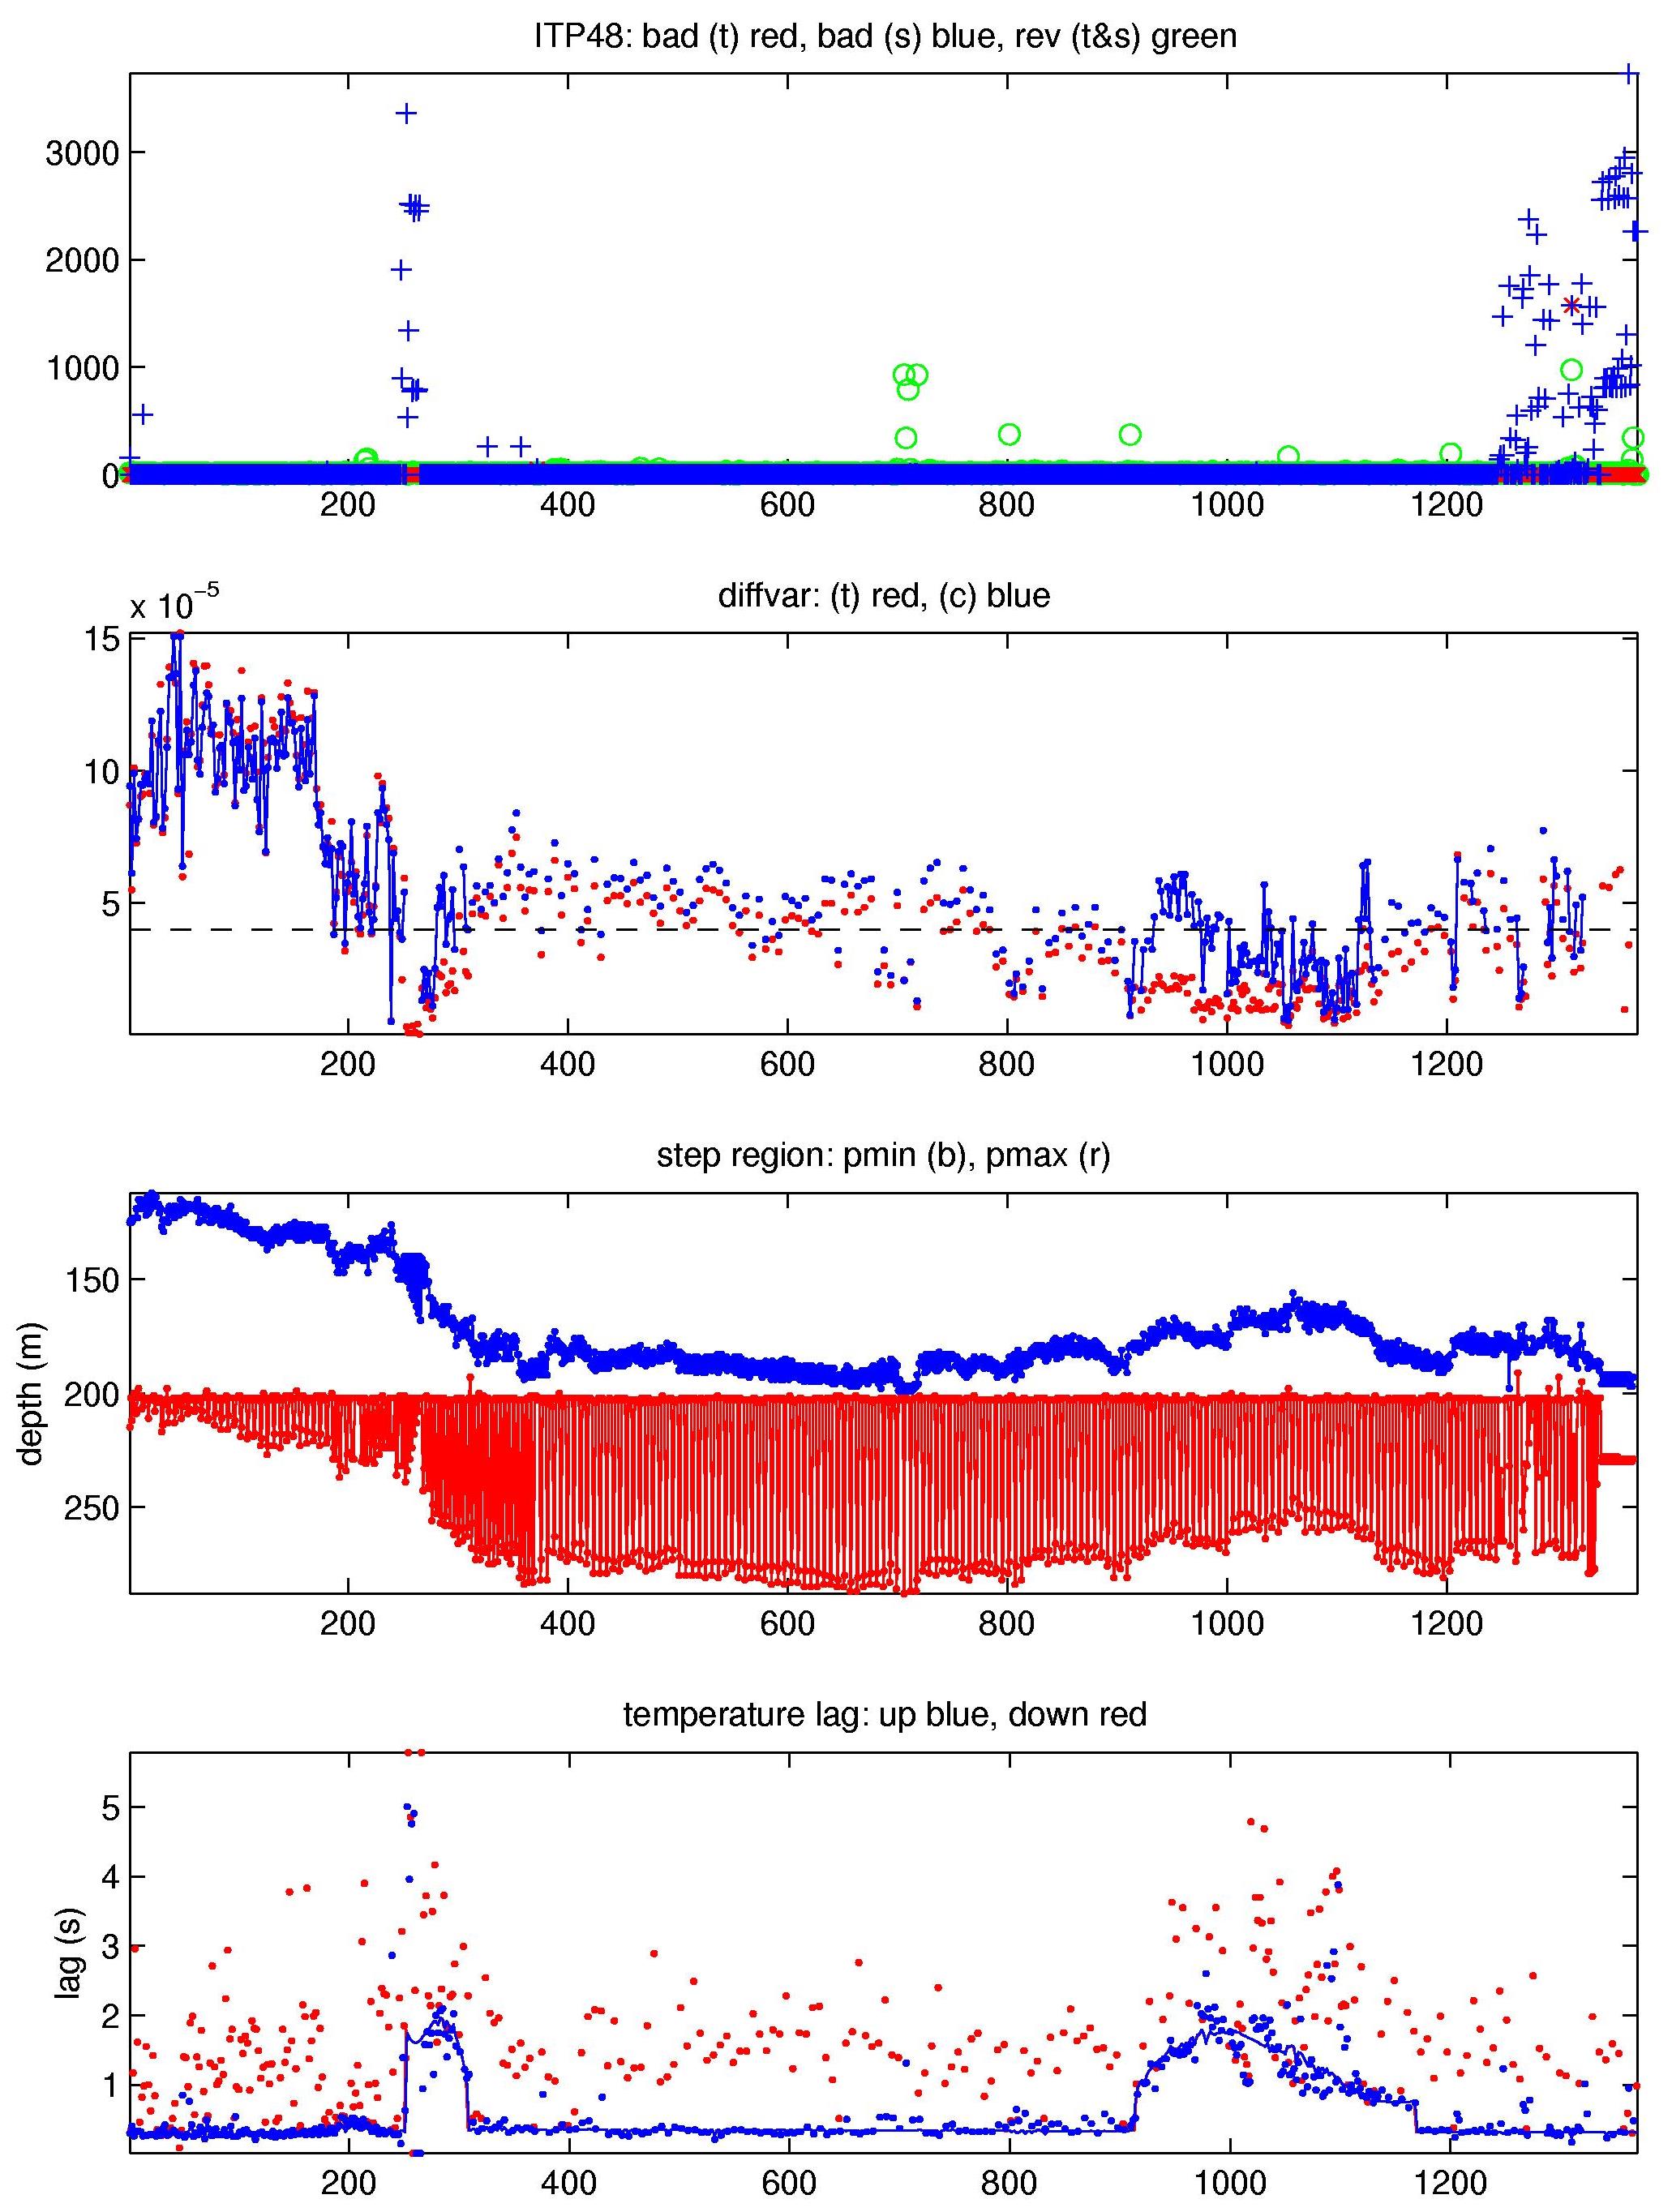
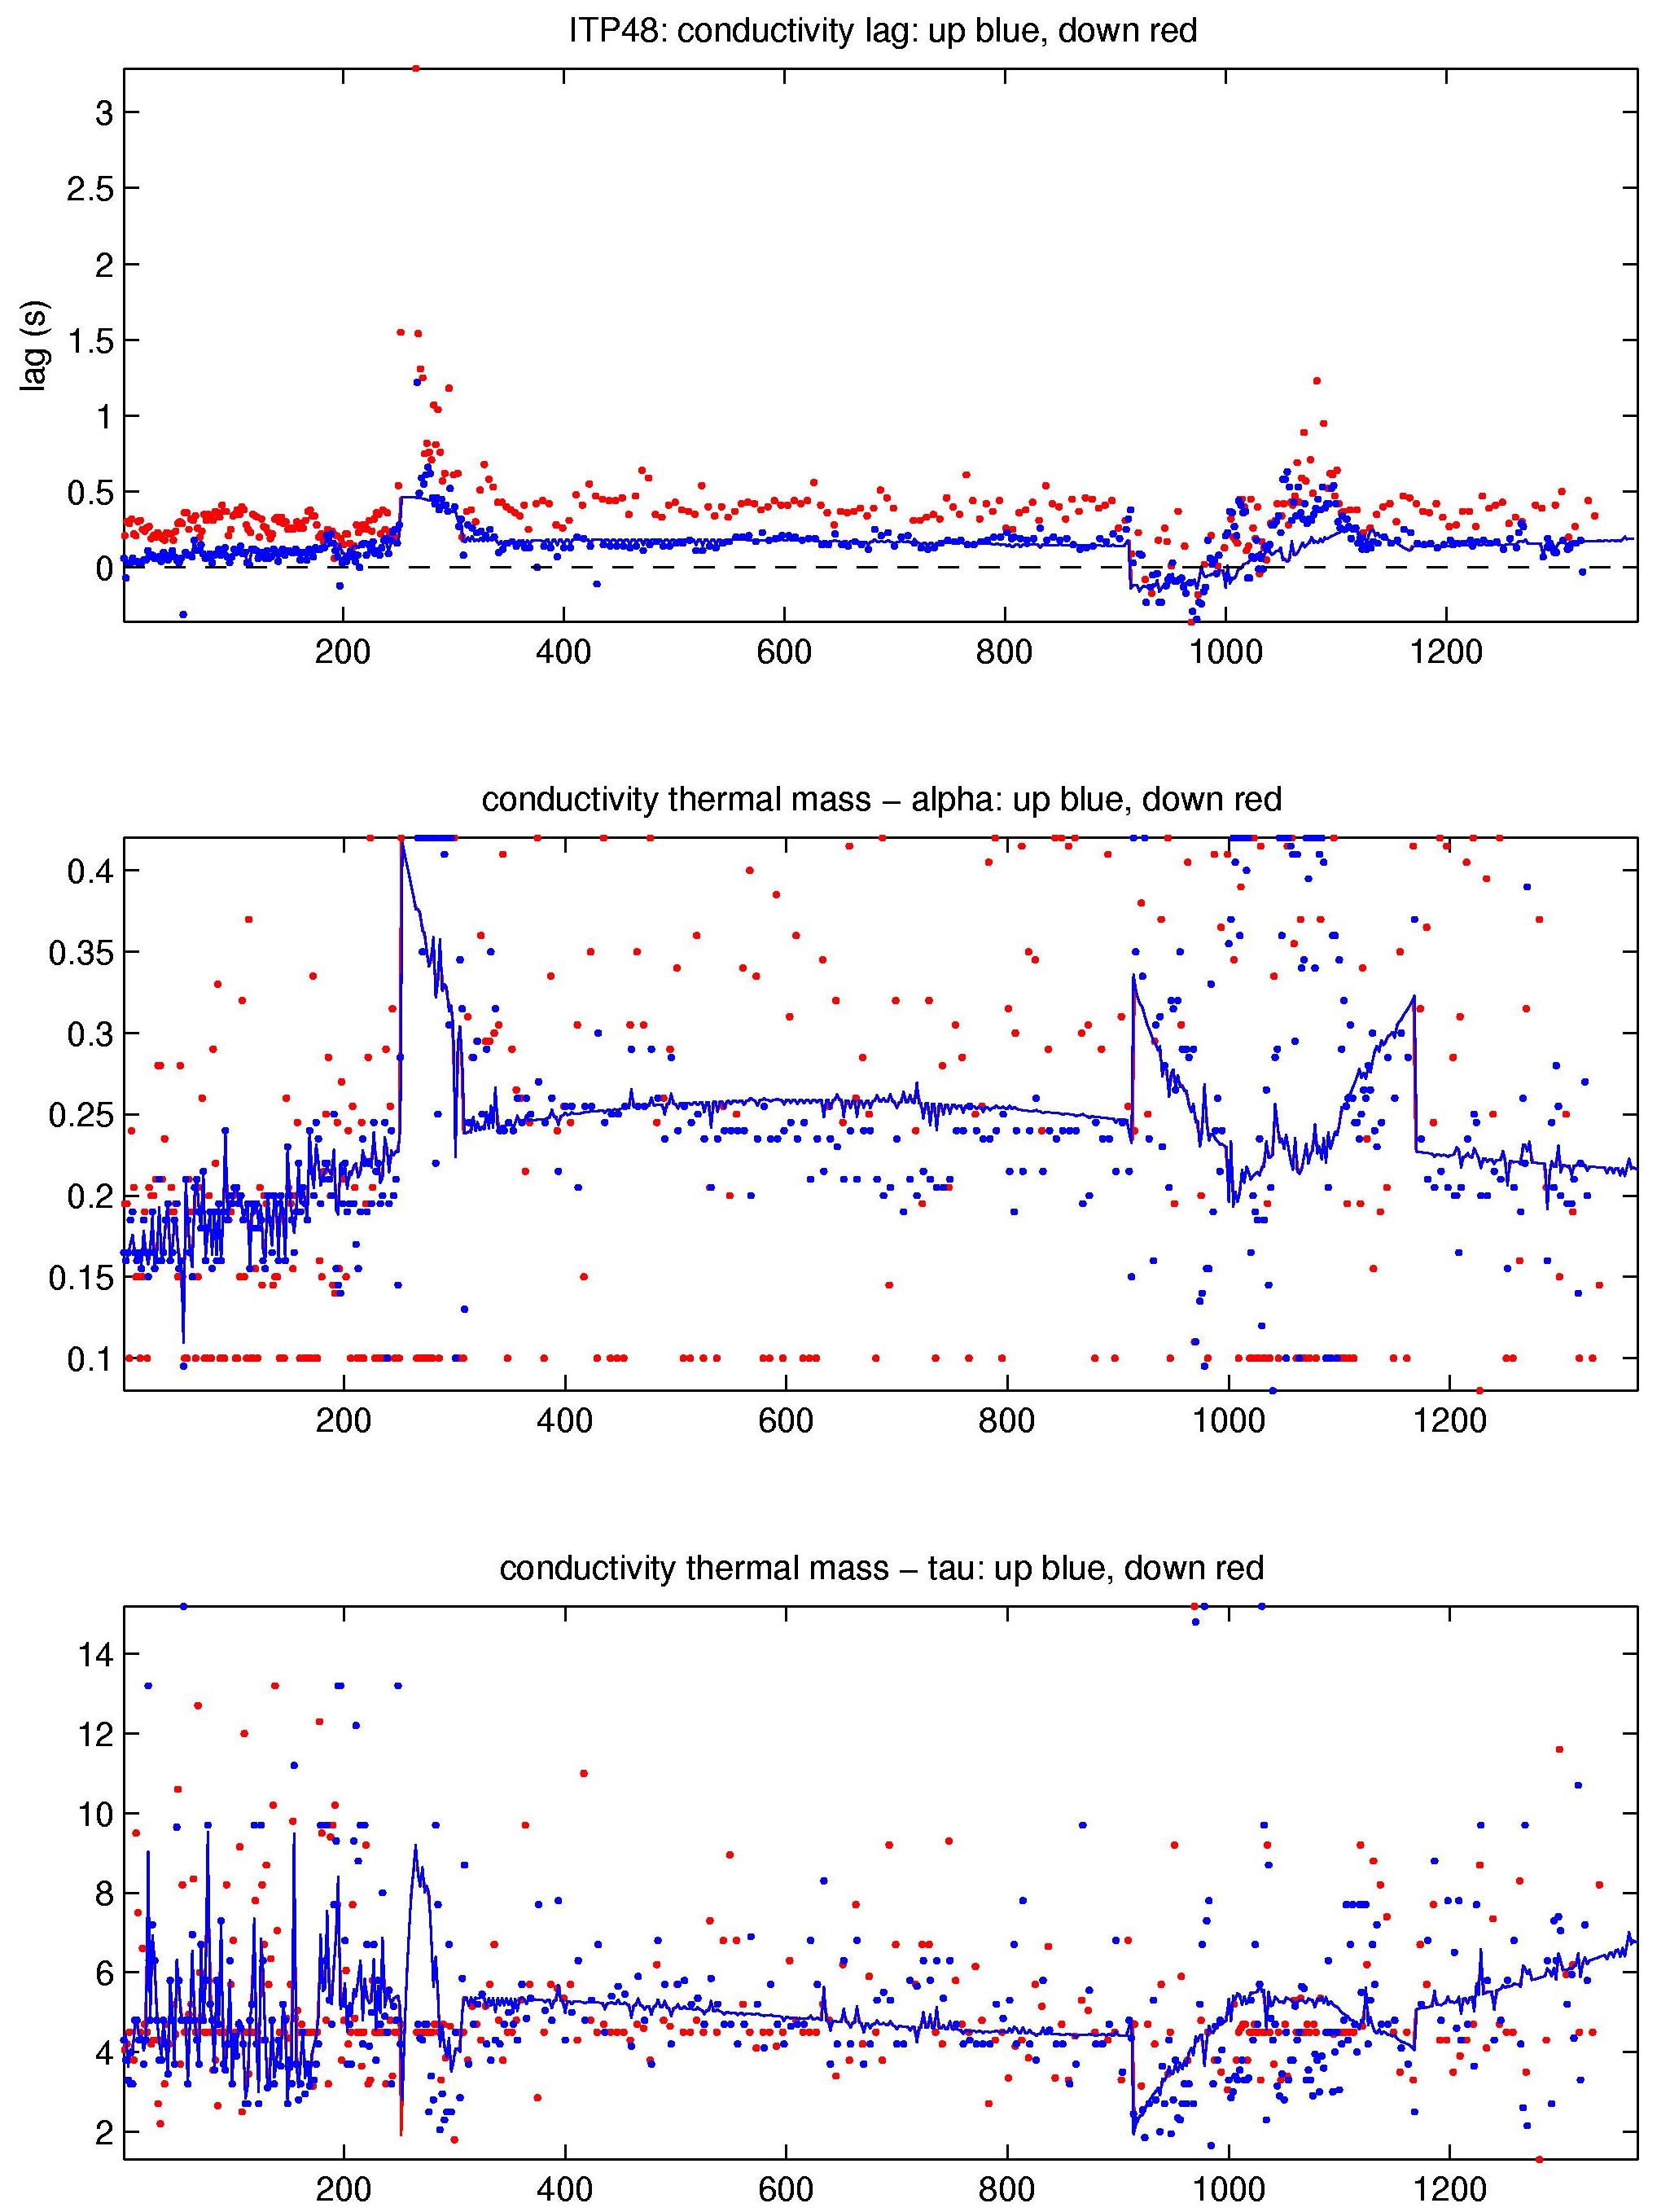
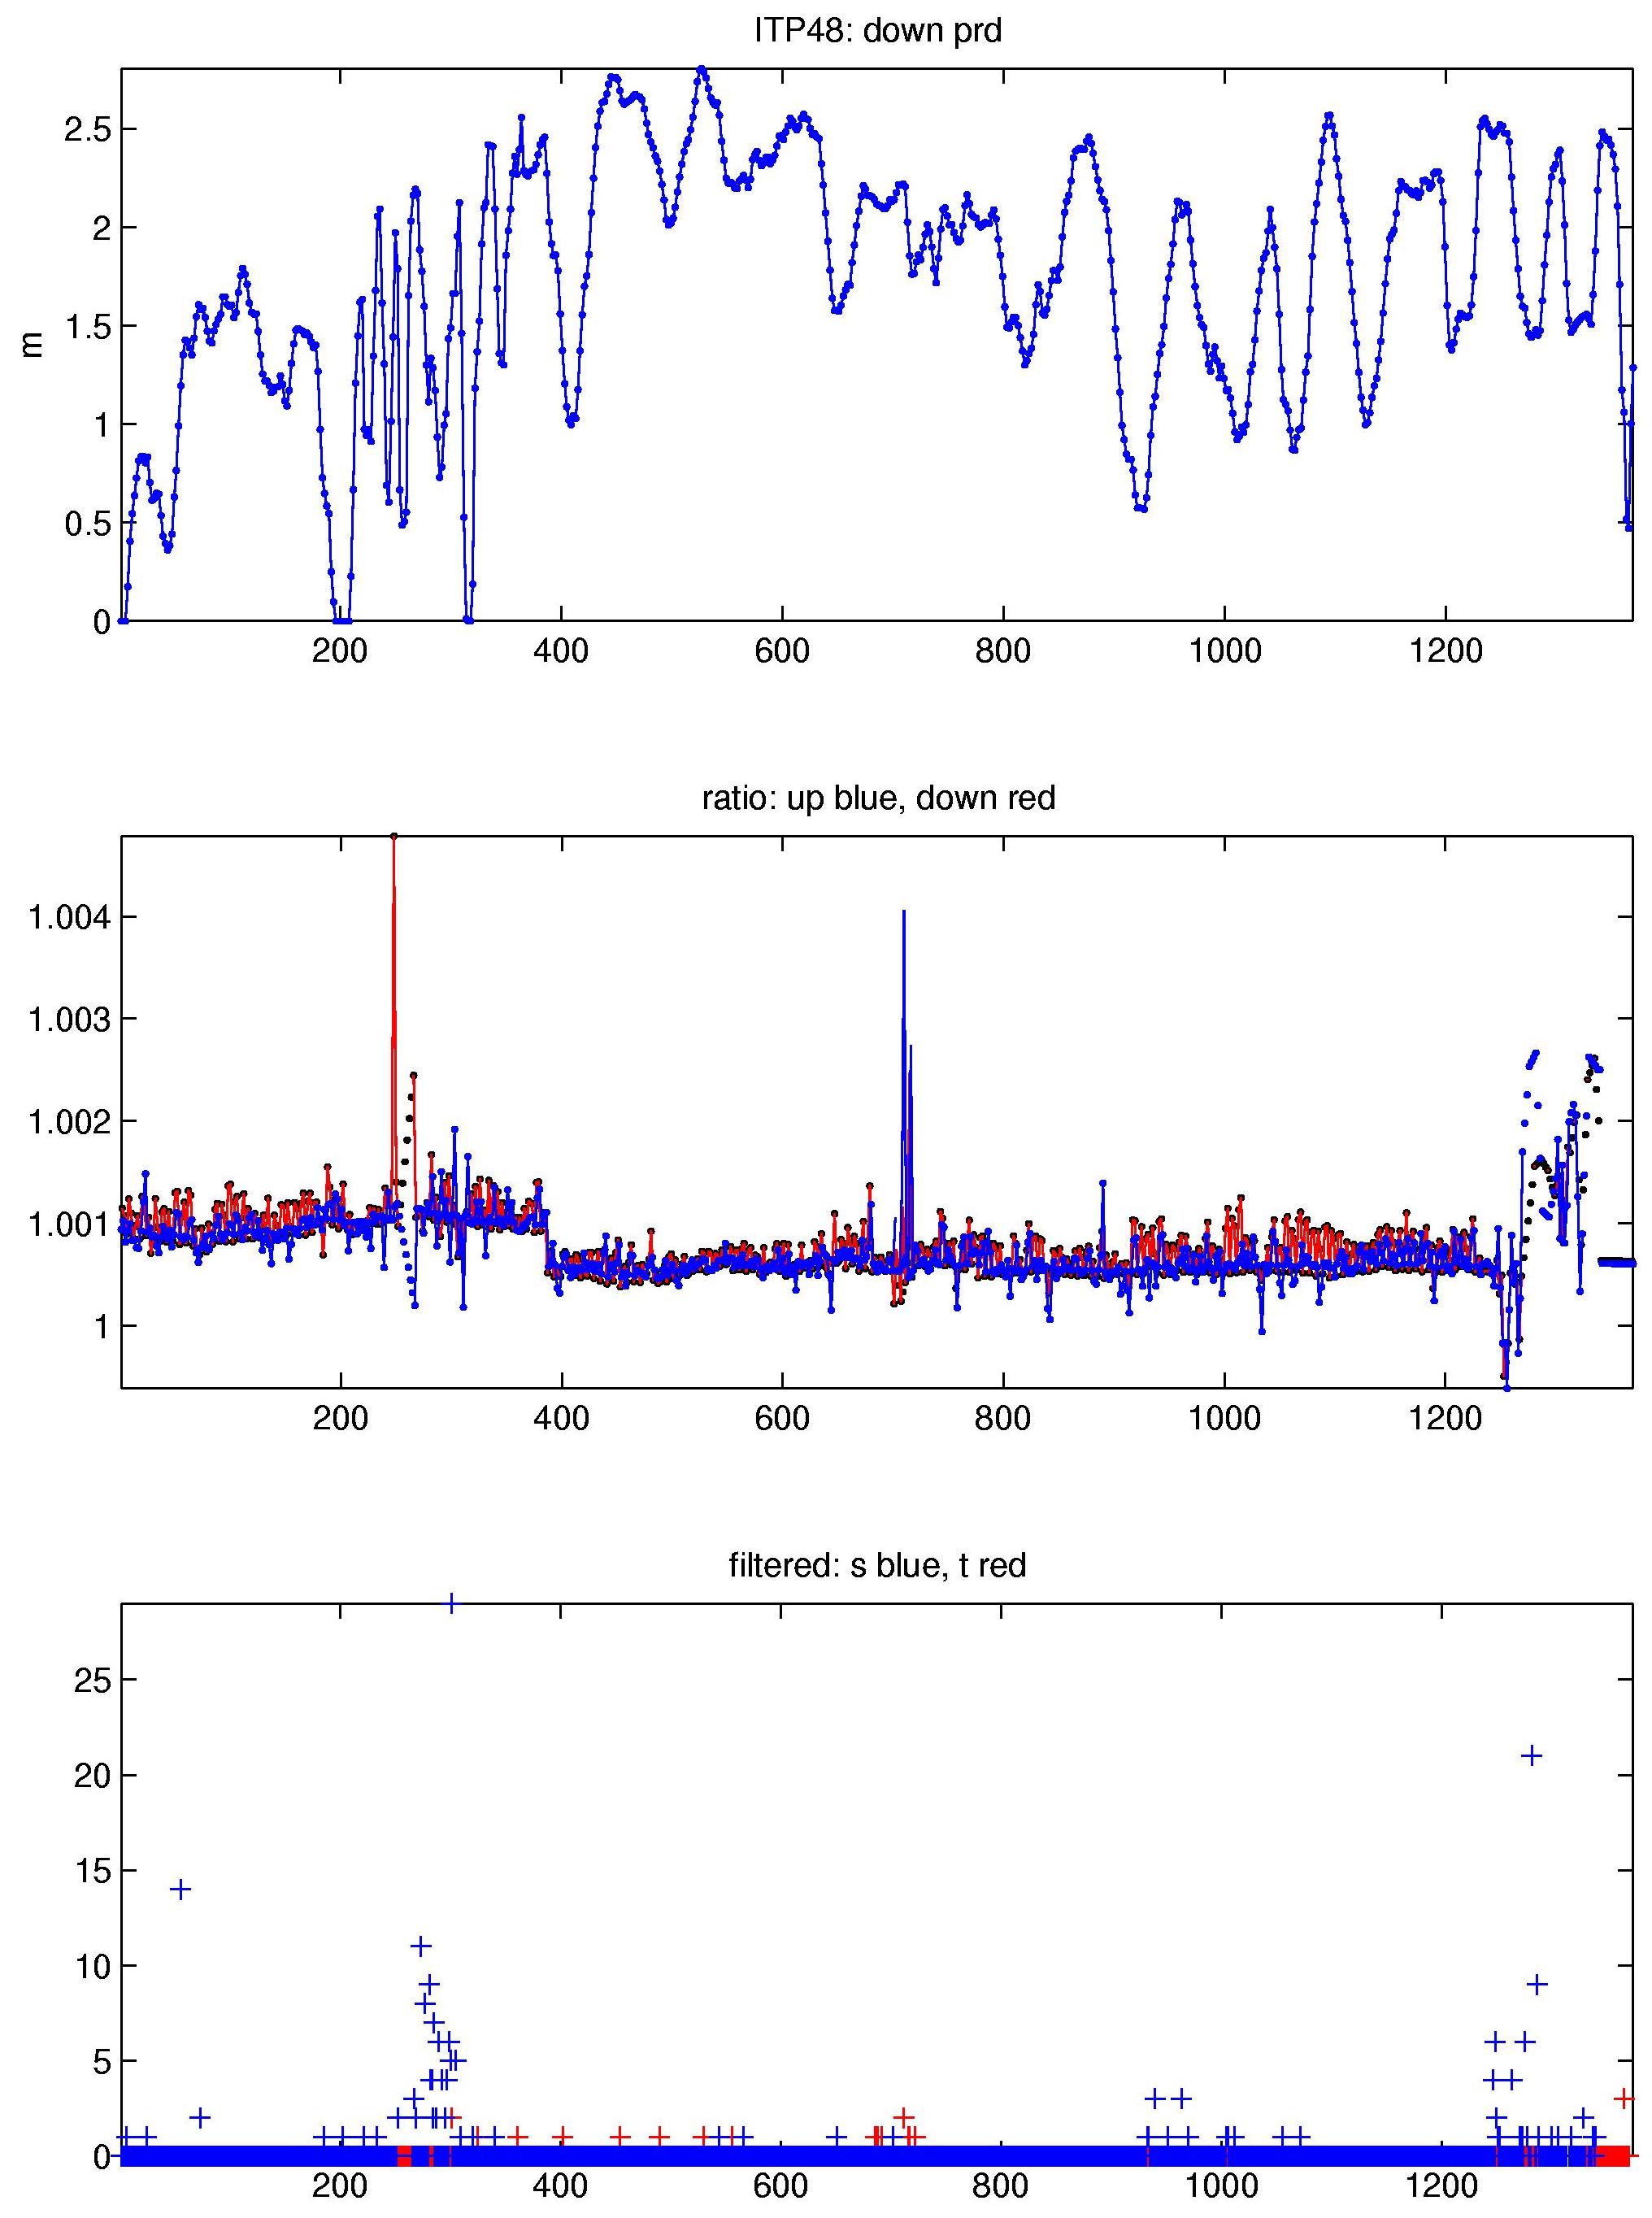
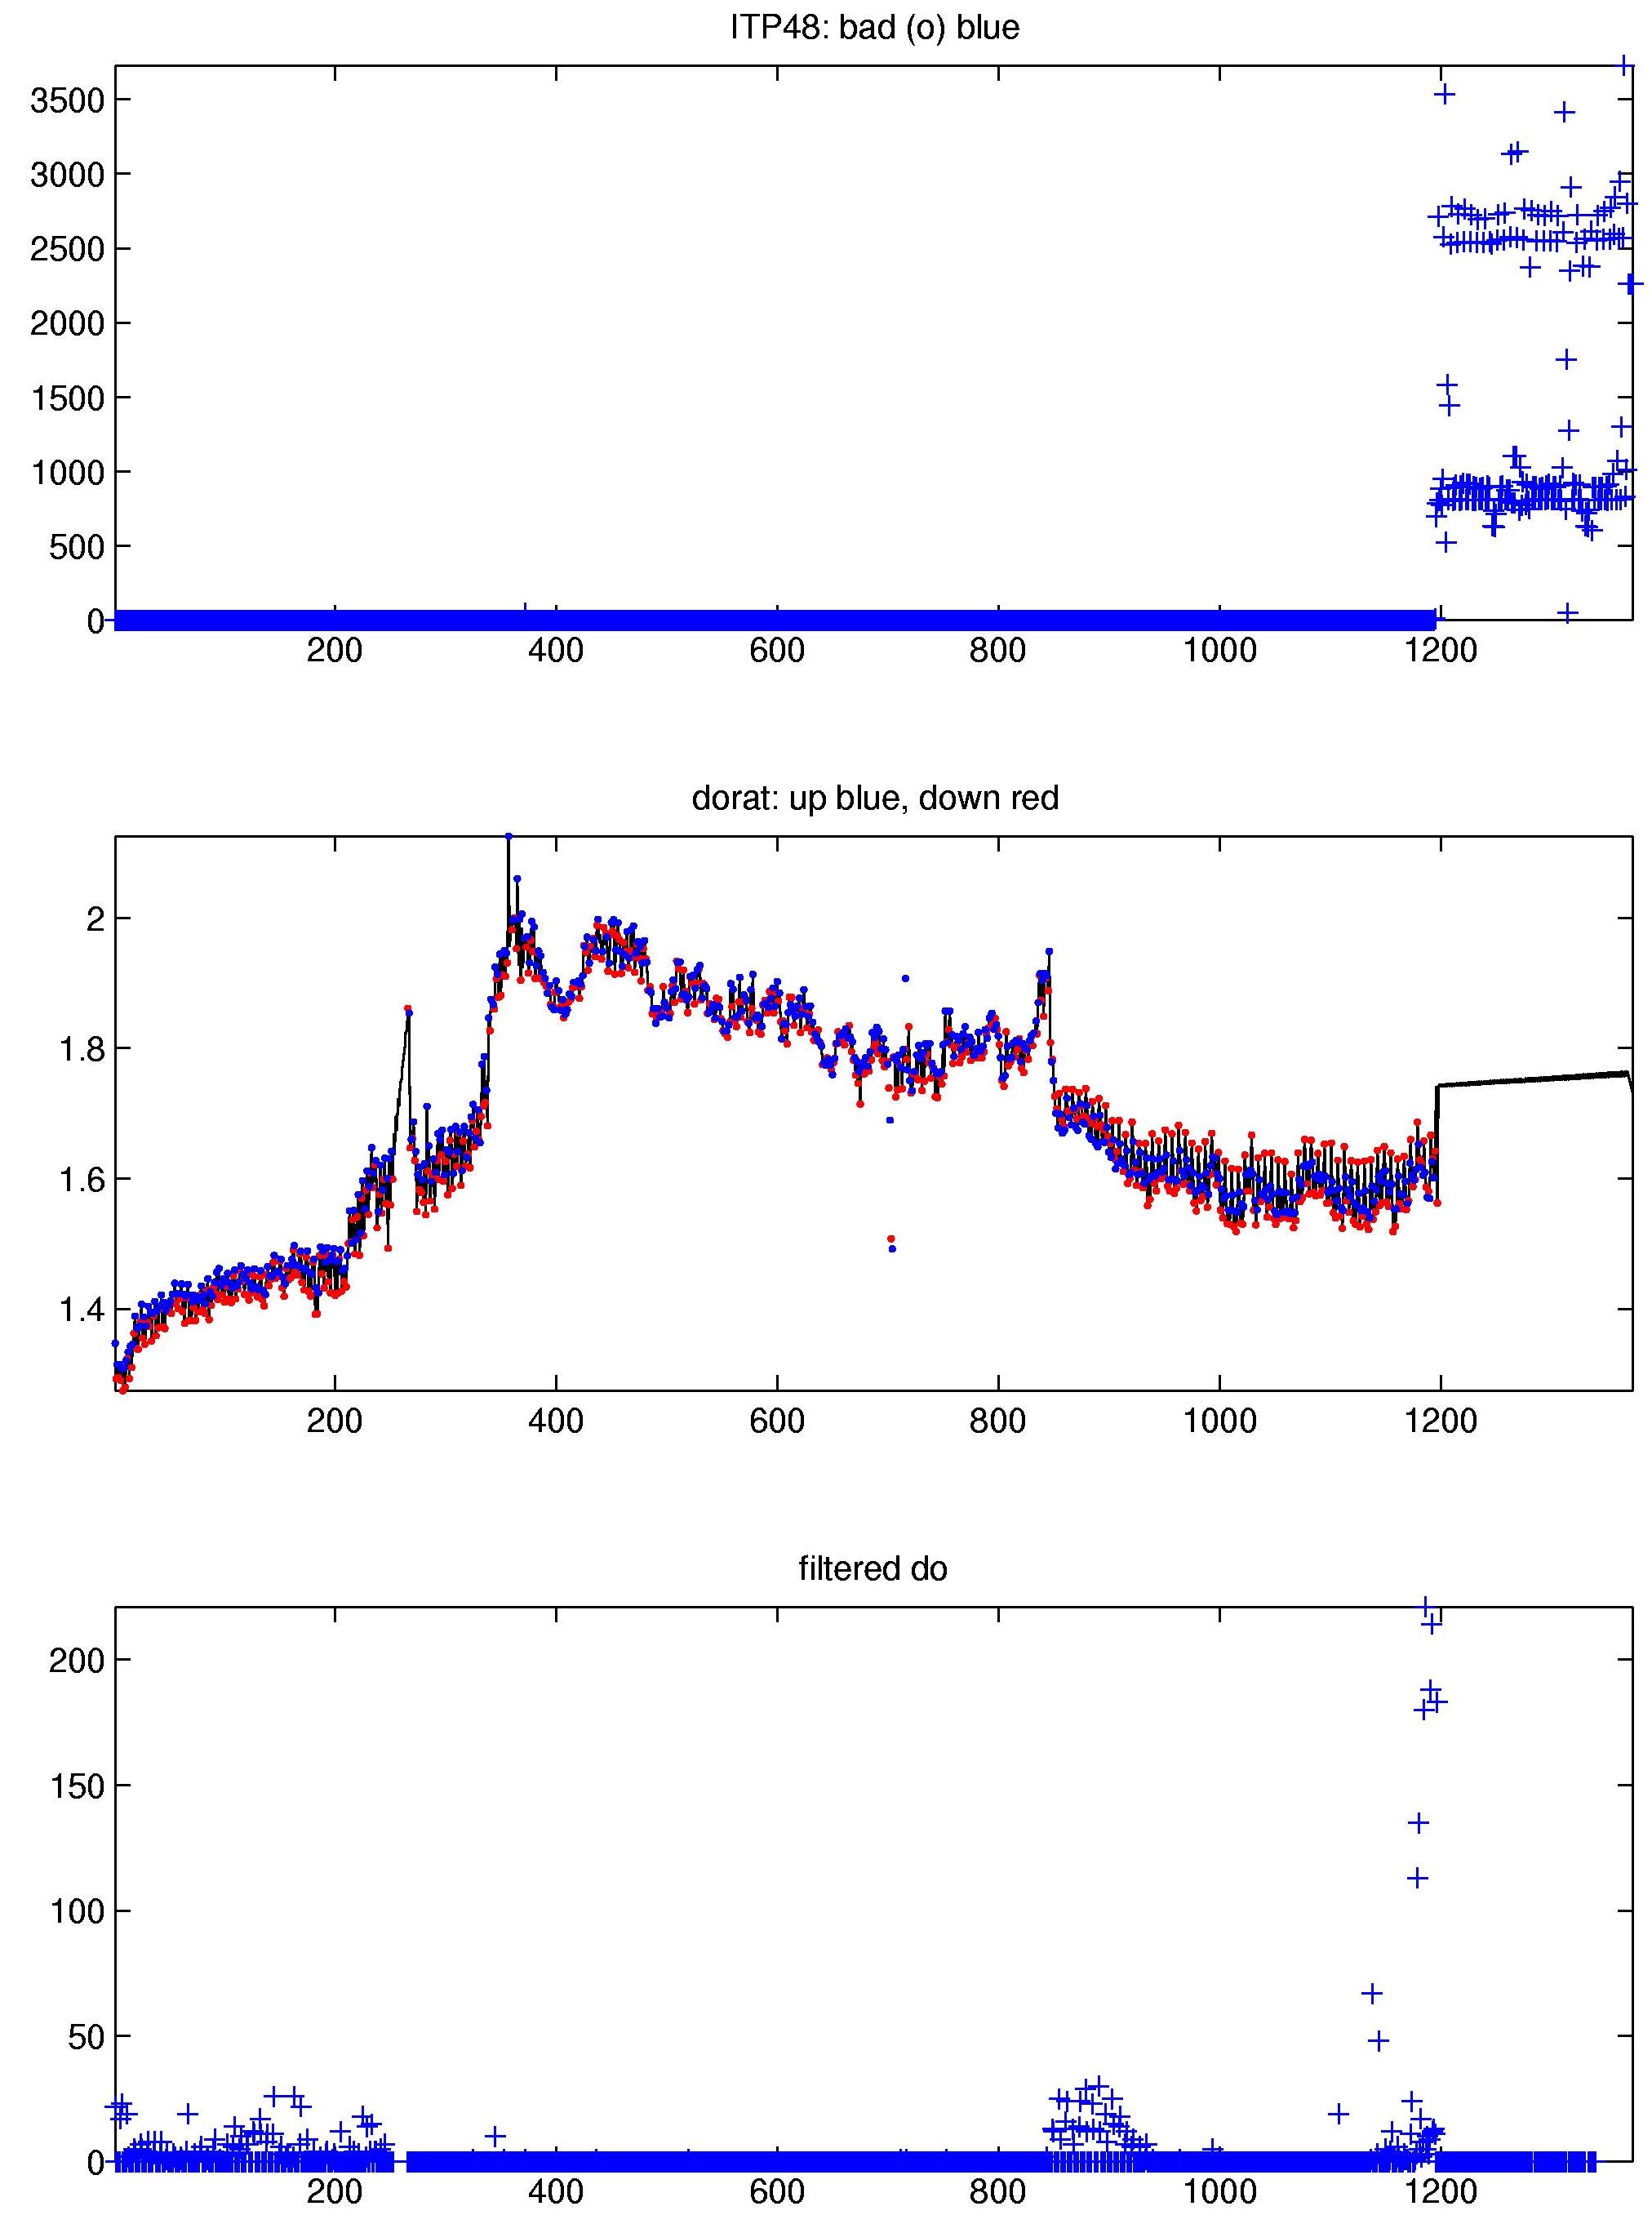
The 1374 profiles that were recovered from the ITP were processed according to the procedures described in the ITP Updated Data Processing Procedures. The processing parameters for are shown in the figures to the right. The biosuite sensor data handling are described in Laney et al., (2014). Buoy drift speeds were almost always less than 30 cm/s while traversing the Arctic Basin so the profiler covered the full extent of nearly every profile that it communicated to the surface package until the very end of the record.
Spikes were found and removed in both the CTD temperature and salinity data, along with some extended deviations, particularly in the salinity data. It is likely that not all of the deviations in the dataset have been removed, as it is sometimes difficult to distinguish slight outliers. Thermohaline staircases were present during the time series, enabling lag correction estimates. Generally, the lags were in typical ranges over most of the time series except between profiles 252 to 307, and 914 to 1168 where likely fouling or icing of the sensors resulted in mostly longer response times. The lags were mostly correctable so that there was little hysteresis in T-S plots between up and down profiles throughout the halocline and in the potential conductivity (rat) corrections. The potential conductivity corrections were mostly constant at one level until profile 386, then reduced to a lesser constant level until profile 1250. The quality of the temperature and salinity data that were retained afterwards is questionable.
The spikiness of the temperature and salinity data appear in the dissolved oxygen (DO) data, so those points were also removed. Due to a problem with an internal seal on this generation of DO sensors, there were many occurrences where there were extended deviations which were removed, and the measurements drifted over the record until the sensor finally failed after profile 1197. Corrections were applied to correct the drift (dorat) within reason, but the quality of this product is uncertain.
See the Data Products tab to the left for descriptions of the three levels (I, II, III) of data processing and to access all data.
References:
Laney, S.R., R.A. Krishfield, J.M. Toole, T.R. Hammar, C.J. Ashjian, and M.-L. Timmermans, 2014. Assessing Algal Biomass and Bio-optical Distributions in Perennially Ice-Covered Ocean Ecosystems. Polar Science, Vol. 8, http://dx.doi.org/10.1016/j.polar.2013.12.003.
