ITP37 Data Processing
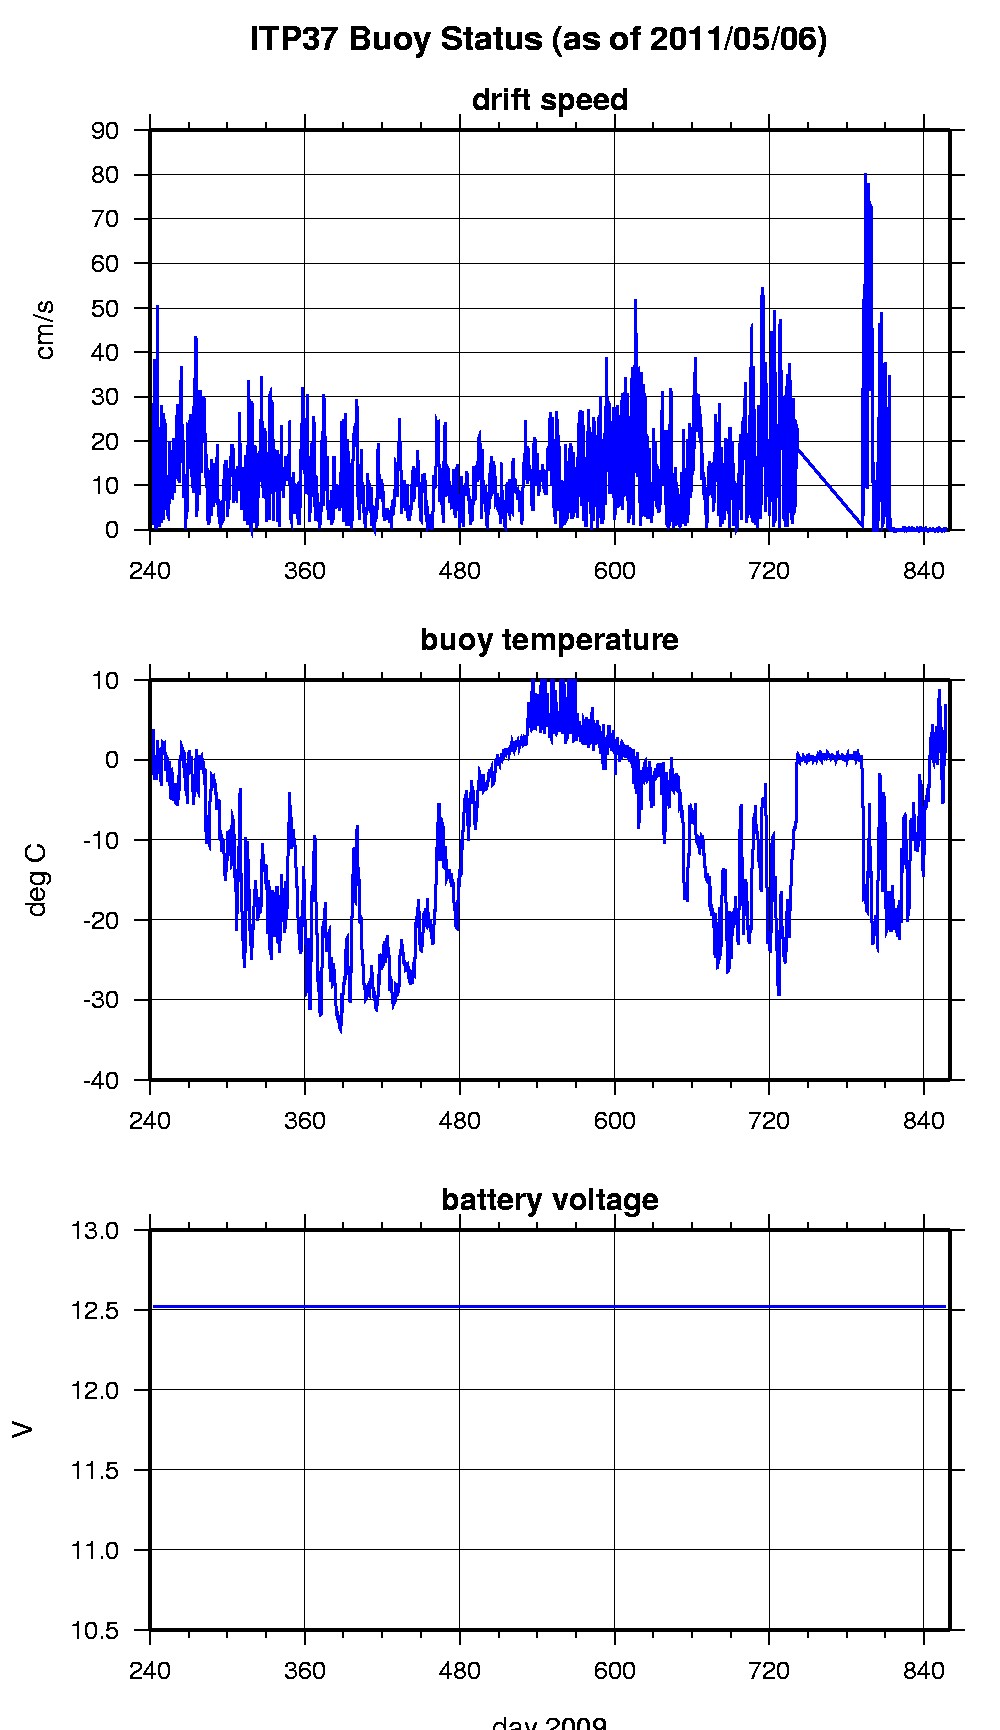
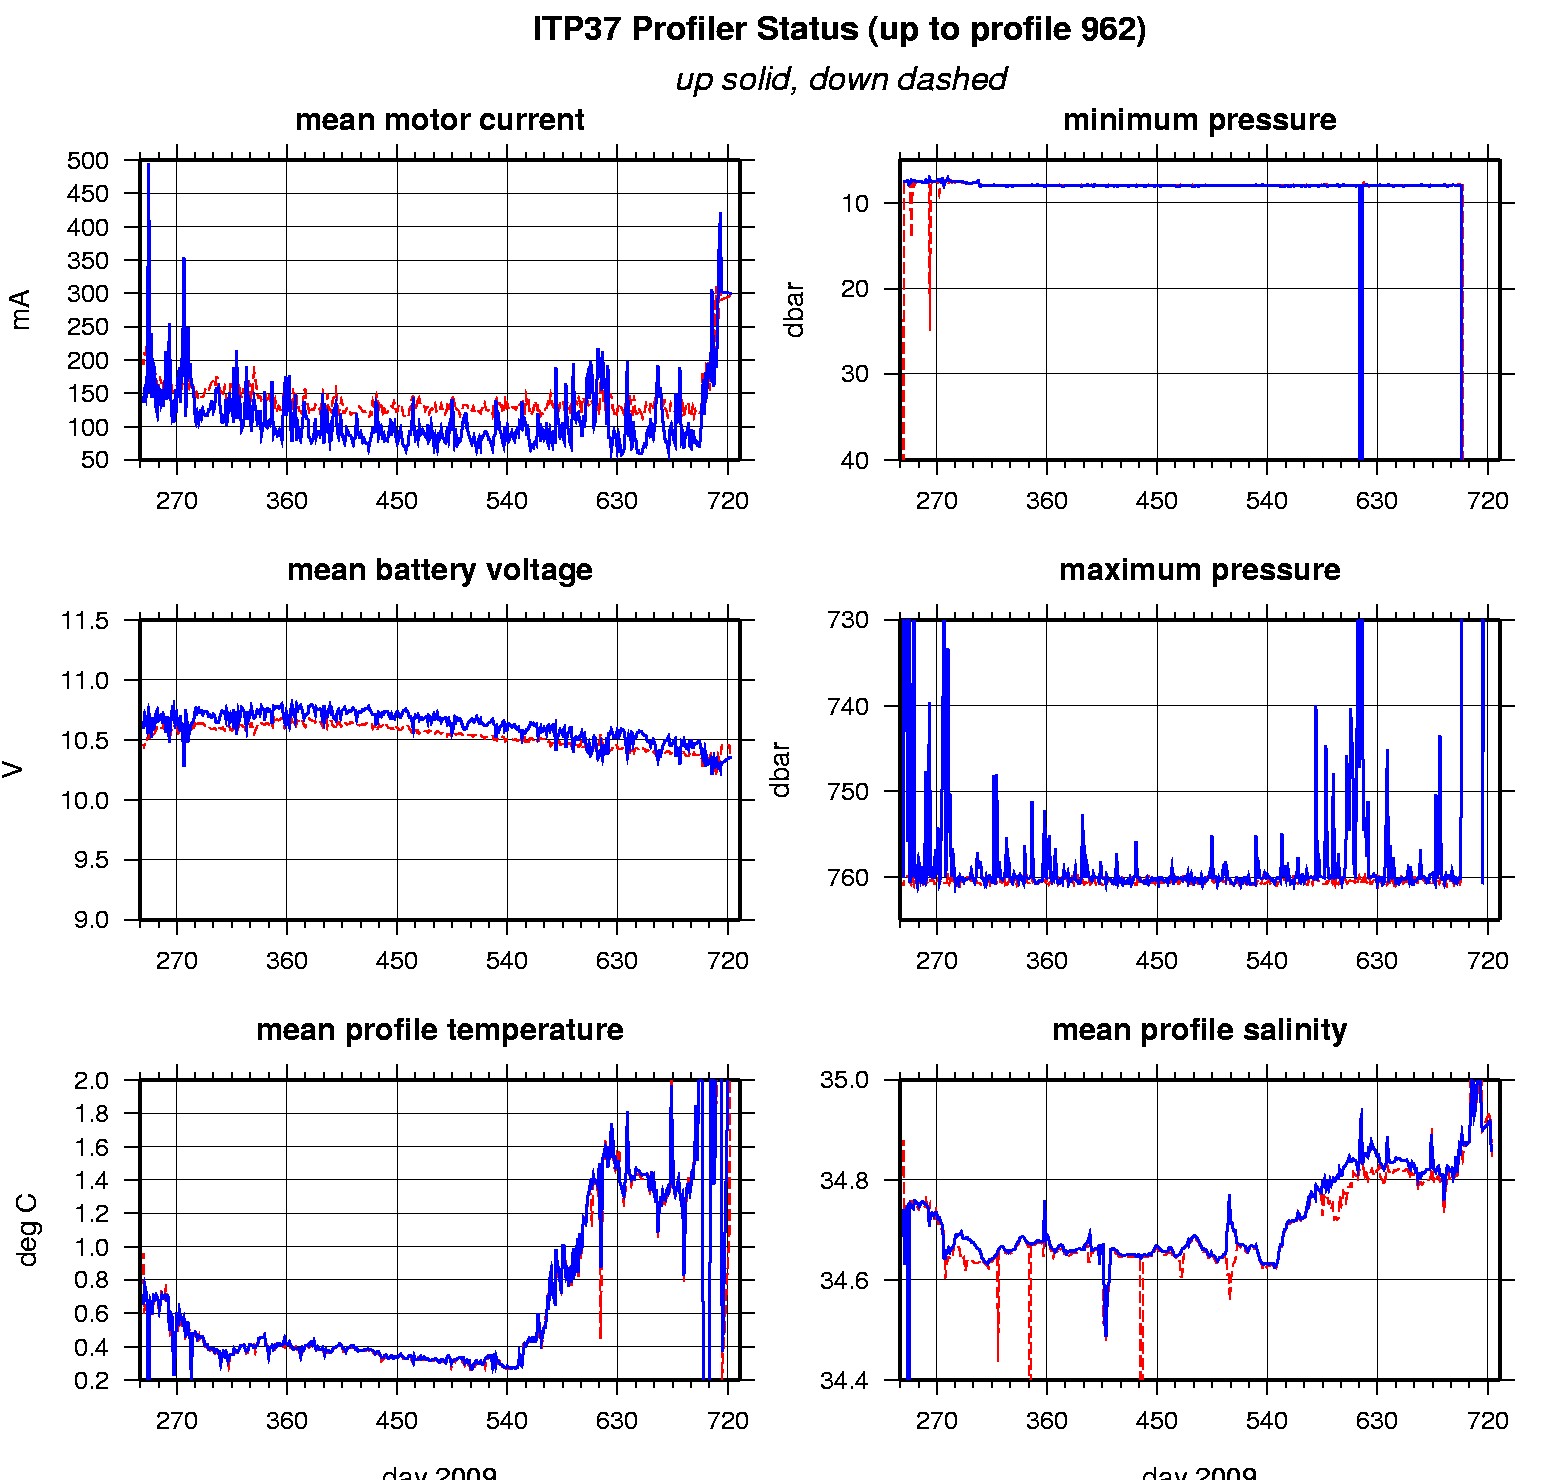
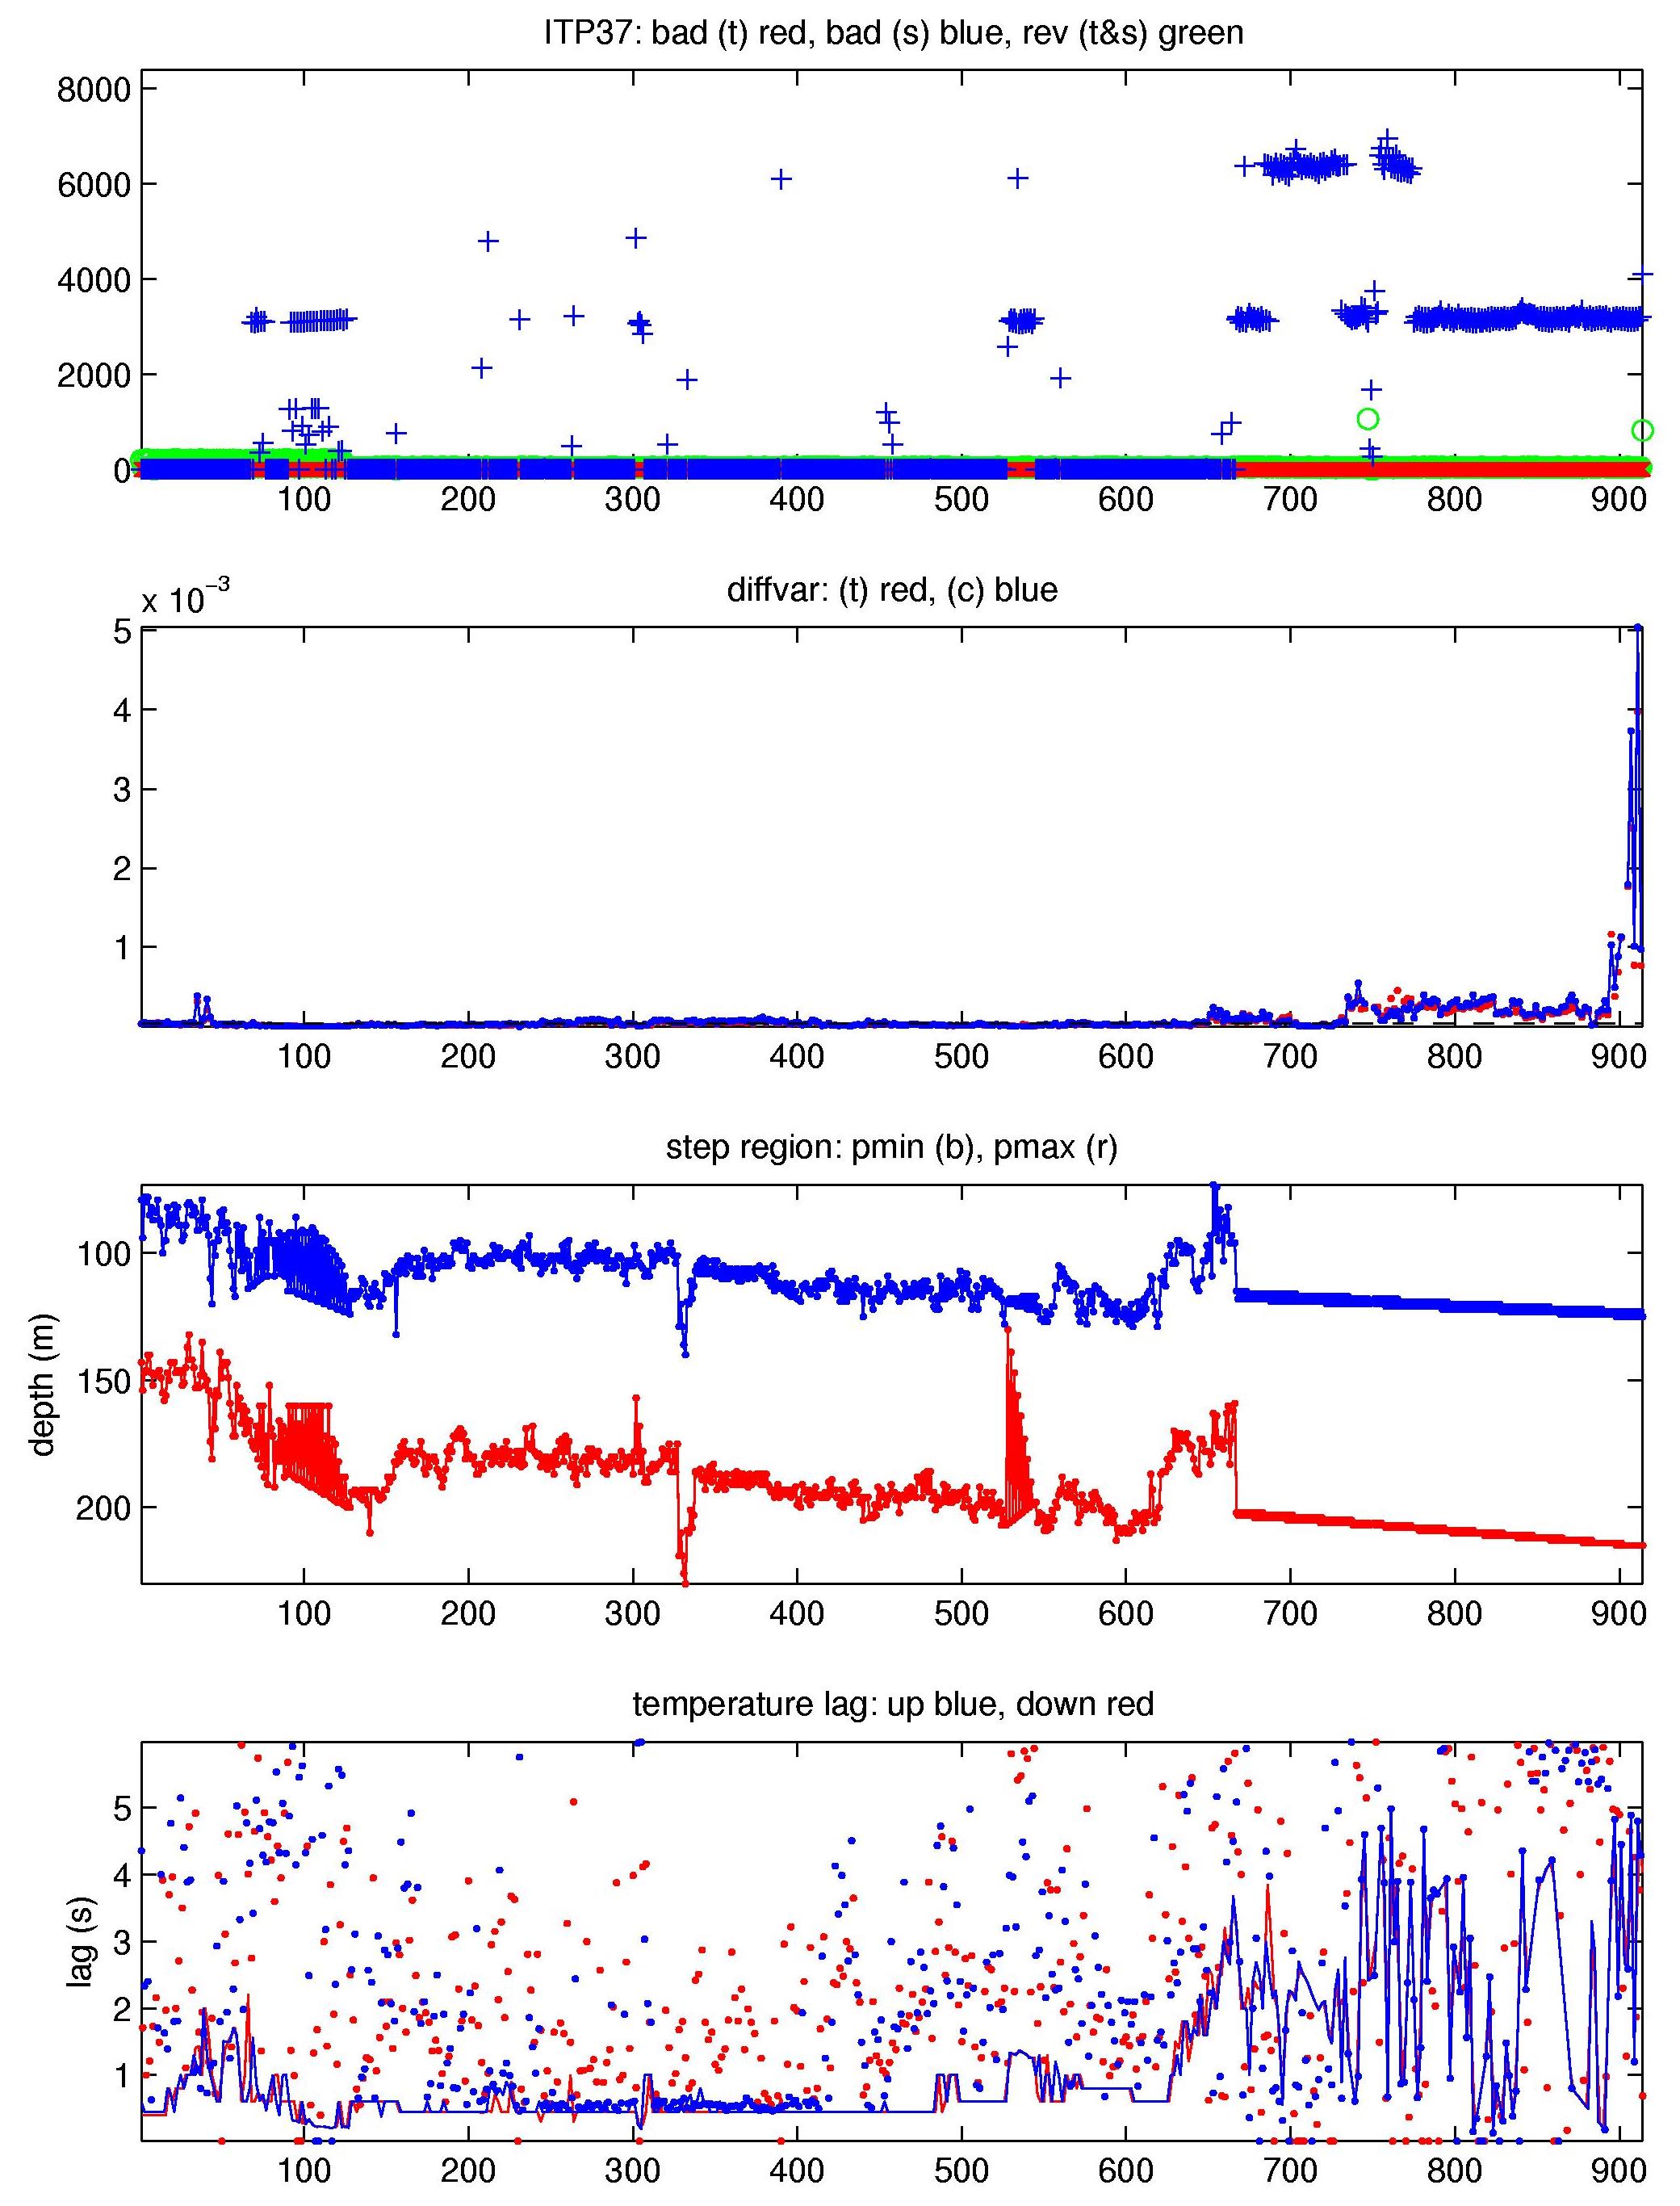
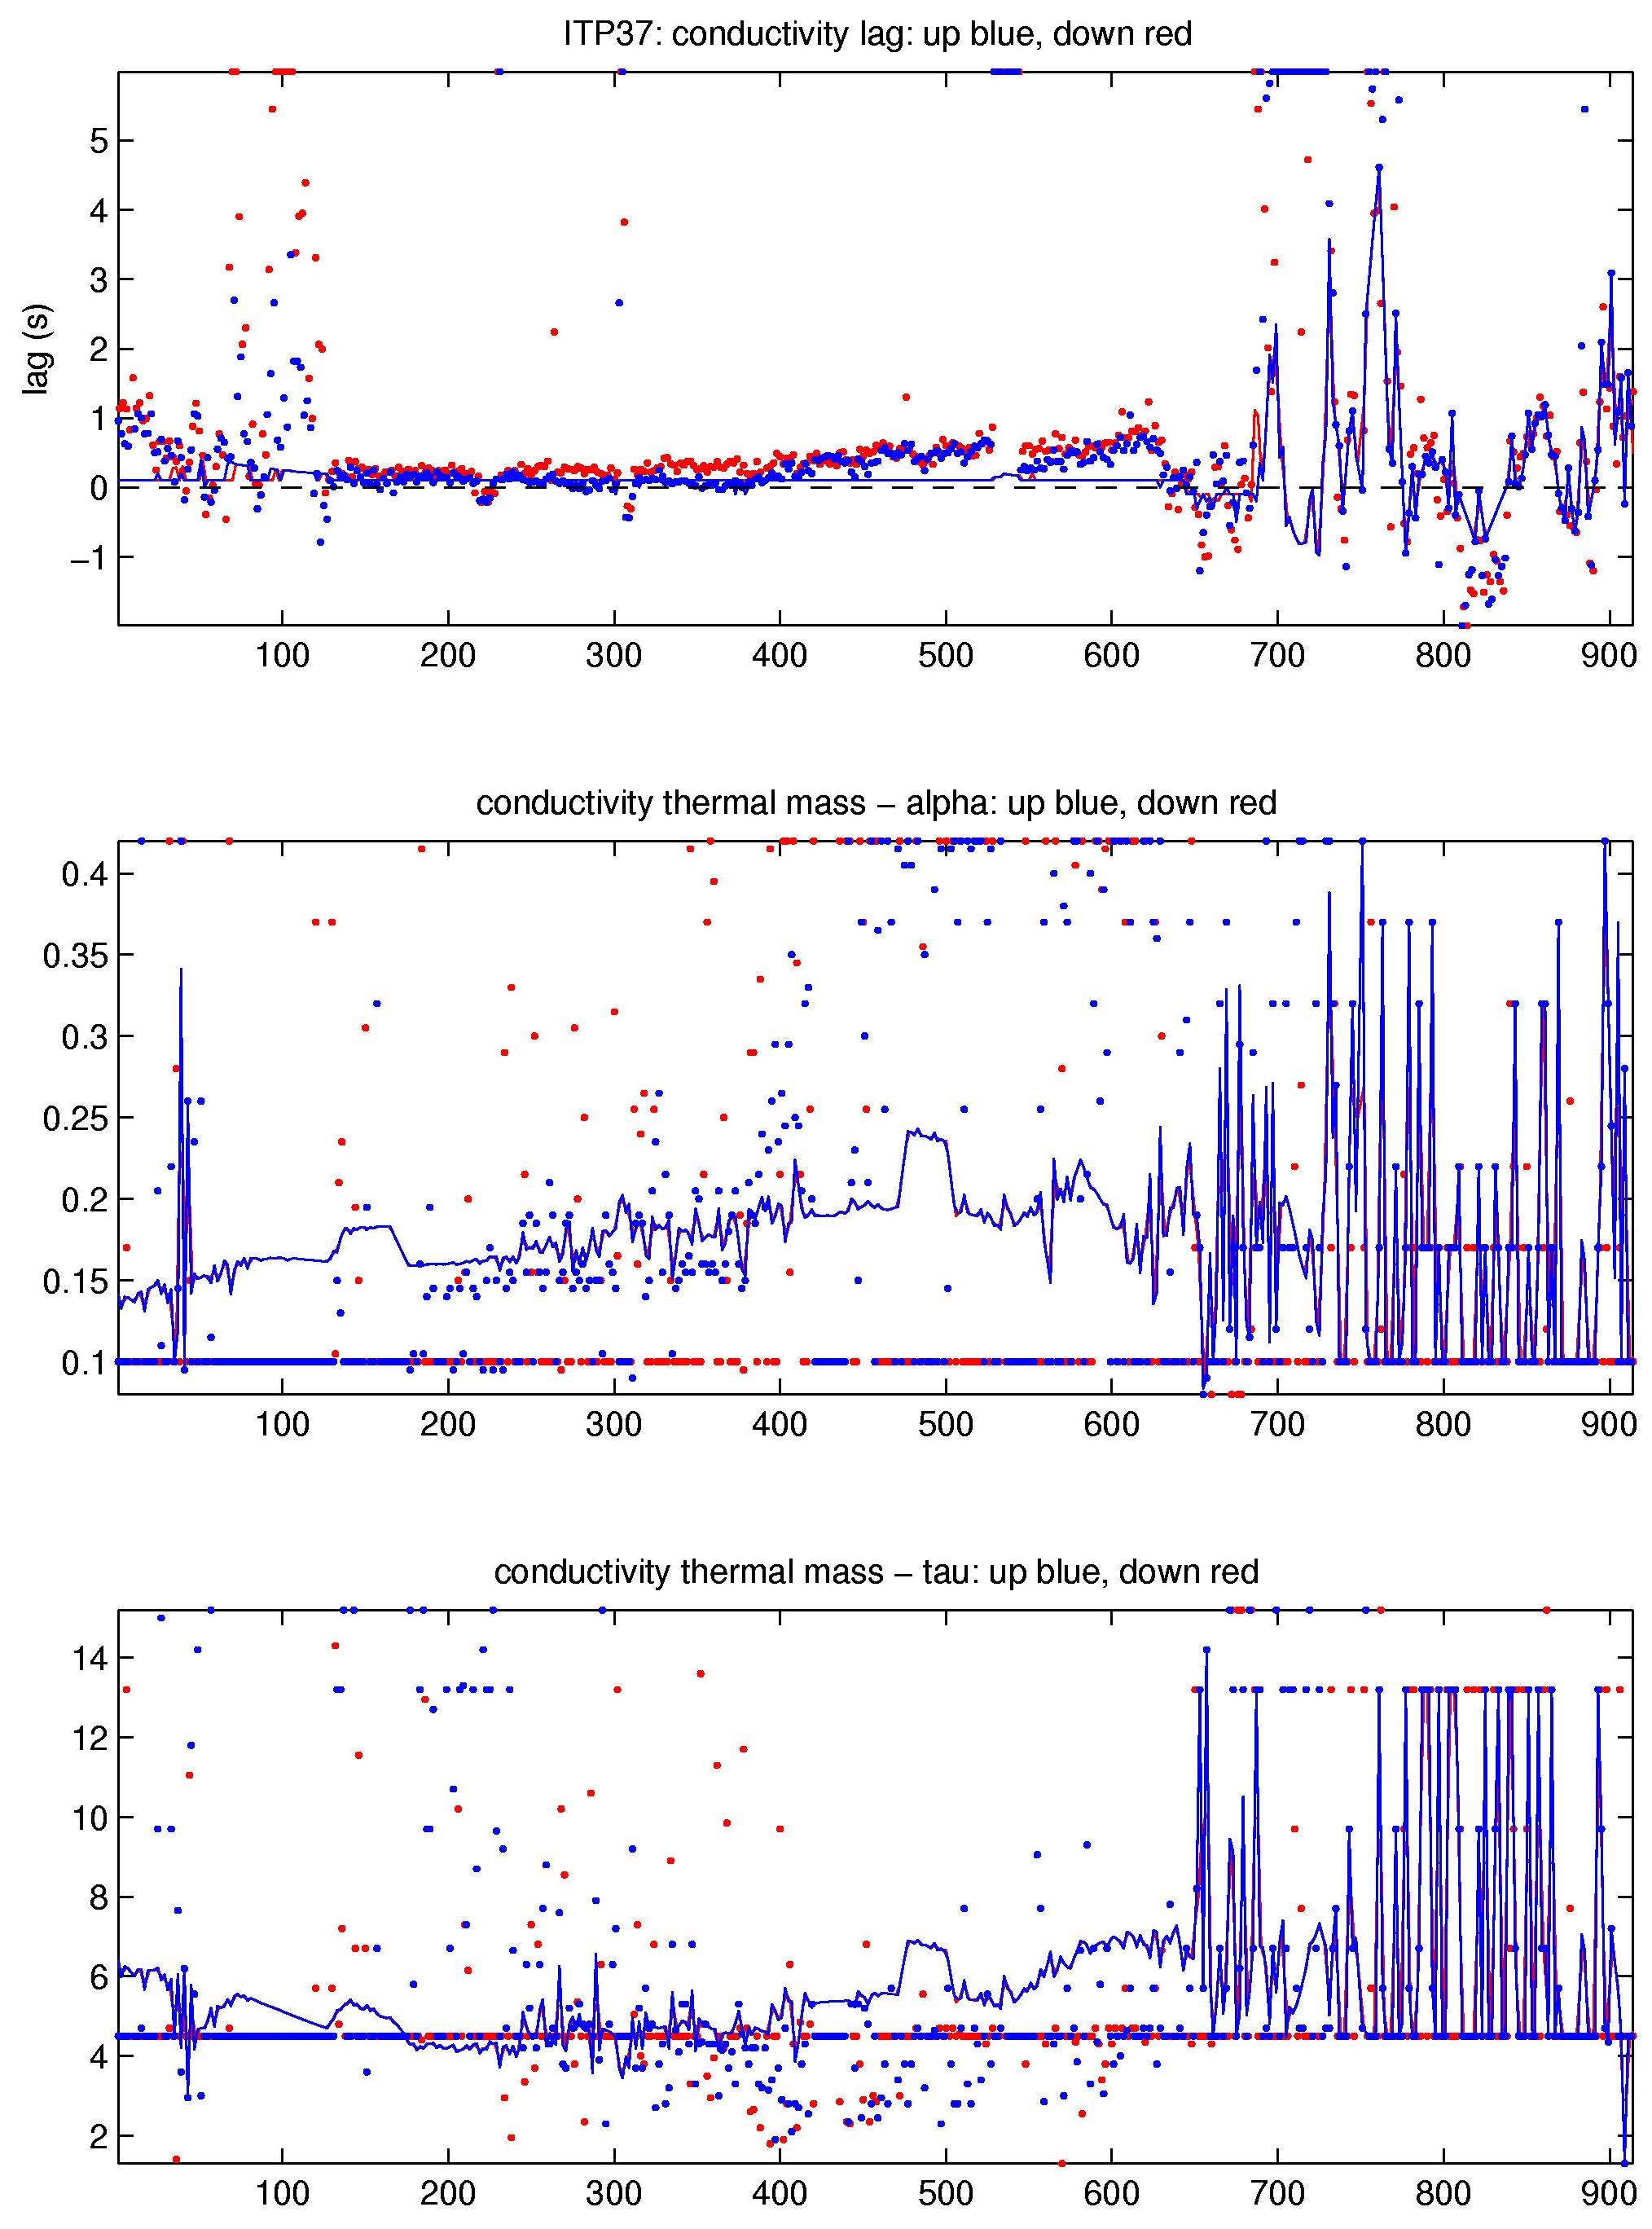
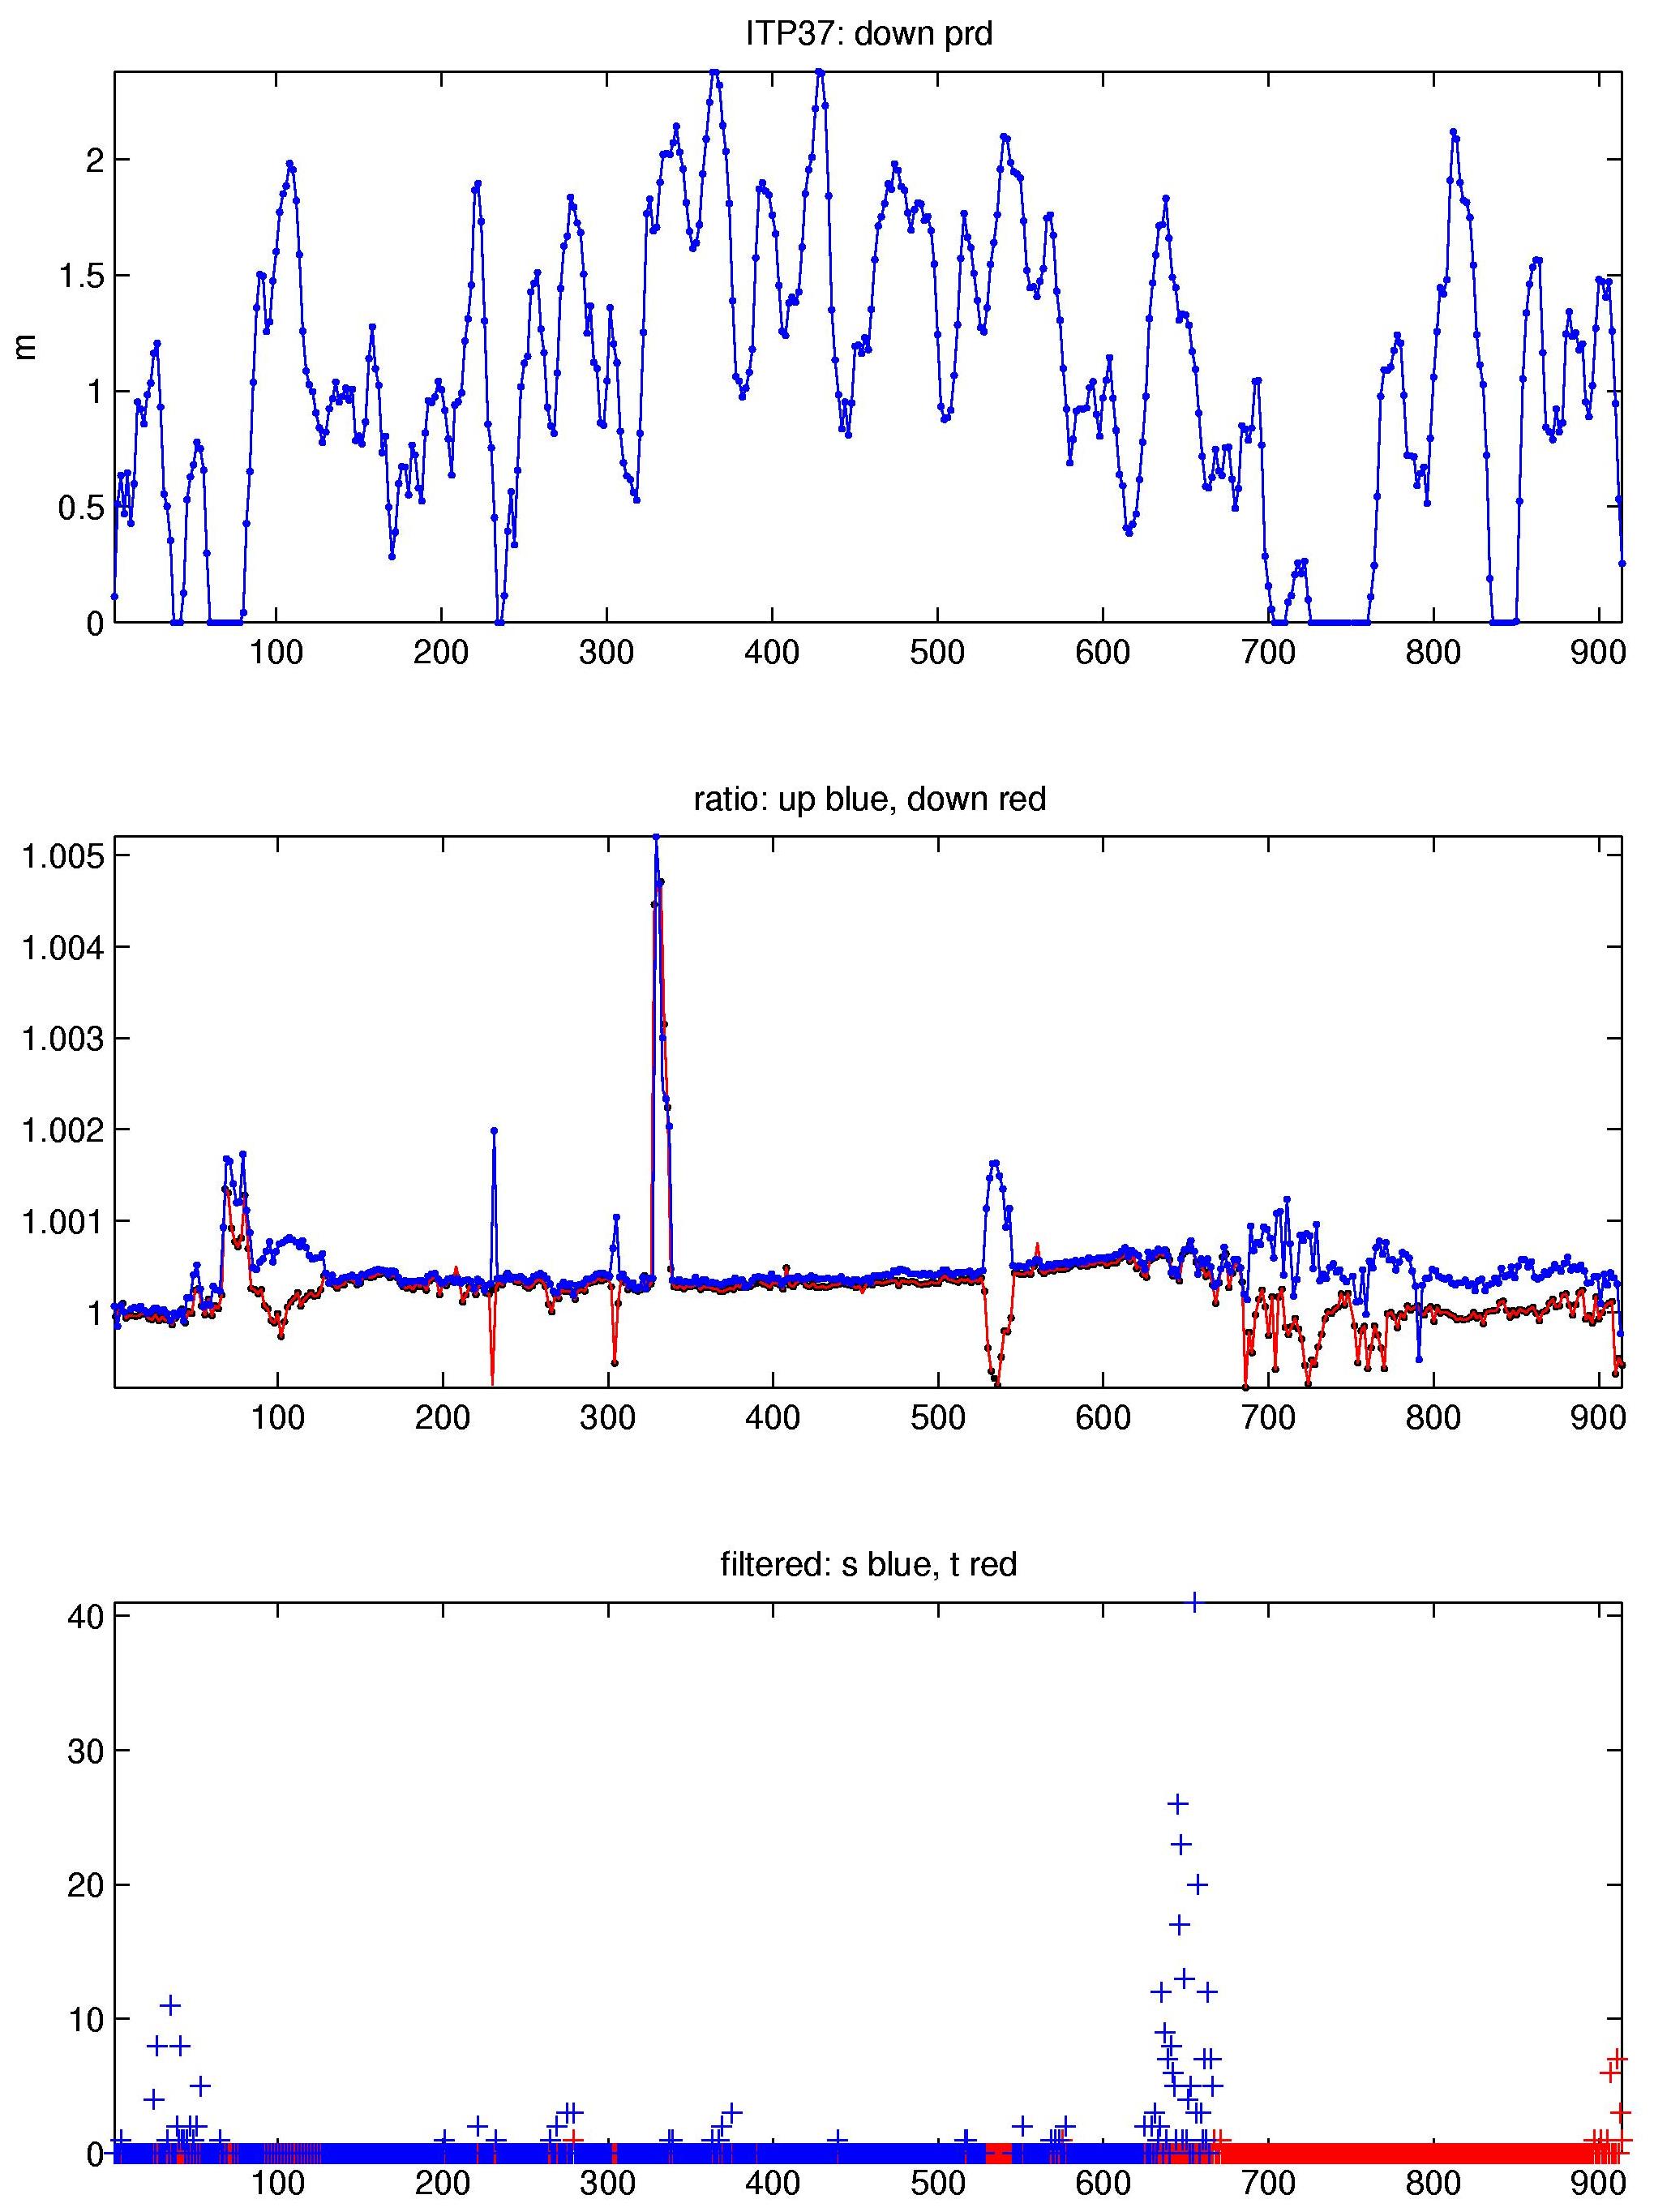
ITP37 transmitted 962 profiles until December 24, 2010 that were processed according to the procedures described in the ITP Updated Data Processing Procedures. However, the profiler stopped crawling on the wire after profile 914 (November 30, 2010), and entries past this number were deleted from the final data set. The processing parameters for this ITP are shown in the figures to the right. Thermohaline staircases were generally present, enabling CTD lag corrections.
There were two major "fouling" events. Both started somewhat benign with profile noise slowly increasing over a series of profiles. Later hysteresis in TS space picked up, eventually becoming obvious in density profiles as well, until the data clearly became unusable. The first event started around profile 43, but very clean data suddenly re-appeared with profile 128. The second event started around 623, but in this case the record never recovered. In both instances, the profiles were first marked as questionable (qflag=1) before the worst data were removed; it was difficult and rather arbitrary to decide where to set these transitions. Beyond these two dramatic events, a smaller set of glitches was removed from an additional small number of profiles in other parts of the record.
See the Data Products tab to the left for descriptions of the three levels (I, II, III) of data processing and to access all data.
