ITP17 Data Processing
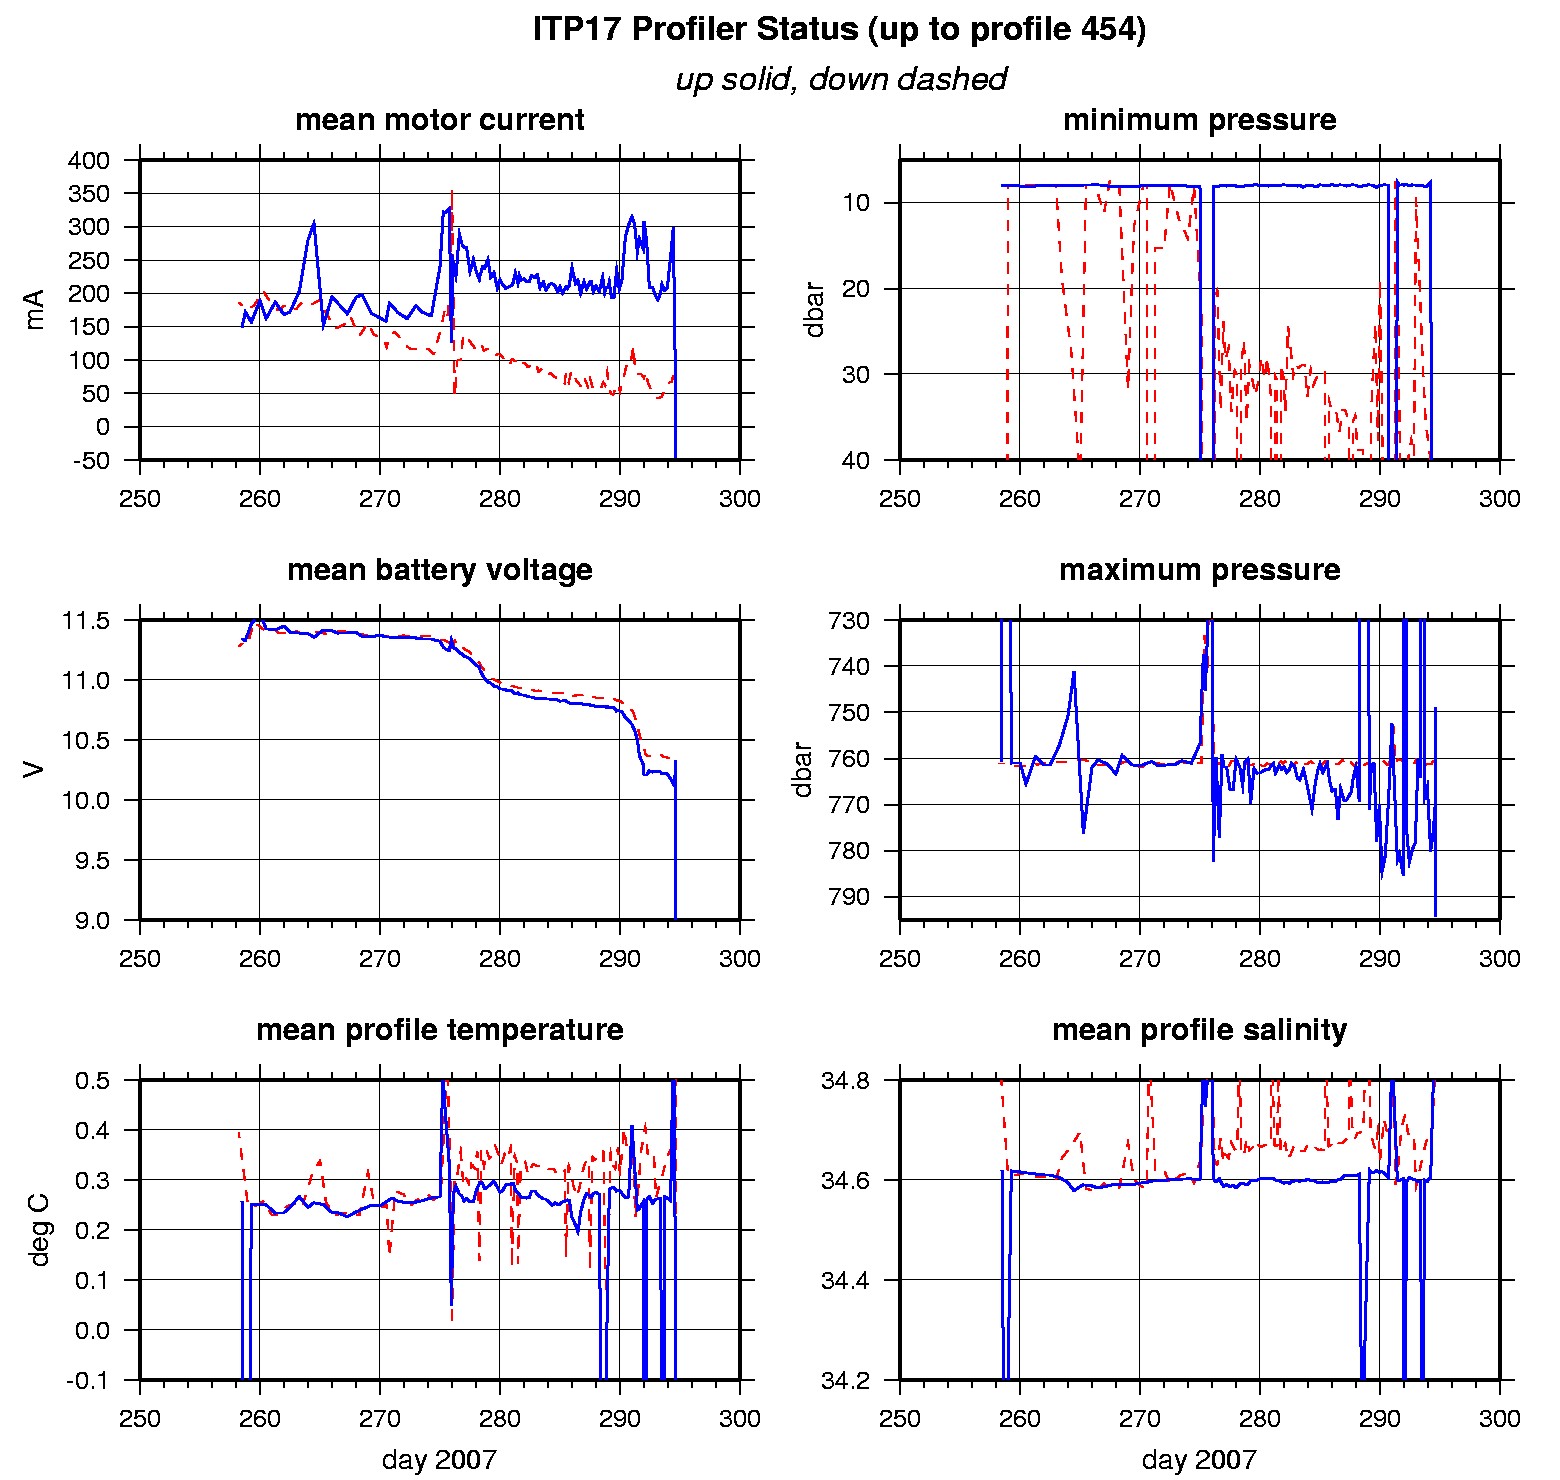
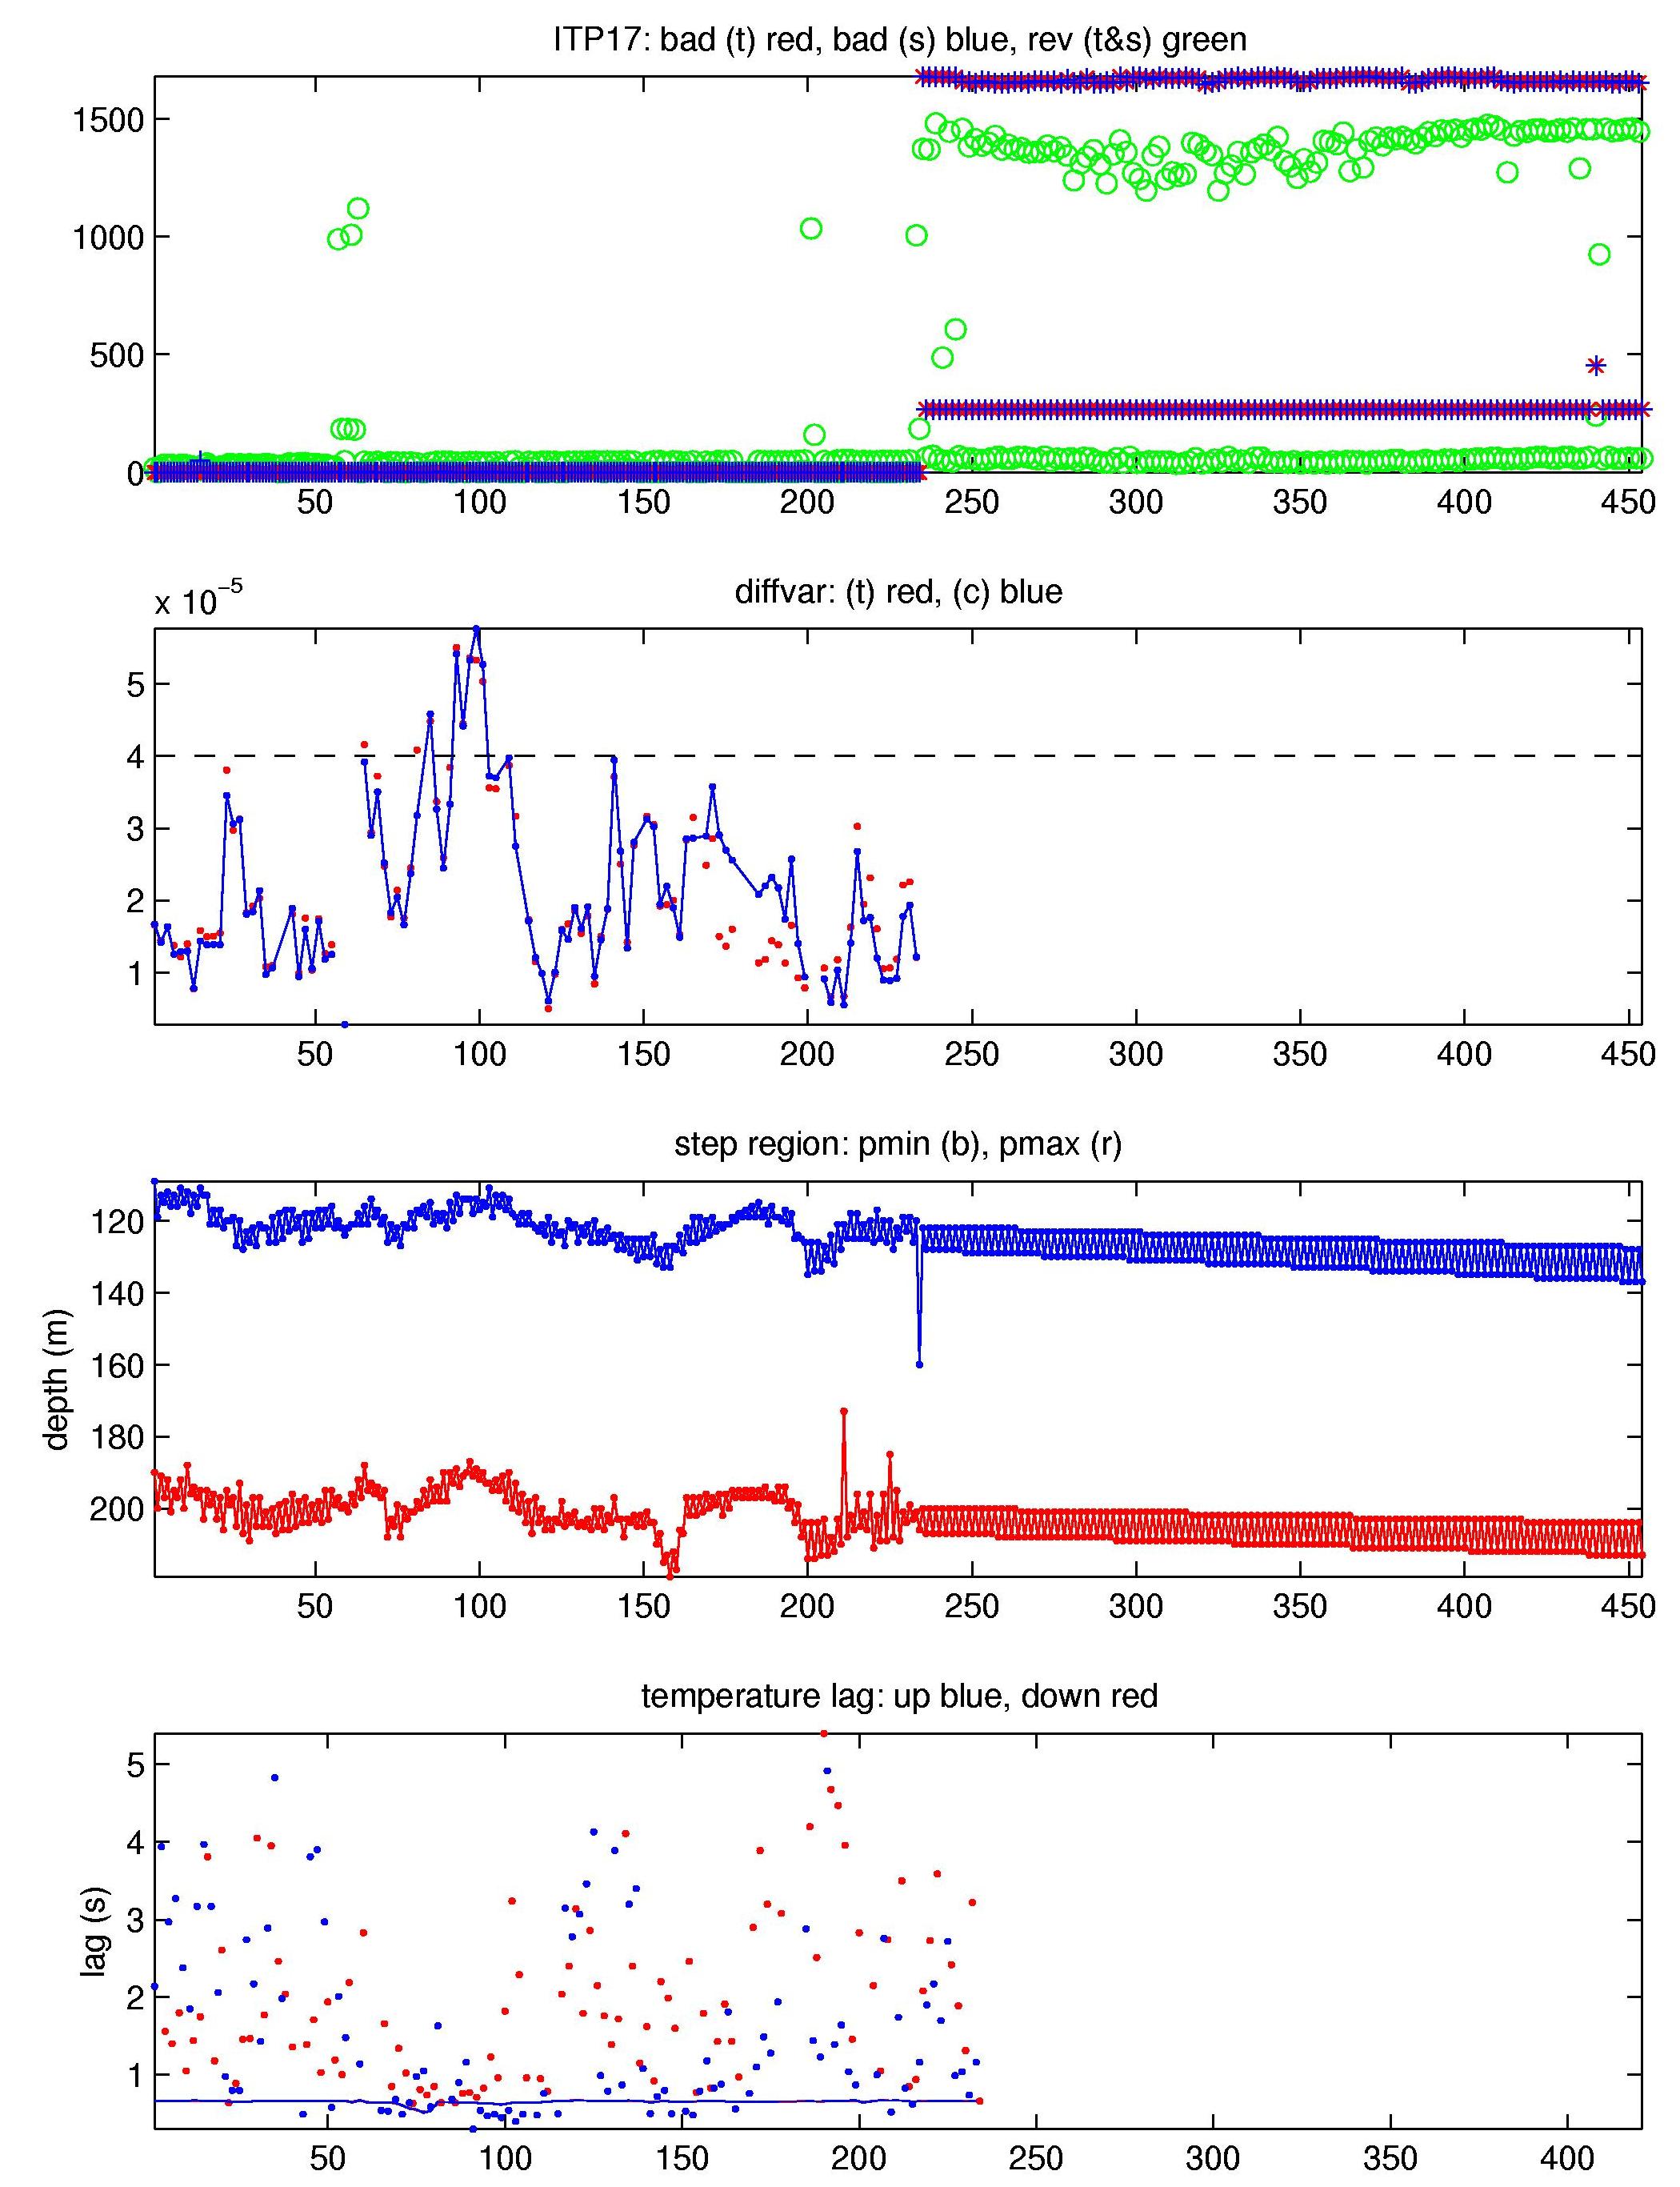
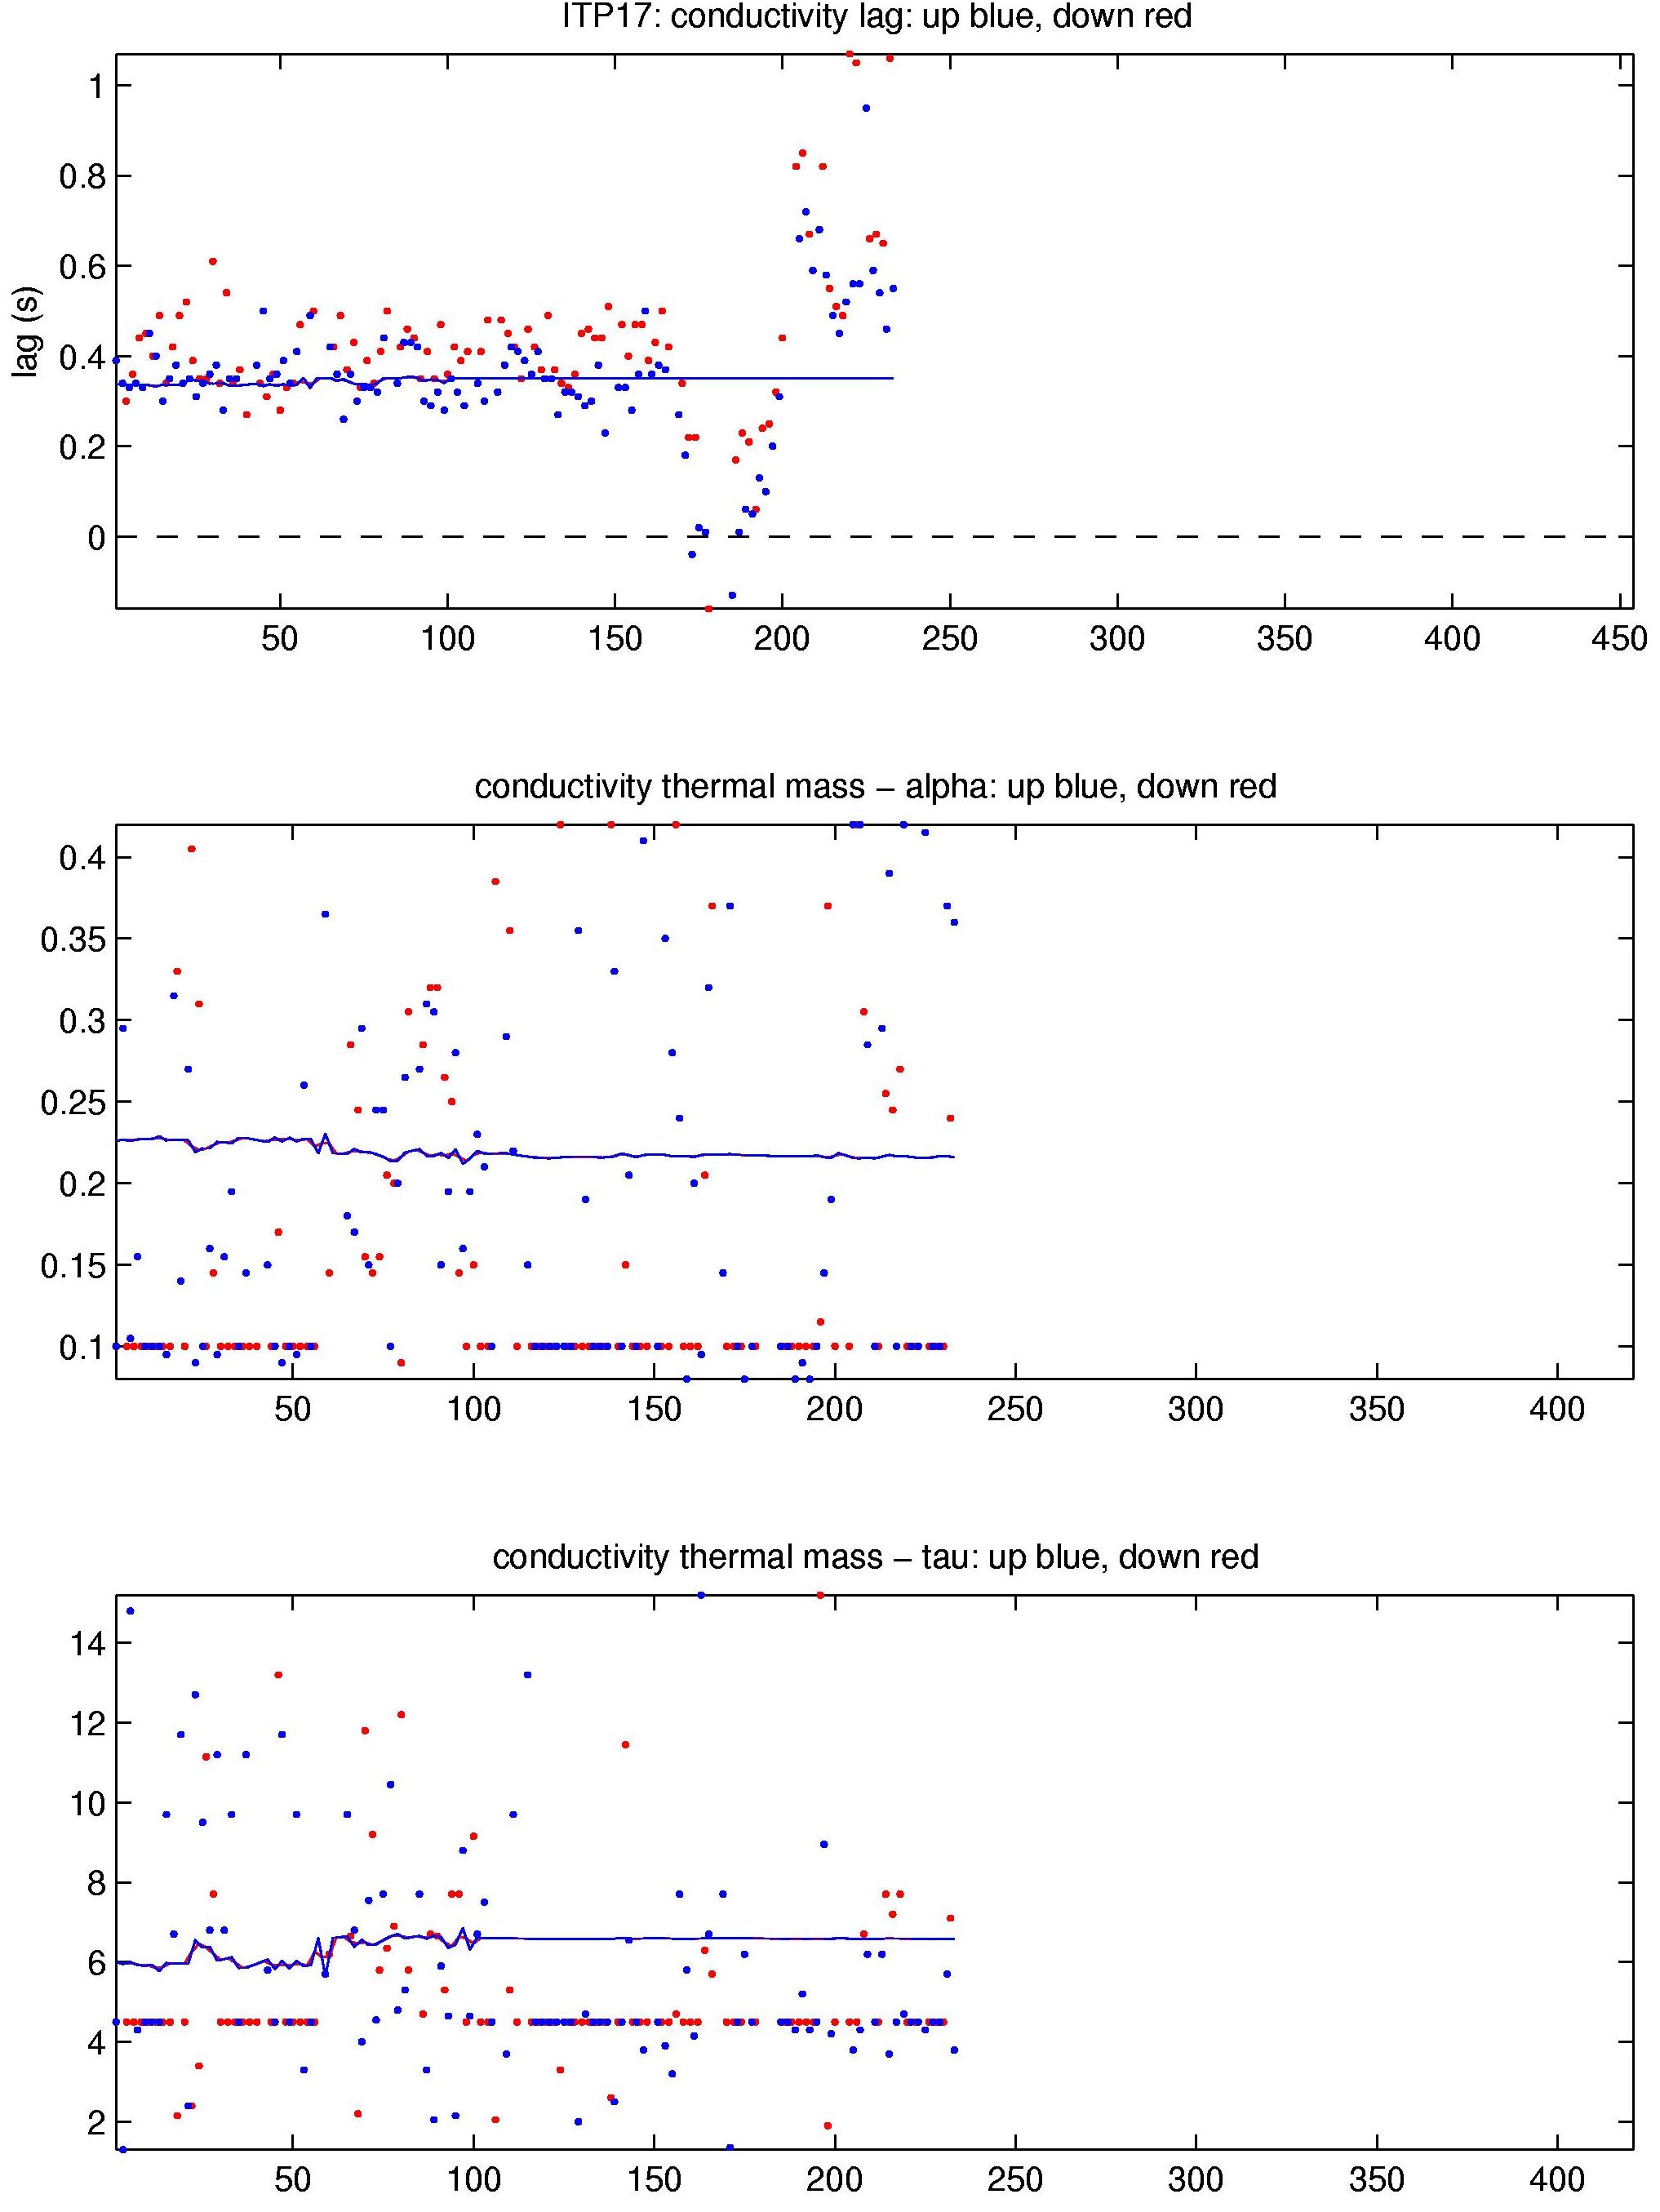
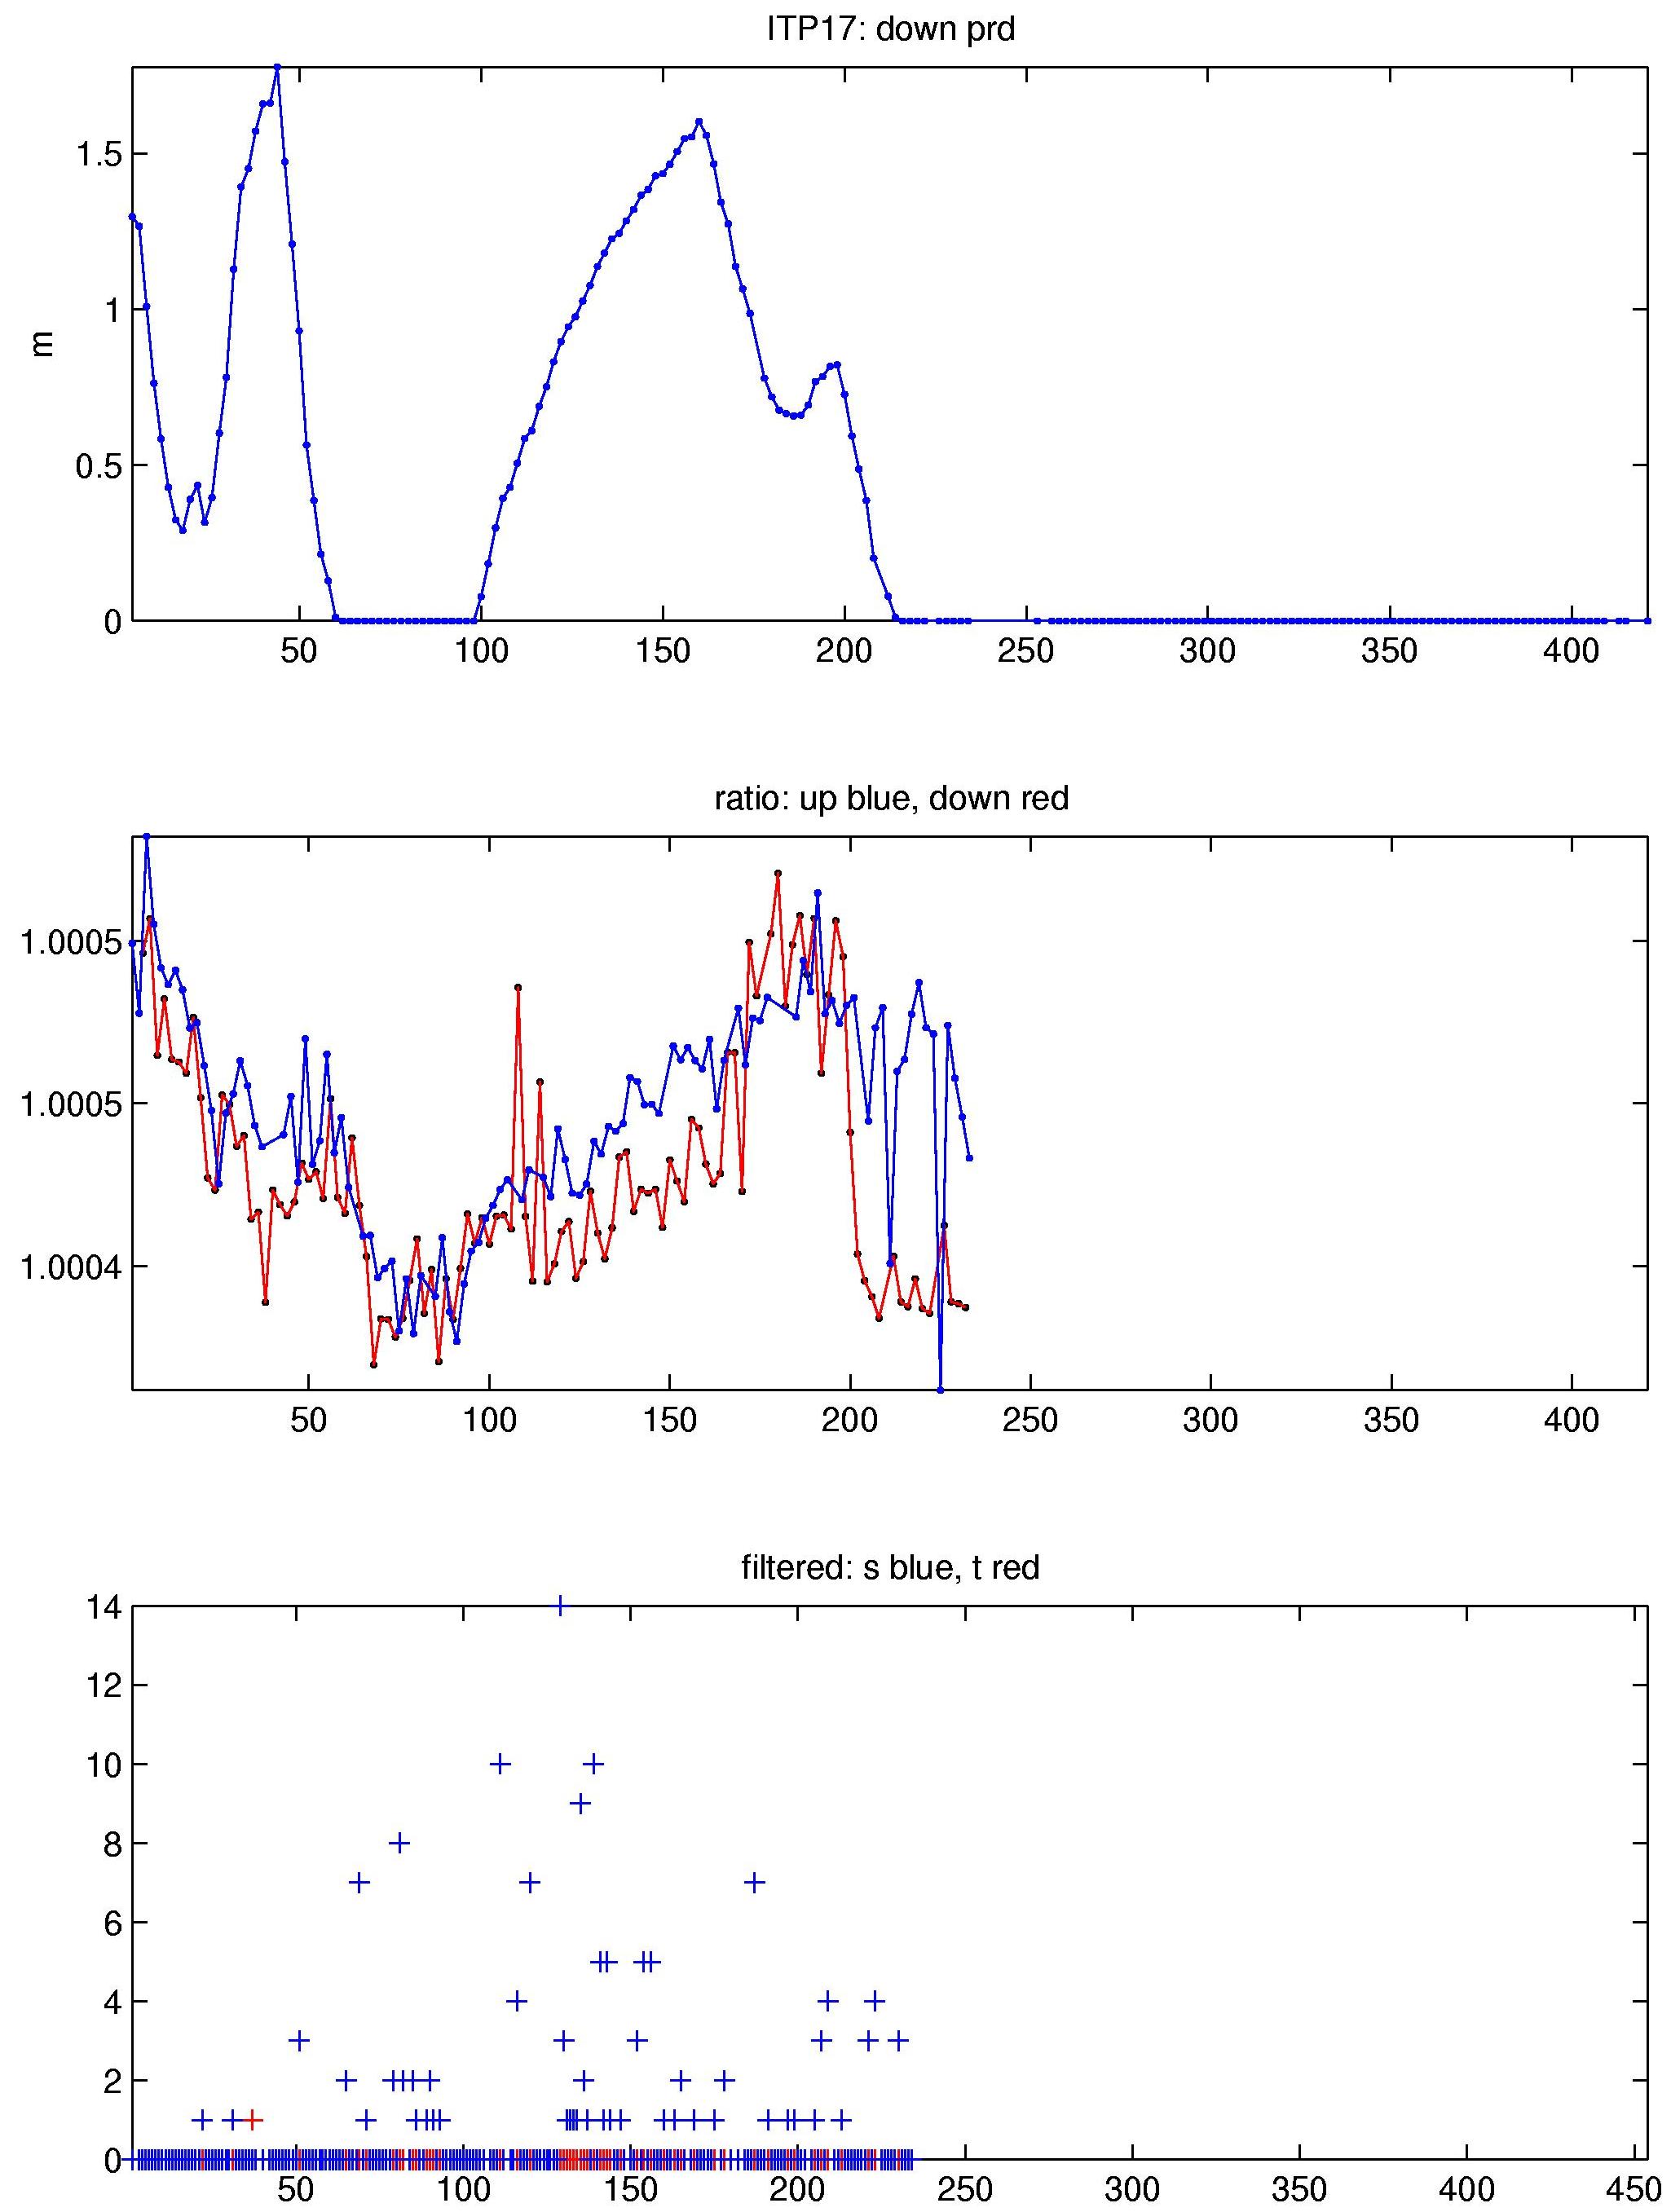
The 454 profile attempts that were recovered from the ITP were processed according to the procedures described in the ITP Updated Data Processing Procedures but only 218 good profiles resulted. The processing parameters for ITP 17 are shown in the figures to the right. The profiler sampled as scheduled for the first 16 days, then spontaneously began profiling approximately every 3 hours for the next 20 days, and ended with 236 profiles with the same time and the profiler on the bottom bumper.
Of the 218 good profiles, only a few include pseudo-thermohaline staircase structures, from which typical sensor lags are determined. These are applied to the remainder of the series where staircases are absent. The profiler also was interrupted by 15 software resets. Otherwise, the short dataset had very little biofouling and a stable conductivity calibration ratio throughout.
See the Data Products tab to the left for descriptions of the three levels (I, II, III) of data processing and to access all data.
