ITP 3 Data Processing
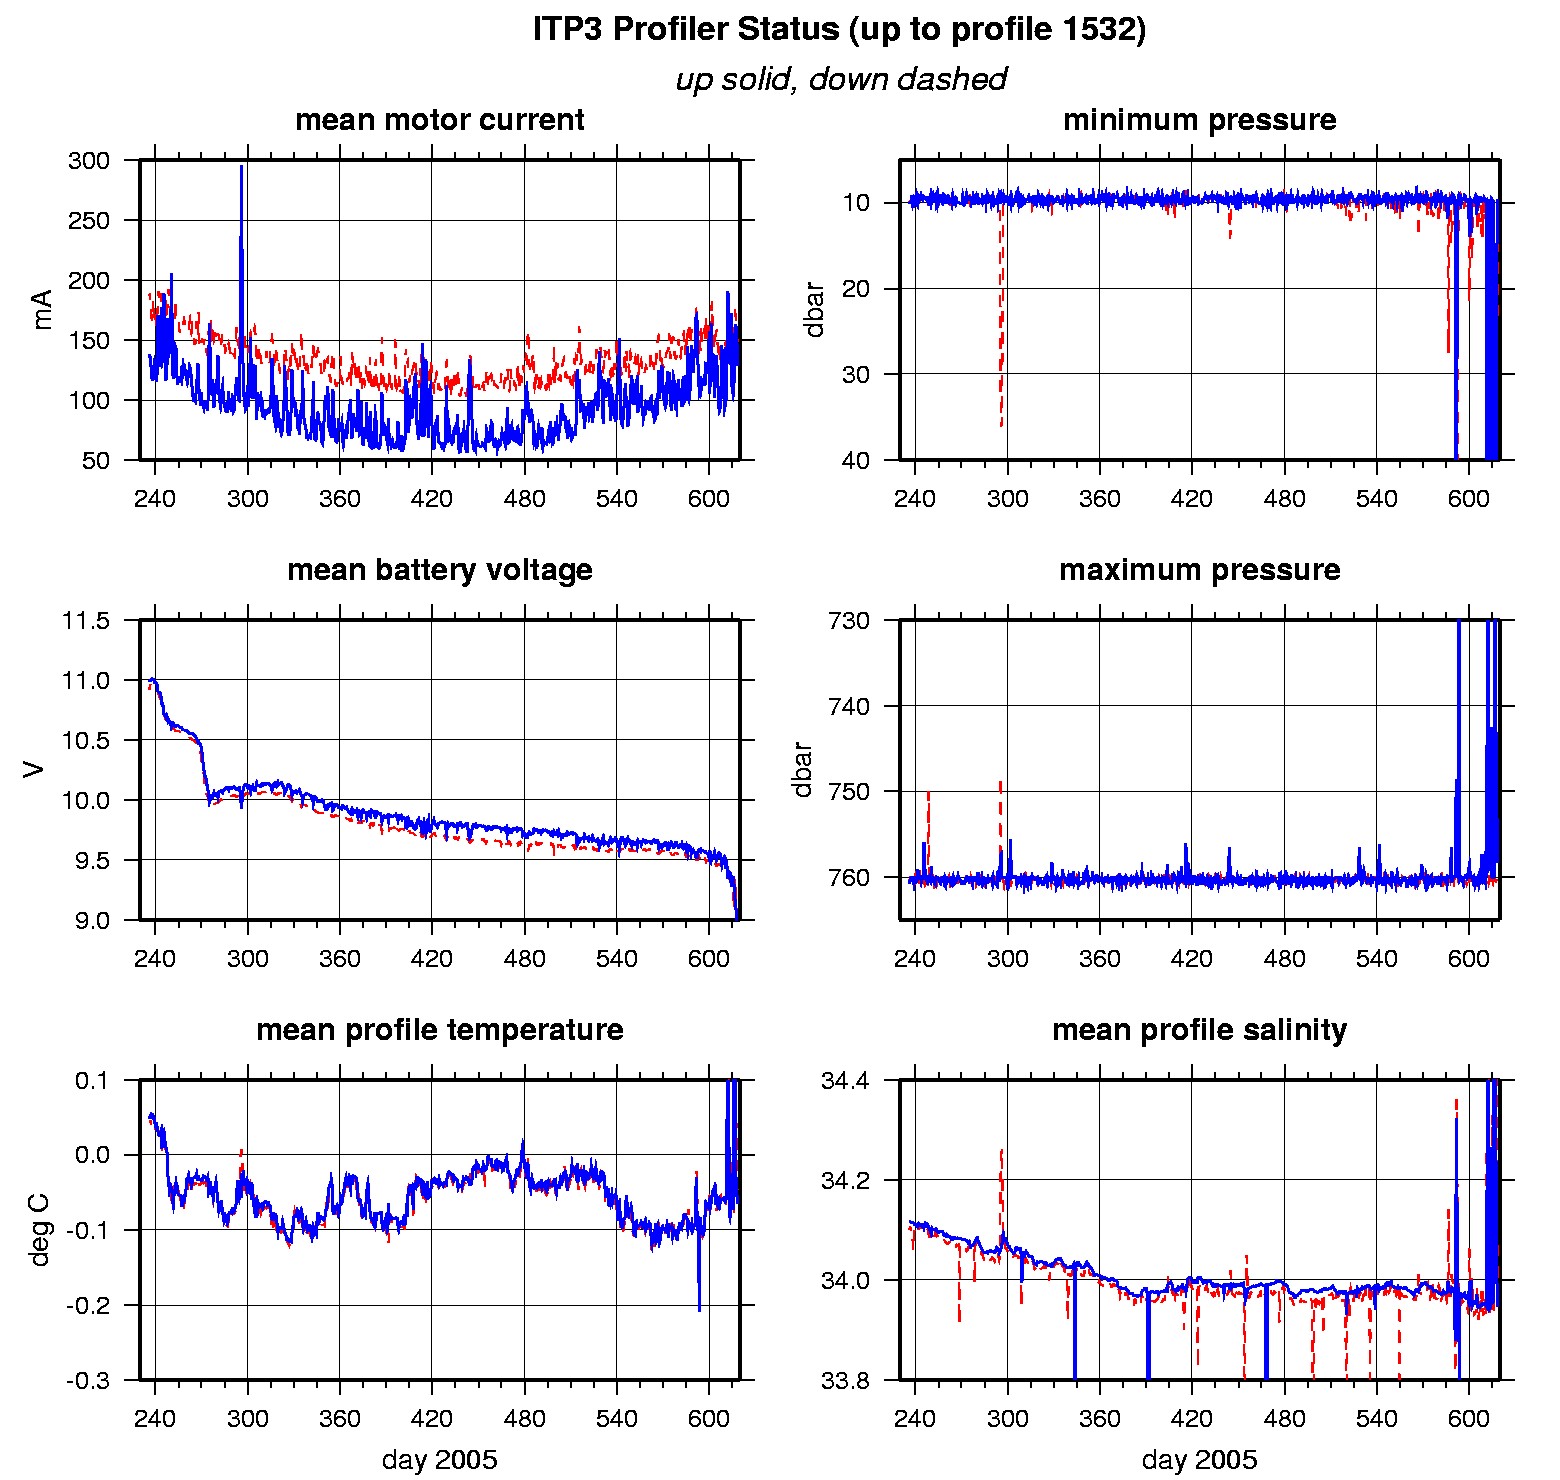
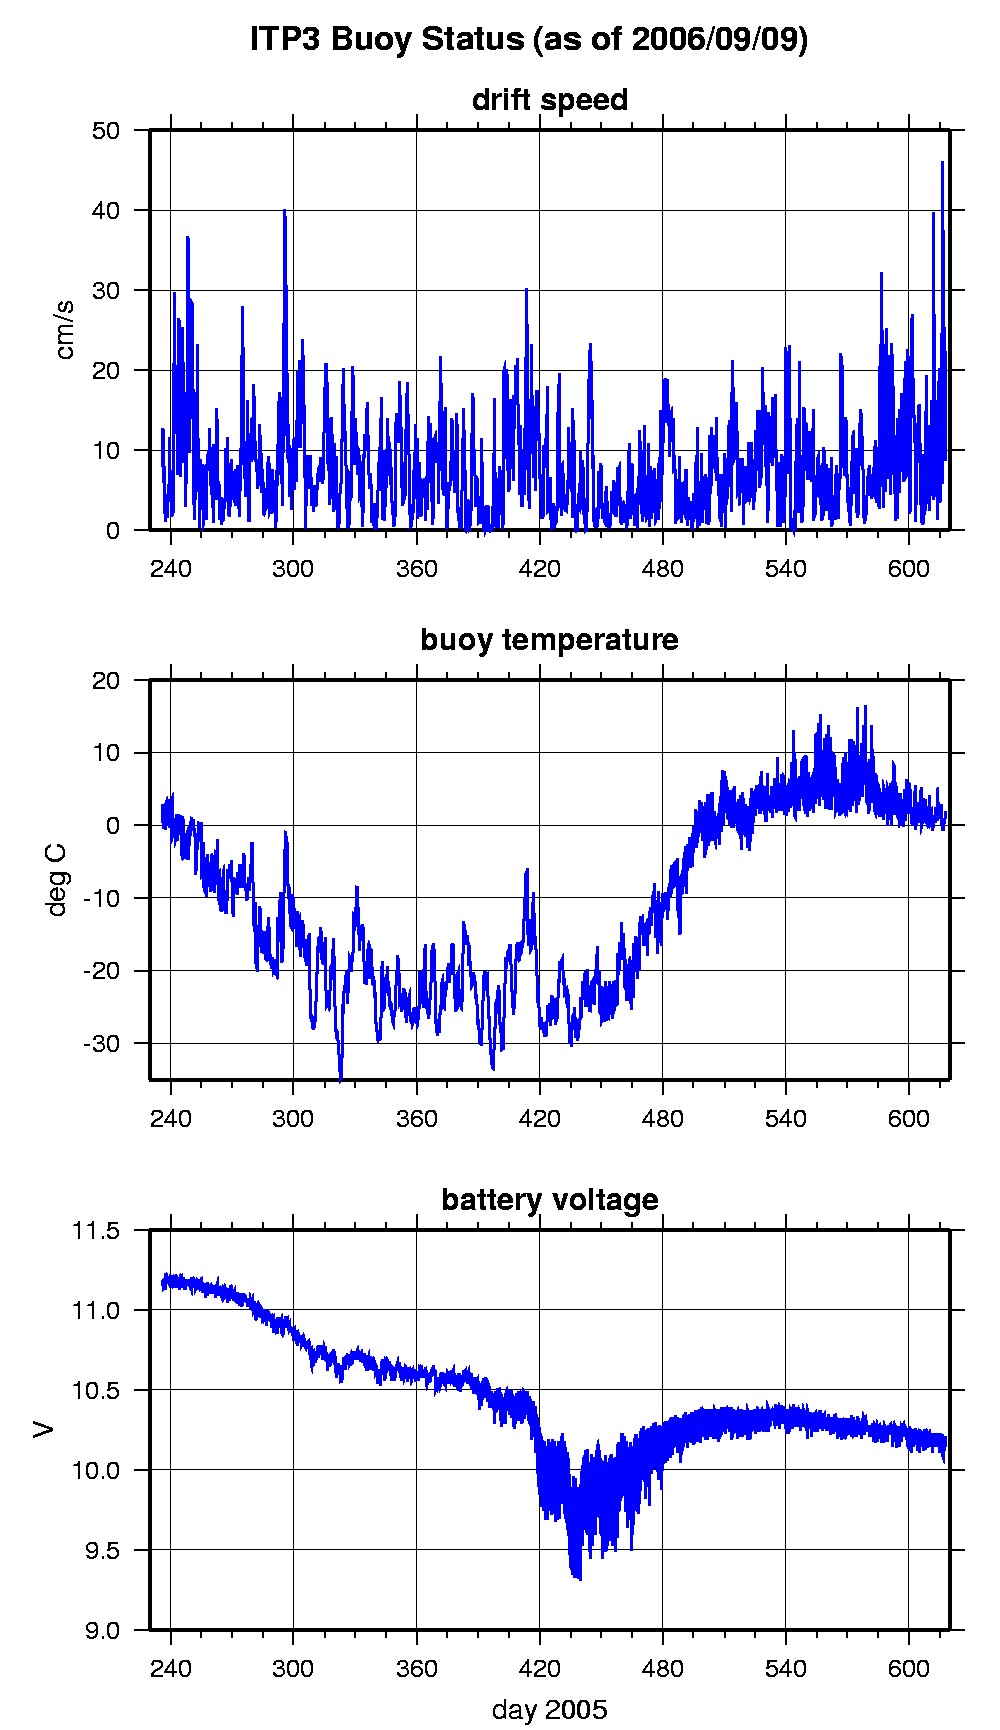
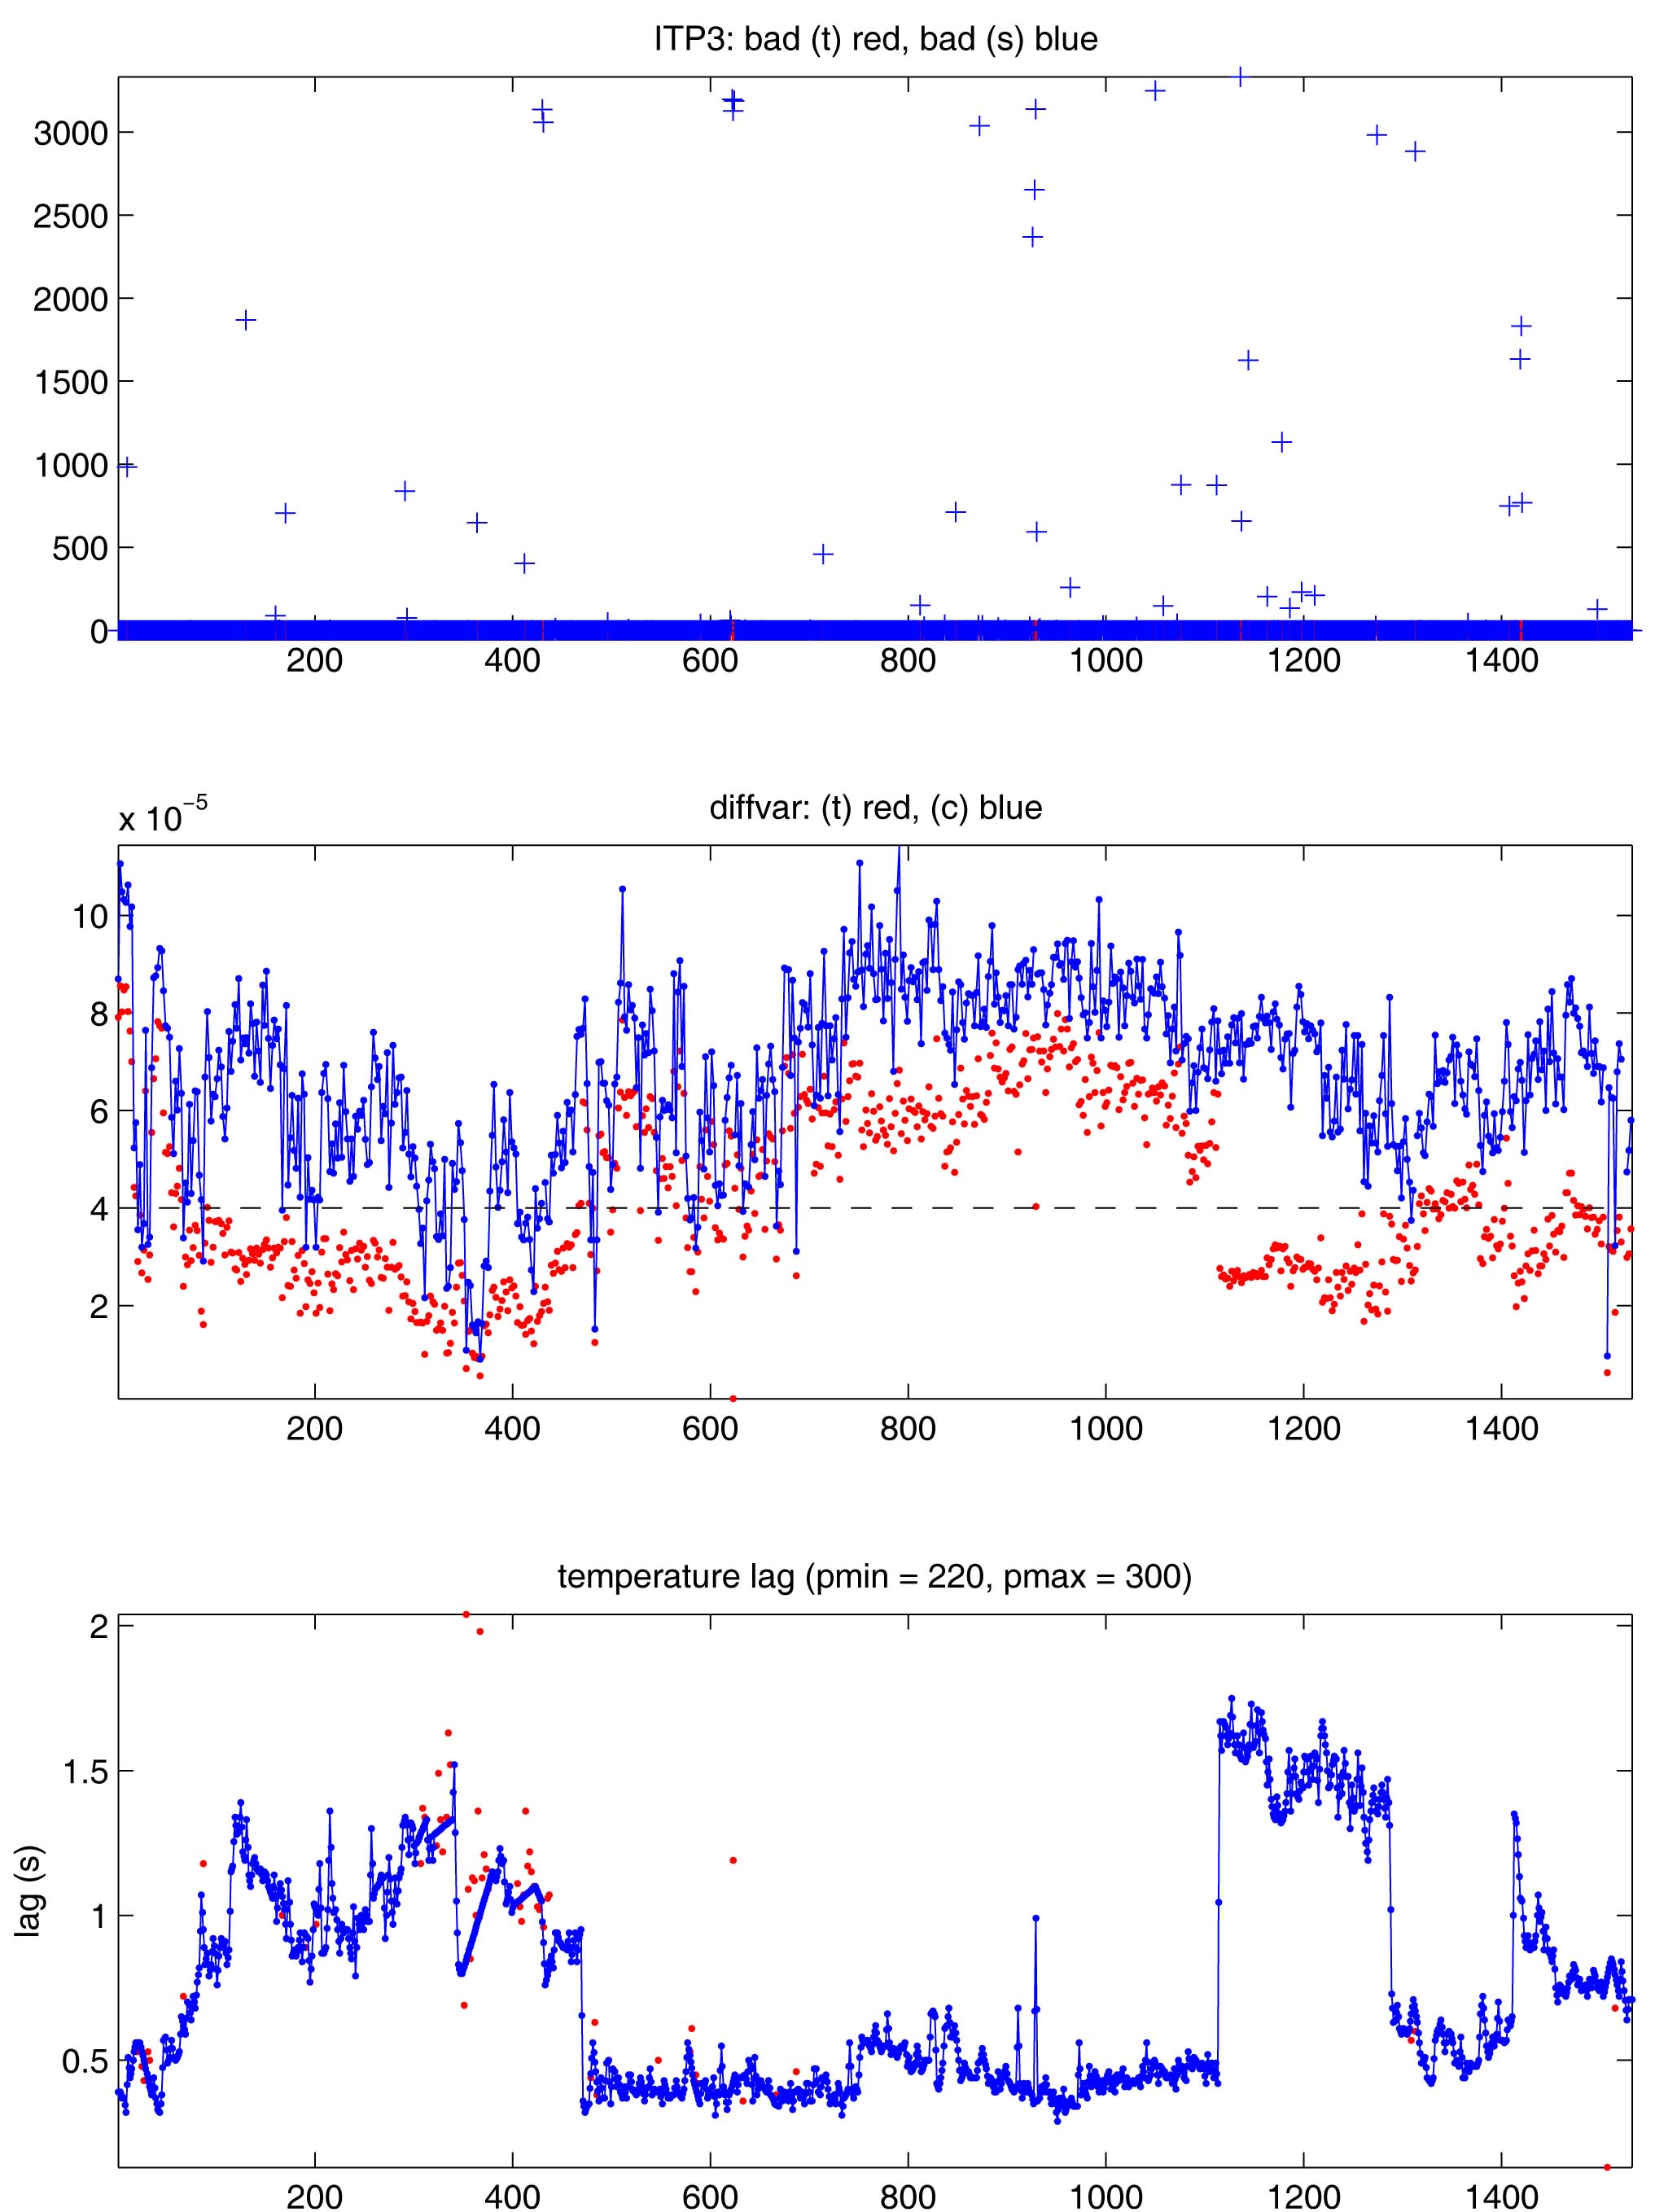
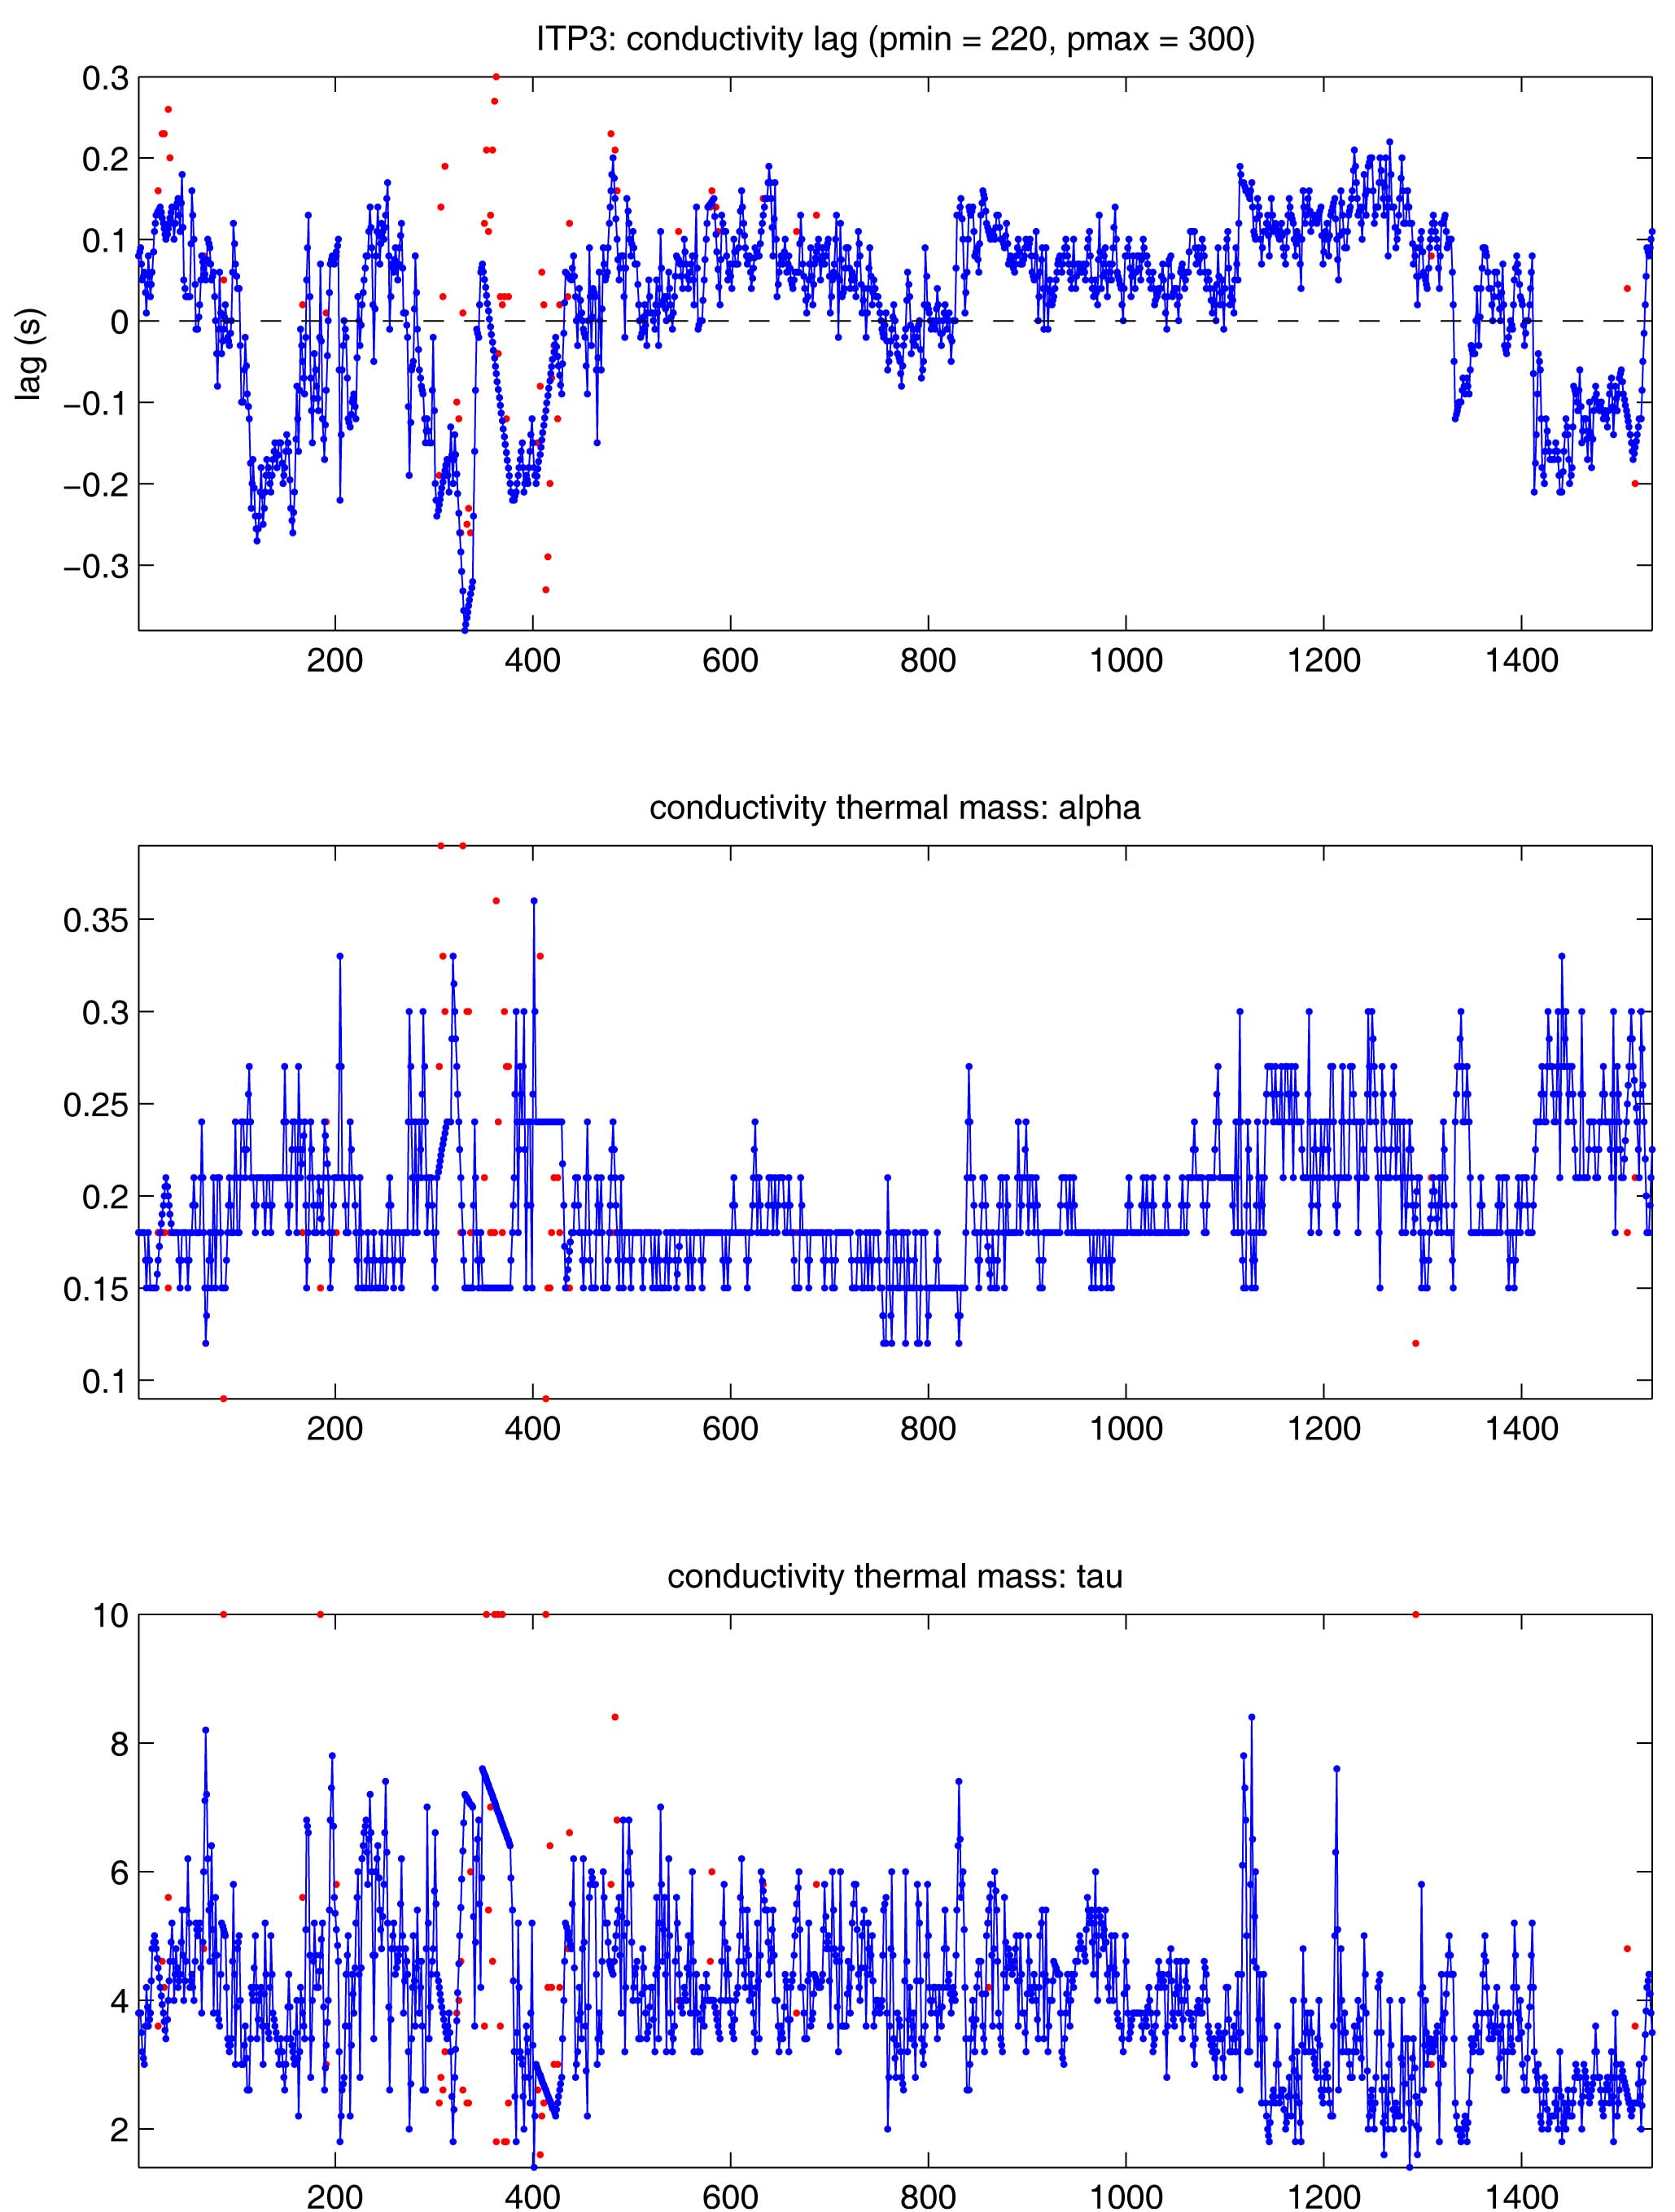
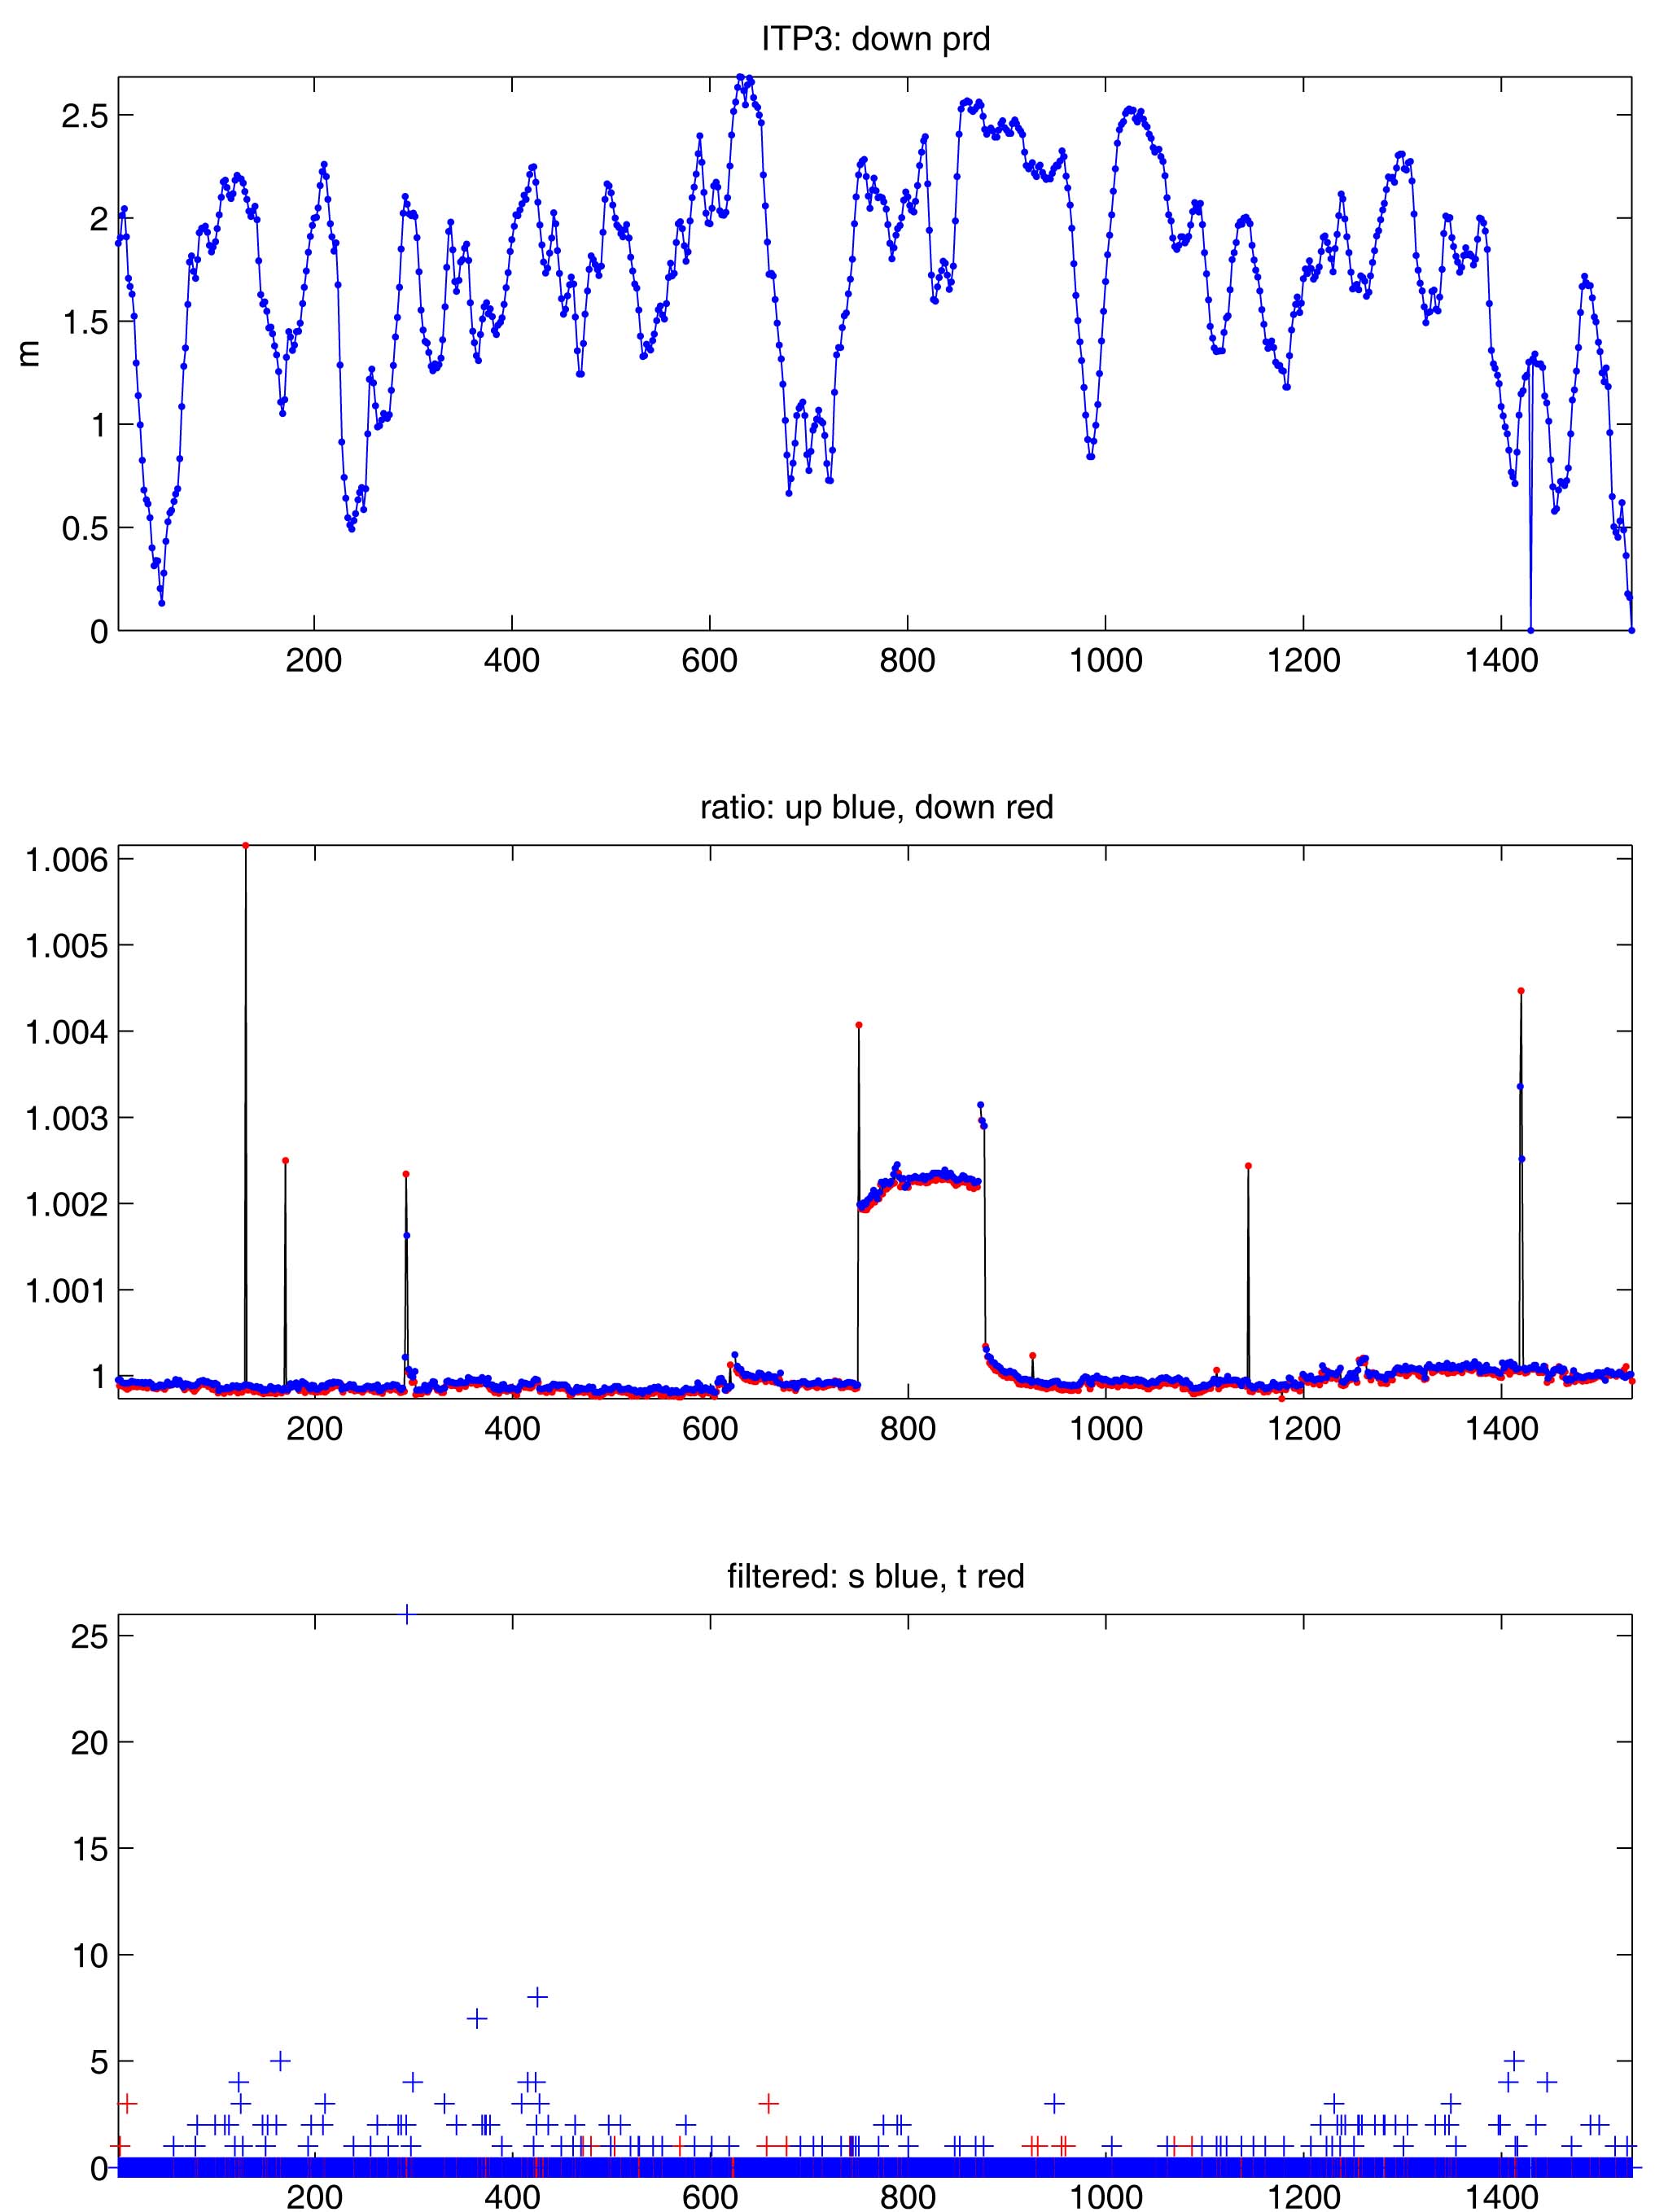
The 1532 profiles that were recovered from the ITP were processed according to the procedures described in the ITP Data Processing Procedures report. The processing parameters for ITP3 are shown in the figures to the right. Overall, ITP3 returned remarkably clean and complete profiles. Only towards the end of the time series (after profile 1500) when the profiler battery was getting low and the ice floe was drifting faster, did the instrument have trouble completing full profiles. Only profile 1430 was subject to an instrument reset, so there is no CTD data from that profile. Profiles 430, 431, 622, 623, 624, 929, 1050 and 1136 were too contaminated (presumably from biofouling) to salvage. In the final product, 1520 profiles (99.2%) have no more than one bad temperature measurement, and 1501 (98.0%) have no more than one bad conductivity spike.
See the Data Products tab to the left for descriptions of the three levels (I, II, III) of data processing and to access all data.
