ITP 33 Data Processing
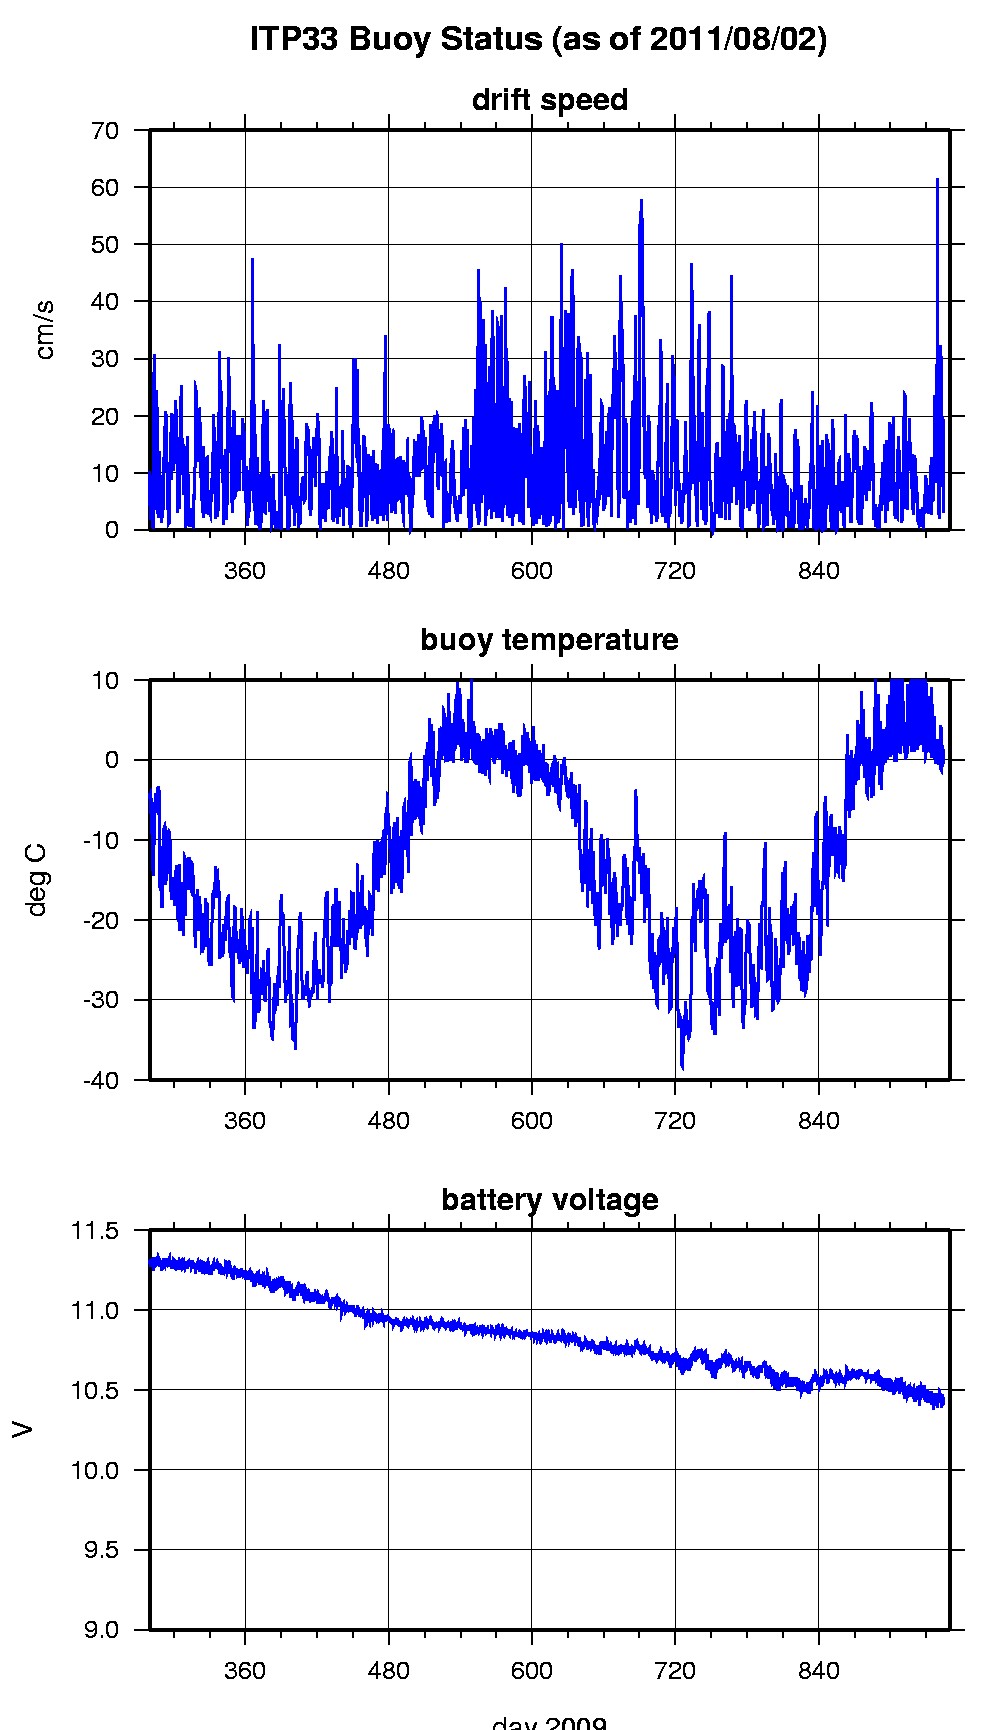
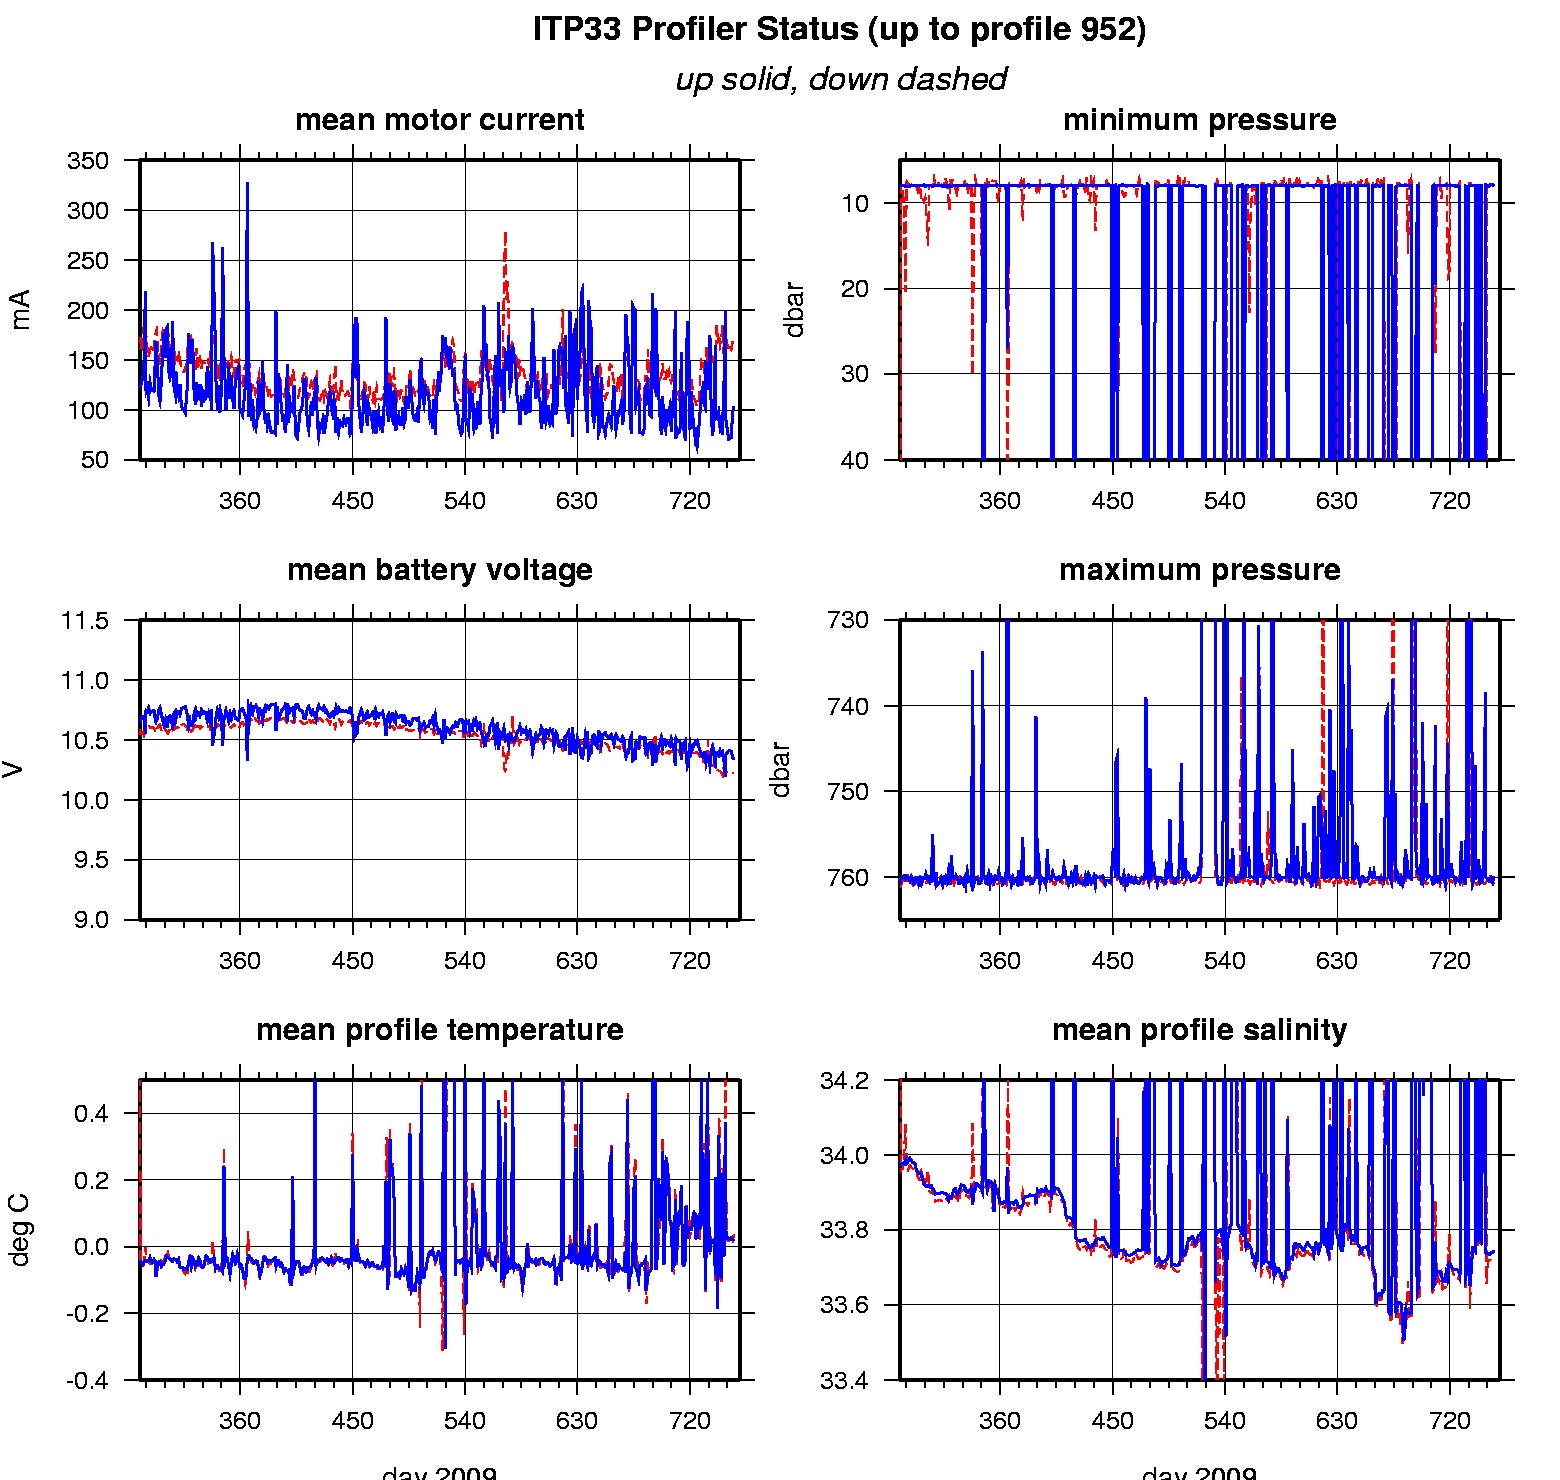
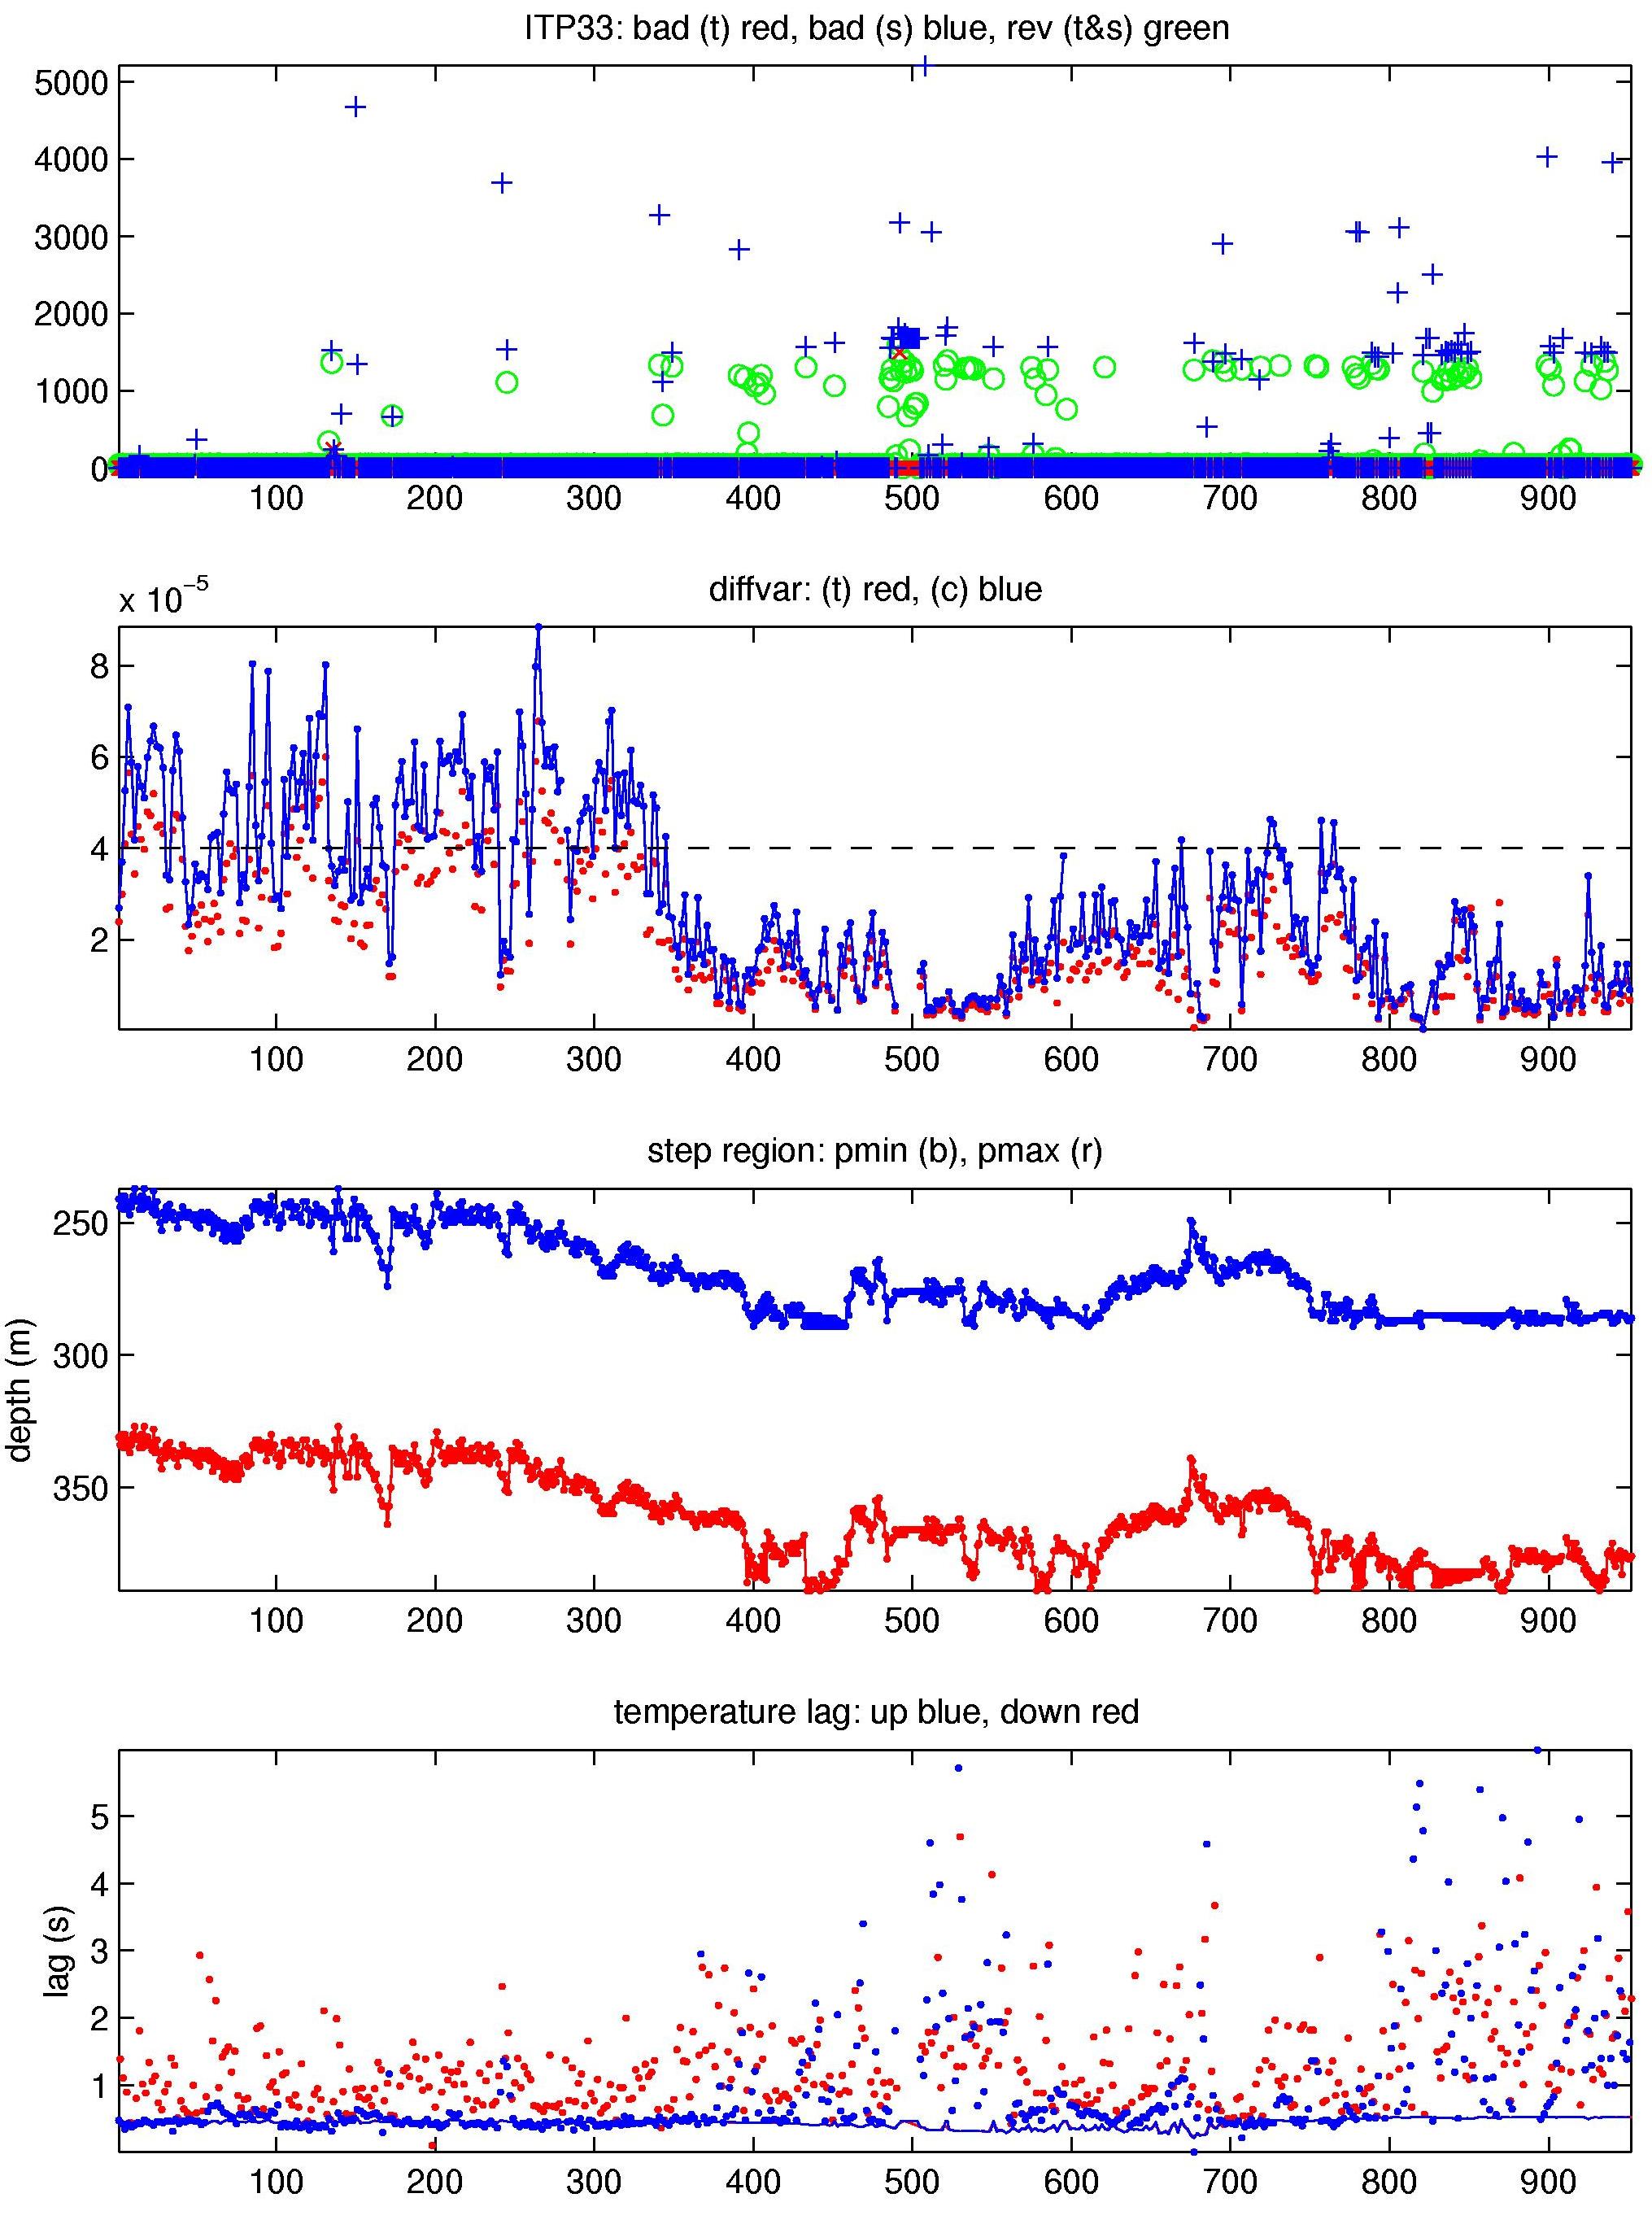
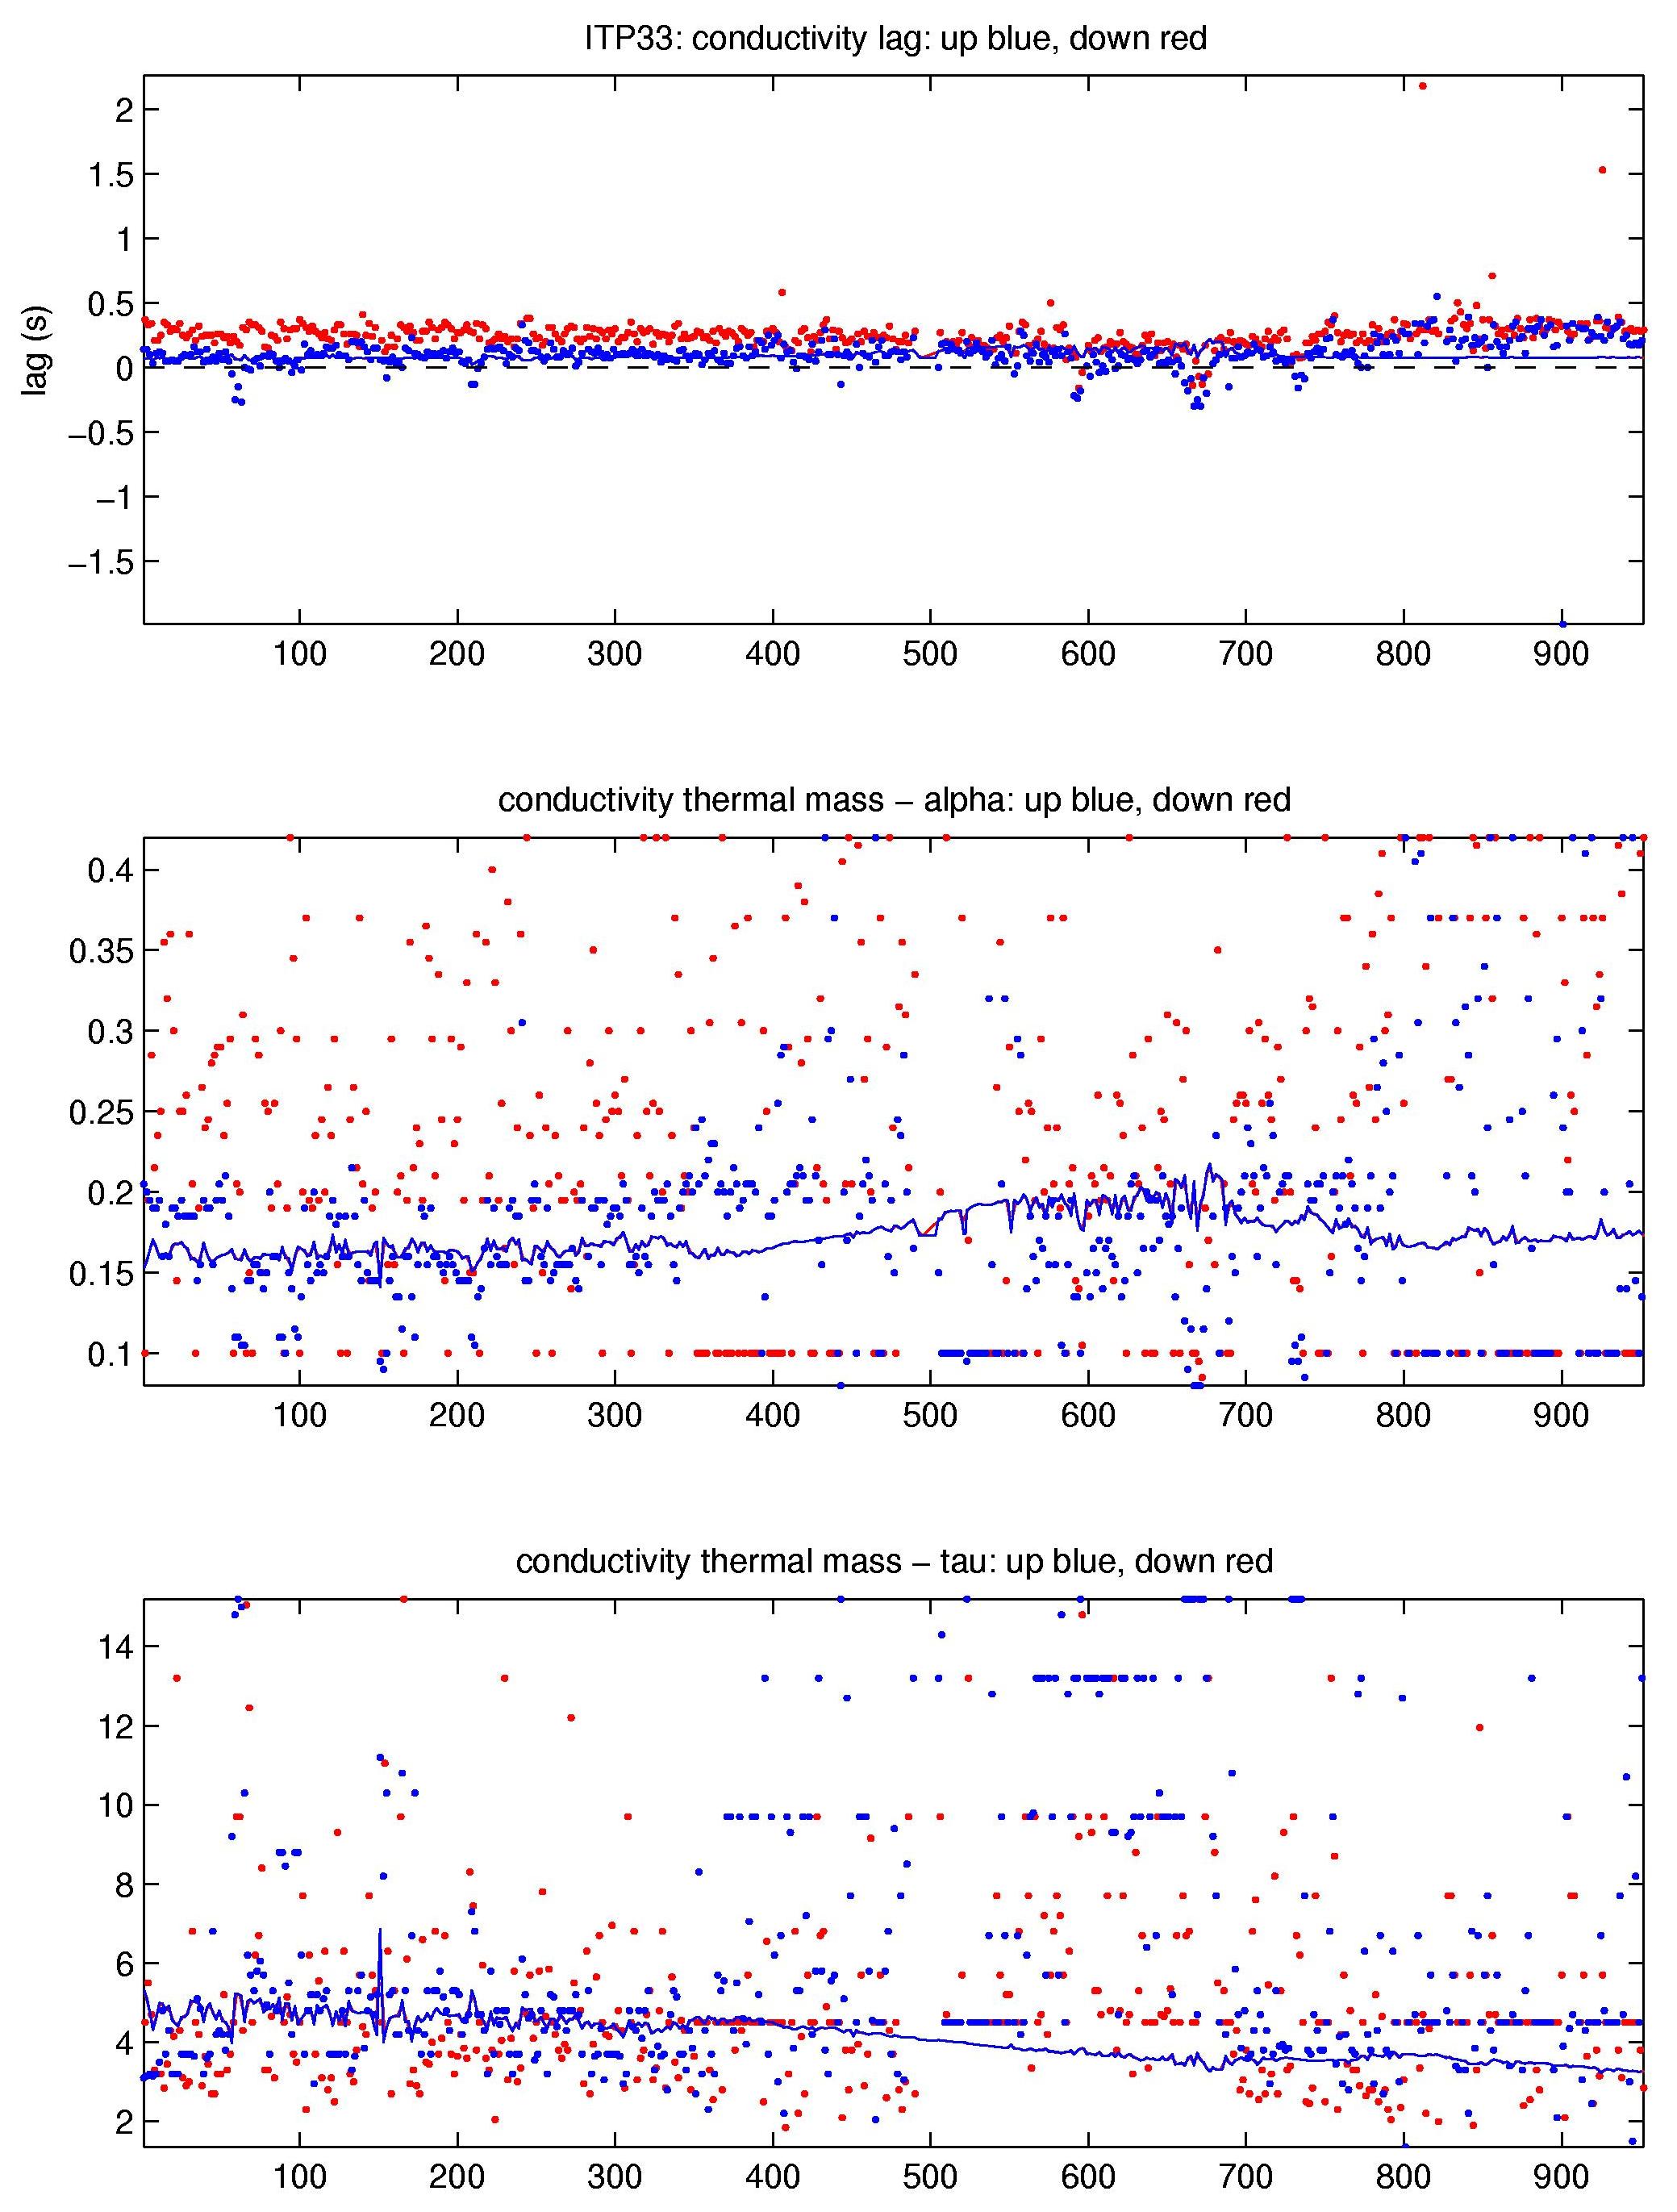
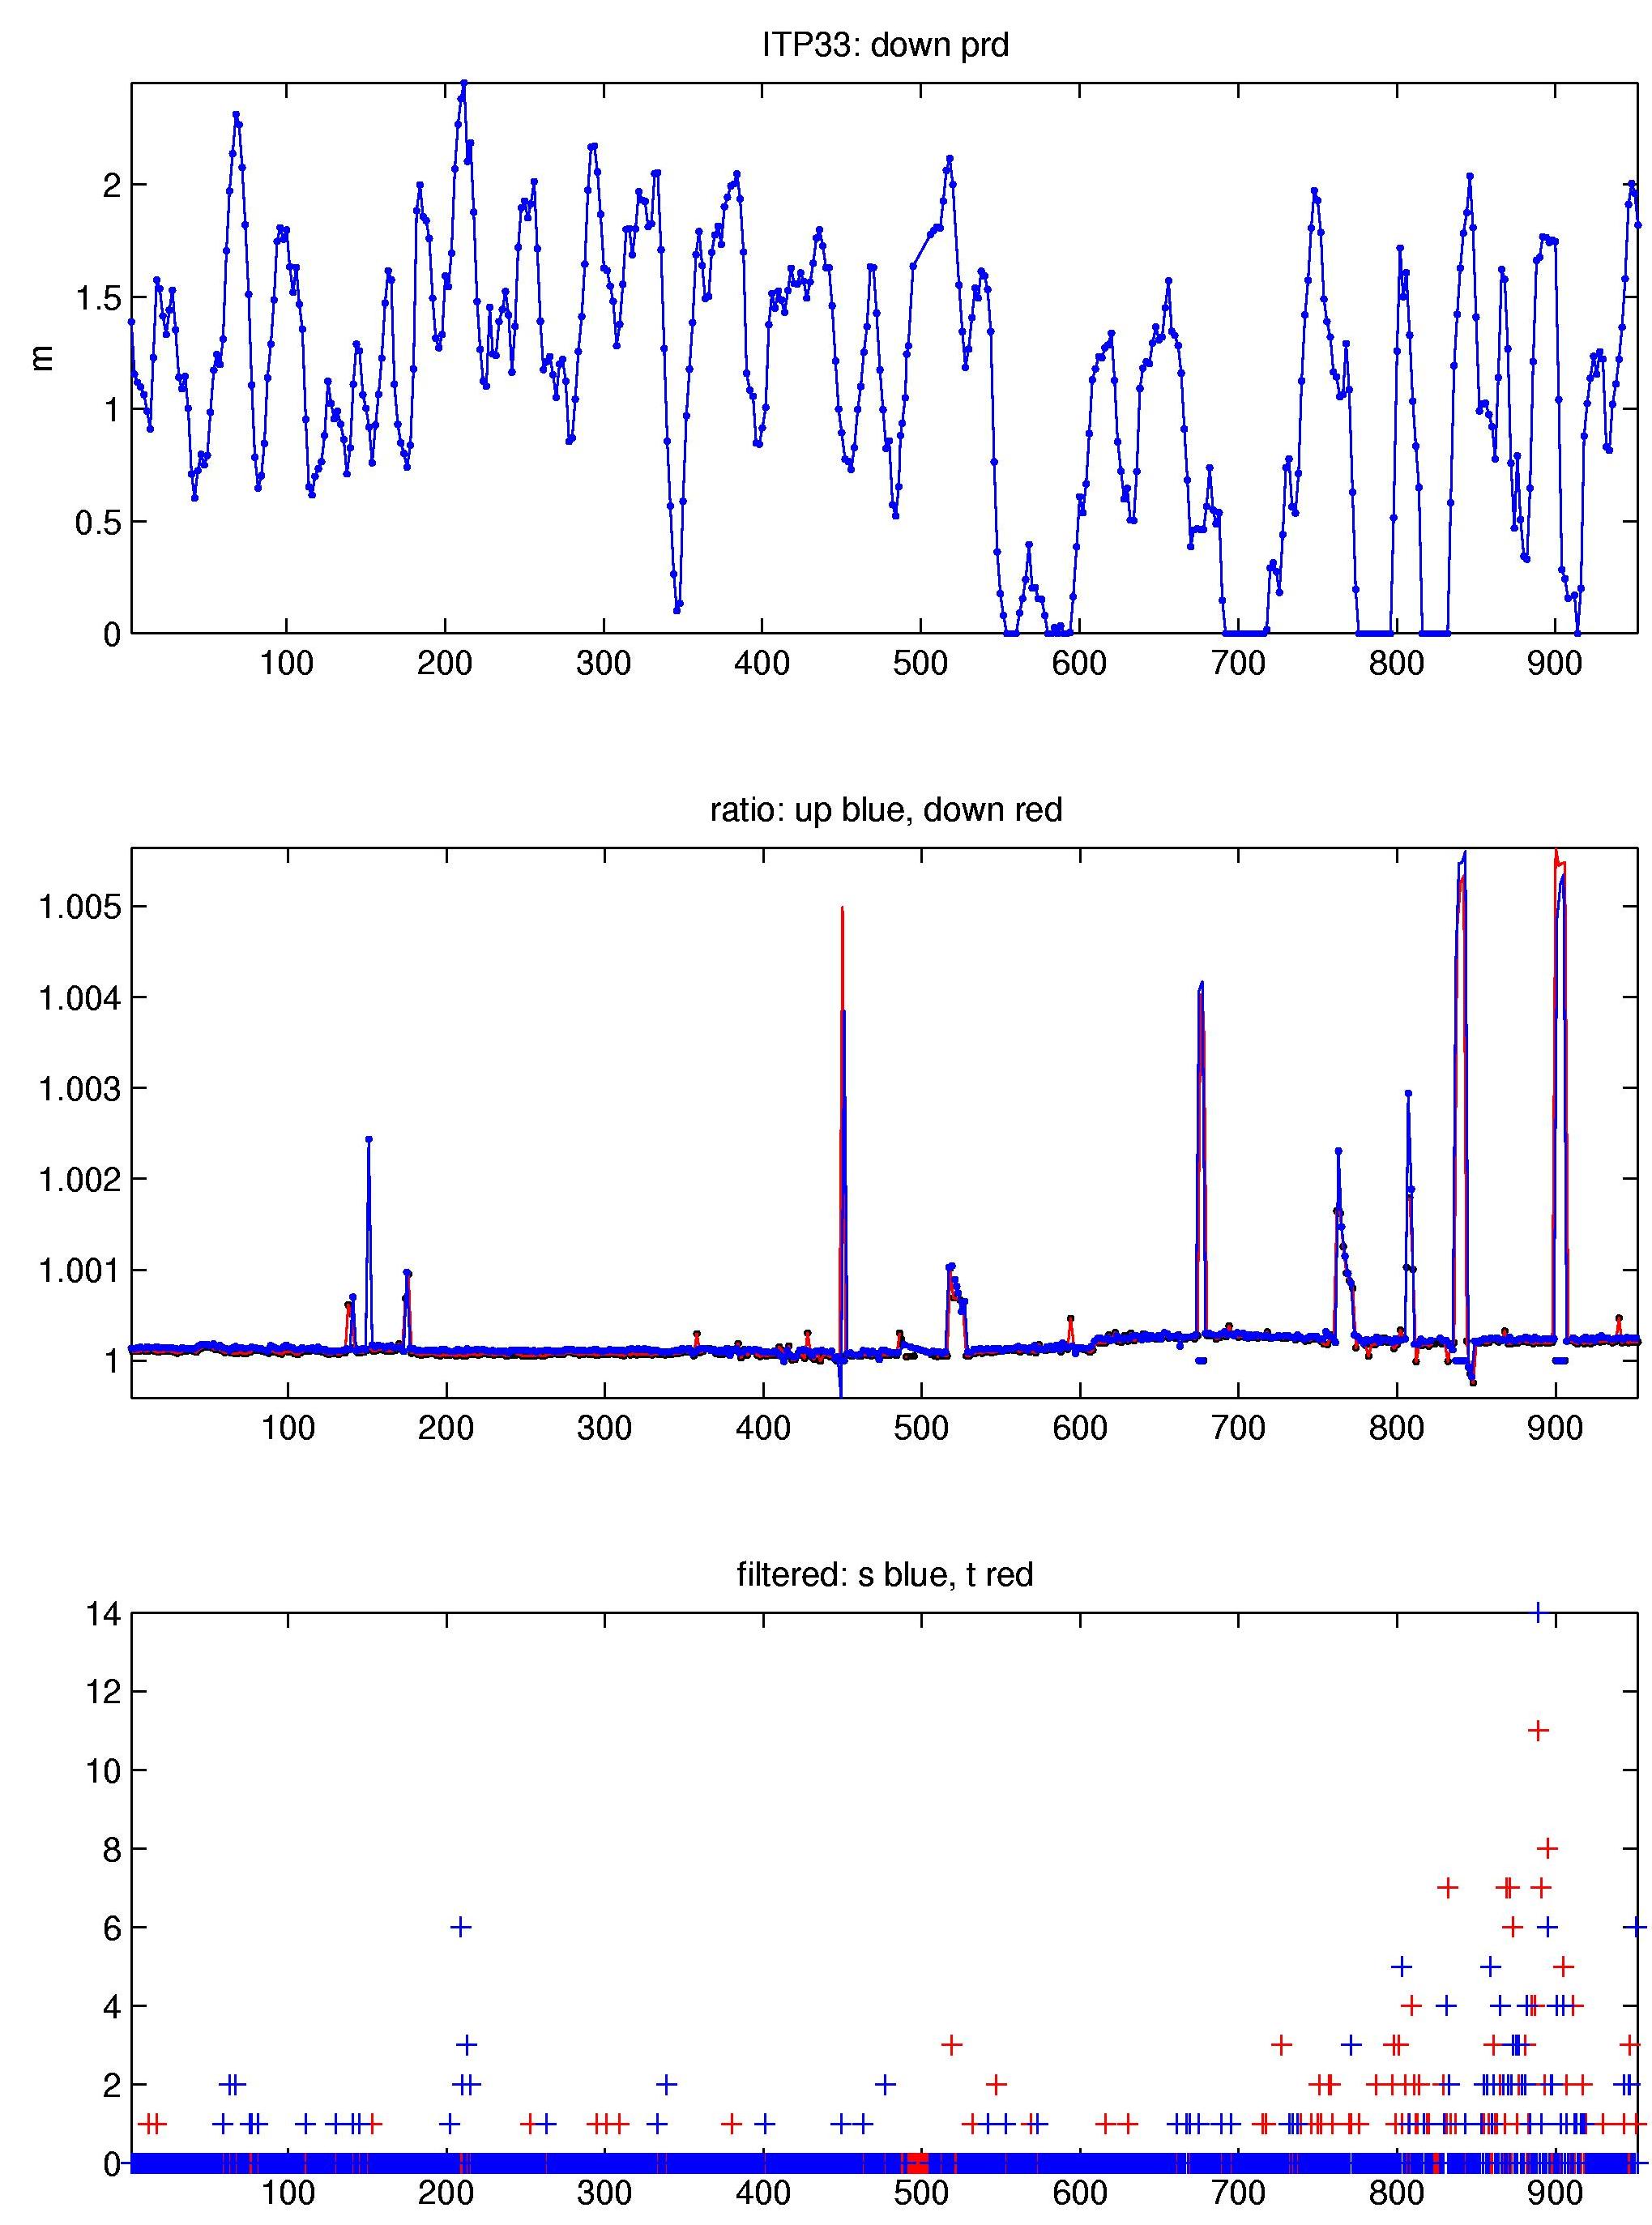
ITP33 transmitted 953 profiles from the time that it was deployed until January 25, 2011. These were processed according to the procedures described in the ITP Updated Data Processing Procedures. The processing parameters for this ITP are shown in the figures to the right. Buoy drift speeds stayed mostly between 10 and 20 cm/s, with a few spikes exceeding 40 cm/s.
As usual, some conductivity (salinity) data were affected by biofouling or similar glitches. However, they were relatively few here, most were short or even single bins, and none lasting over several profiles.
Thermohaline staircases were present for a large portion of the time series, enabling CTD lag corrections. The lags were in the typical range found for previous systems. During manual editing, thermal lag corrections were dialed back somewhat to remove overcompensation. The combination of Alpha = 0.11 and Tao = 4.5 worked well in most cases. There were few stair cases during the last 1/4 of the record. Previous settings were maintained here, though these profiles displayed less change when modifying alpha and tao. A few instances of the thermistor lag corrections ("tlag" in the code) were modified to better adjust sharp spikes at the top/bottom of stair cases. The conductivity - temperature time offsets ("cshift") were not modified from those calculated by the processing code.
The conductivity adjustment ("rat") remains fairly flat and close to unity for nearly the whole deployment, interrupted only for five to six short periods of larger adjustments for a small set of profiles ("rat spikes"). Presumably these adjustments were triggered by conductivity cell contaminations. The two highest ones (around profiles 150 and 805, respectively) also triggered editing of whole or portions of profiles. For example, following a subtle but clearly unusual change in TS around 585 dbar, most of profile 805 as well as profile 806 were edited out. The next several profiles received a (relatively) large calibration adjustment. At least one of them also showed a somewhat "different" TS signature at depth. While these profiles are most likely fine, I changed their quality flag from 3 to 1 ("good" to "questionable"). The lower amplitude rat spikes (e.g., around profile 175 and 520) modified the affected profiles such that they fit in well with their surroundings, and little or no further editing was required. A number of the smaller deviations in the calibration time series were smoothed out when values closer to a running mean brought the profiles better in line with the deep TS pattern.
See the Data Products tab to the left for descriptions of the three levels (I, II, III) of data processing and to access all data.
