ITP 8 Data Description
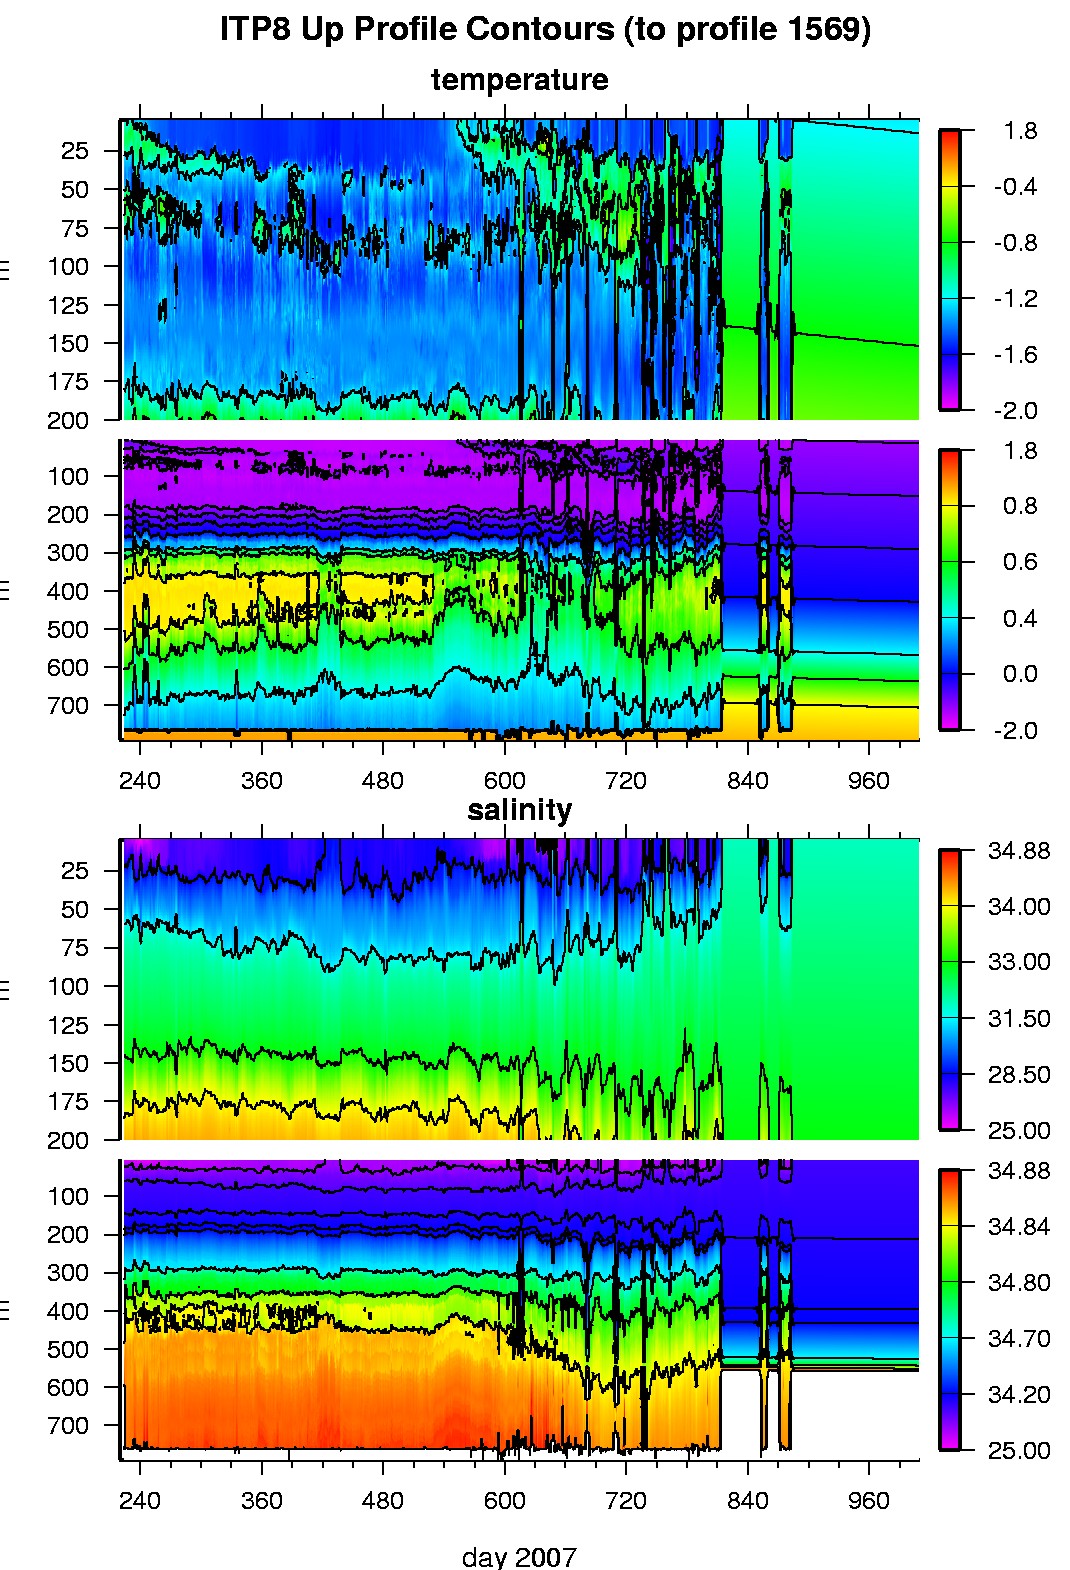
The ITP profiler was configured to operate with a standard sampling schedule of 2 one-way profiles between 7 and 760 m depth each day and the GPS receiver was powered every hour to obtain locations, and buoy temperature and battery voltage status were recorded. Full vertical profiler data was reliably acquired and transmitted for the first 707 profiles (354 days) until an apparent problem with the inductive modem communications prevented data exchange between the underwater and surface packages. However, the surface package continued to transmit GPS locations and status, and the profiler continued to ring the surface unit after every attempted profile up until July 30, 2009. Upon retrieval of the instrument, data from an additional 862 attempted profiles was recovered.
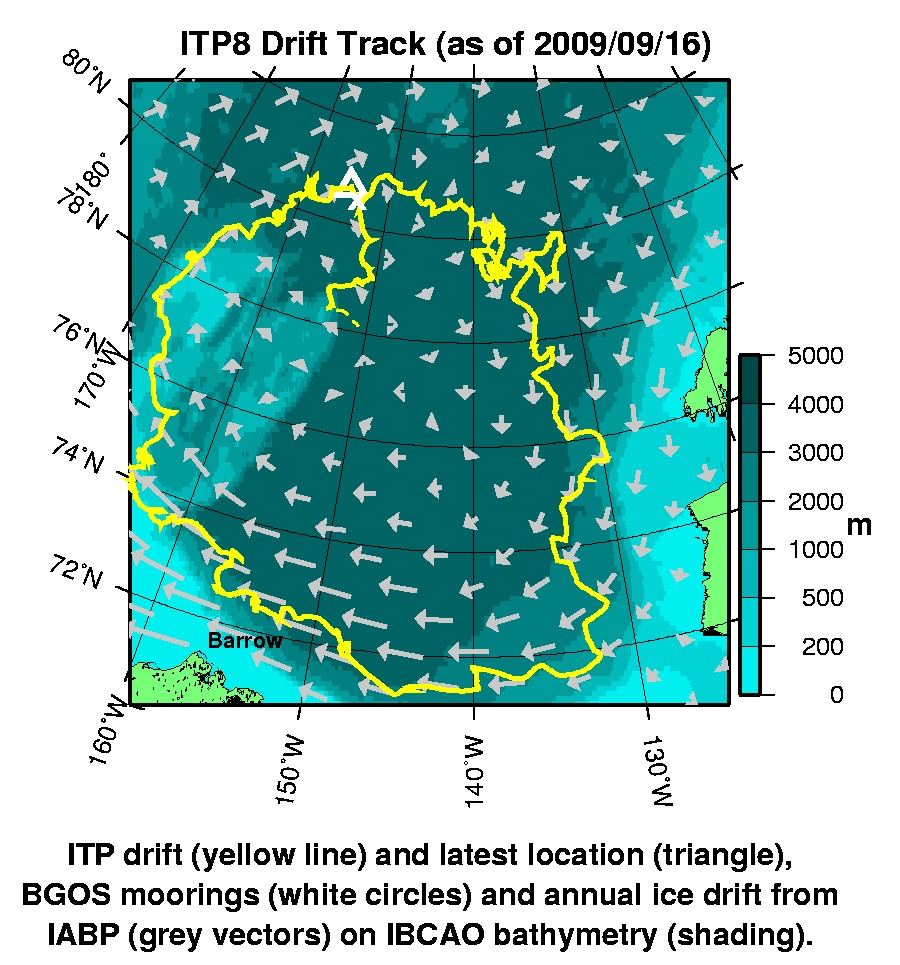
Over the two year period, the ITP encircled the perimeter of the anticyclonic Beaufort Gyre. Eddies are not prevalent in the time series, although there are some different characteristics in the water column when the system drifted from east to west along the southern slope in the Beaufort Sea. The system avoided the shelf region near Barrow, Alaska, but encountered shallow bathymetry between March 24 and May 1, 2009 and between May 9 and May 20, 2009 along the Chukchi shelf region, and dragged over the Chukchi Plateau on May 31, 2009.
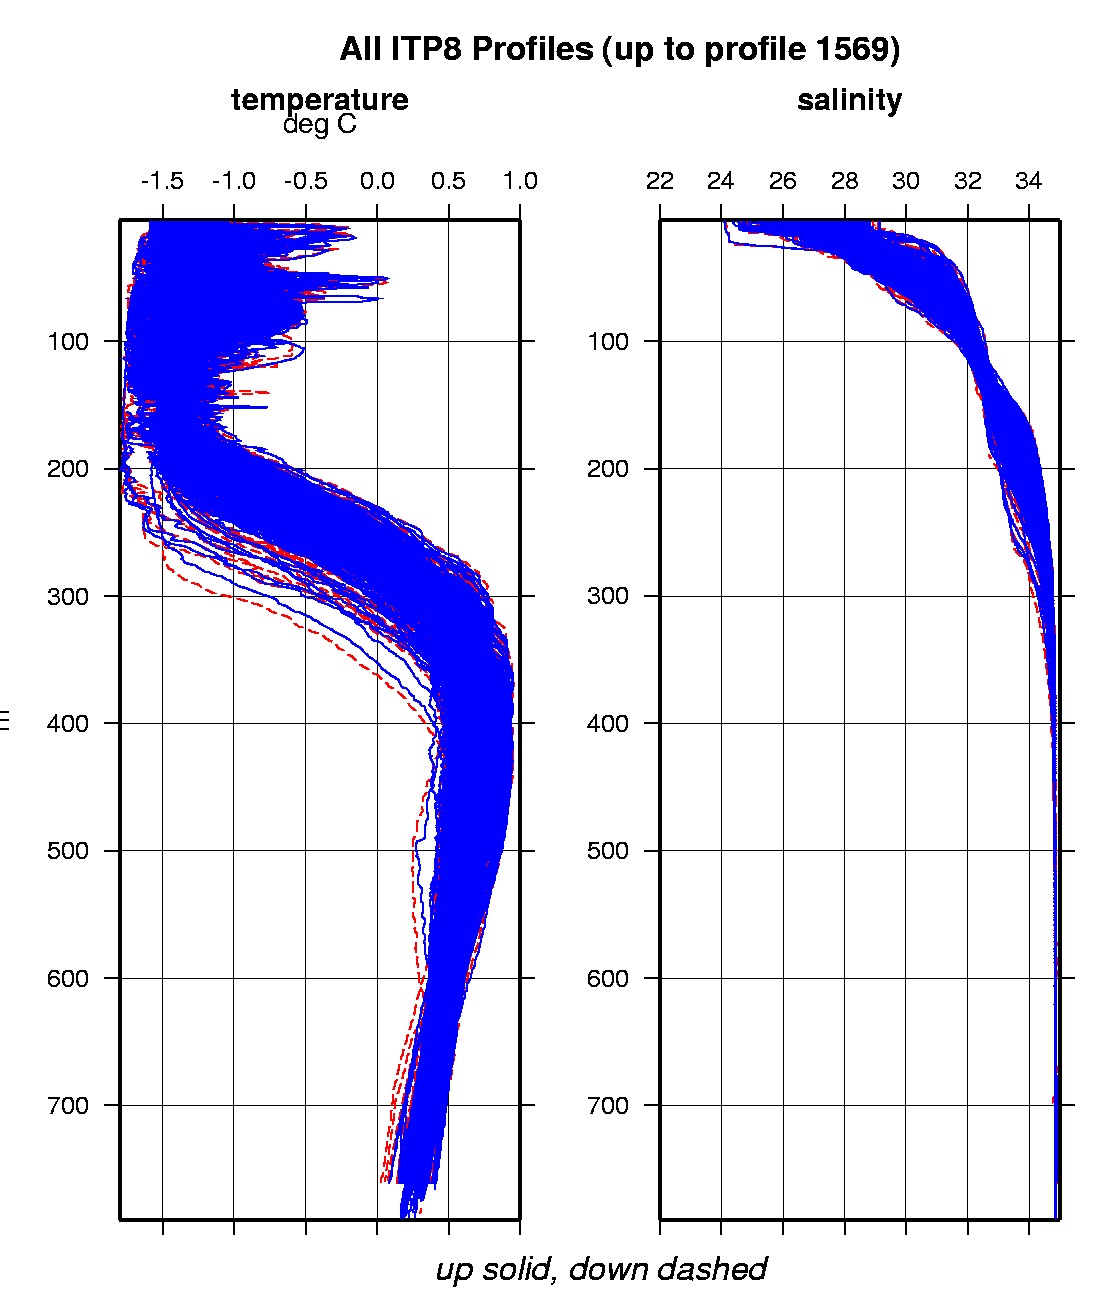
The plots to the right are of the final, calibrated, edited data (as opposed to the raw data presented on the active instrument pages).
See the Data Products tab to the left for descriptions of the three levels (I, II, III) of data processing and to access all data.
ITP 8 data can also be found at the links below:
Level II hourly buoy location data in ASCII format: itp8rawlocs.dat
Level III 1-Hz processed profile data in MATLAB format: itp8cormat.tar.Z and itp8cormat.zip
Level III 1-db bin-averaged processed profile data in MATLAB format: itp8final.mat
Level III 1-db bin-averaged processed profile data in ASCII format: itp8final.tar.Z and itp8final.zip


