ITP 7 Data Processing
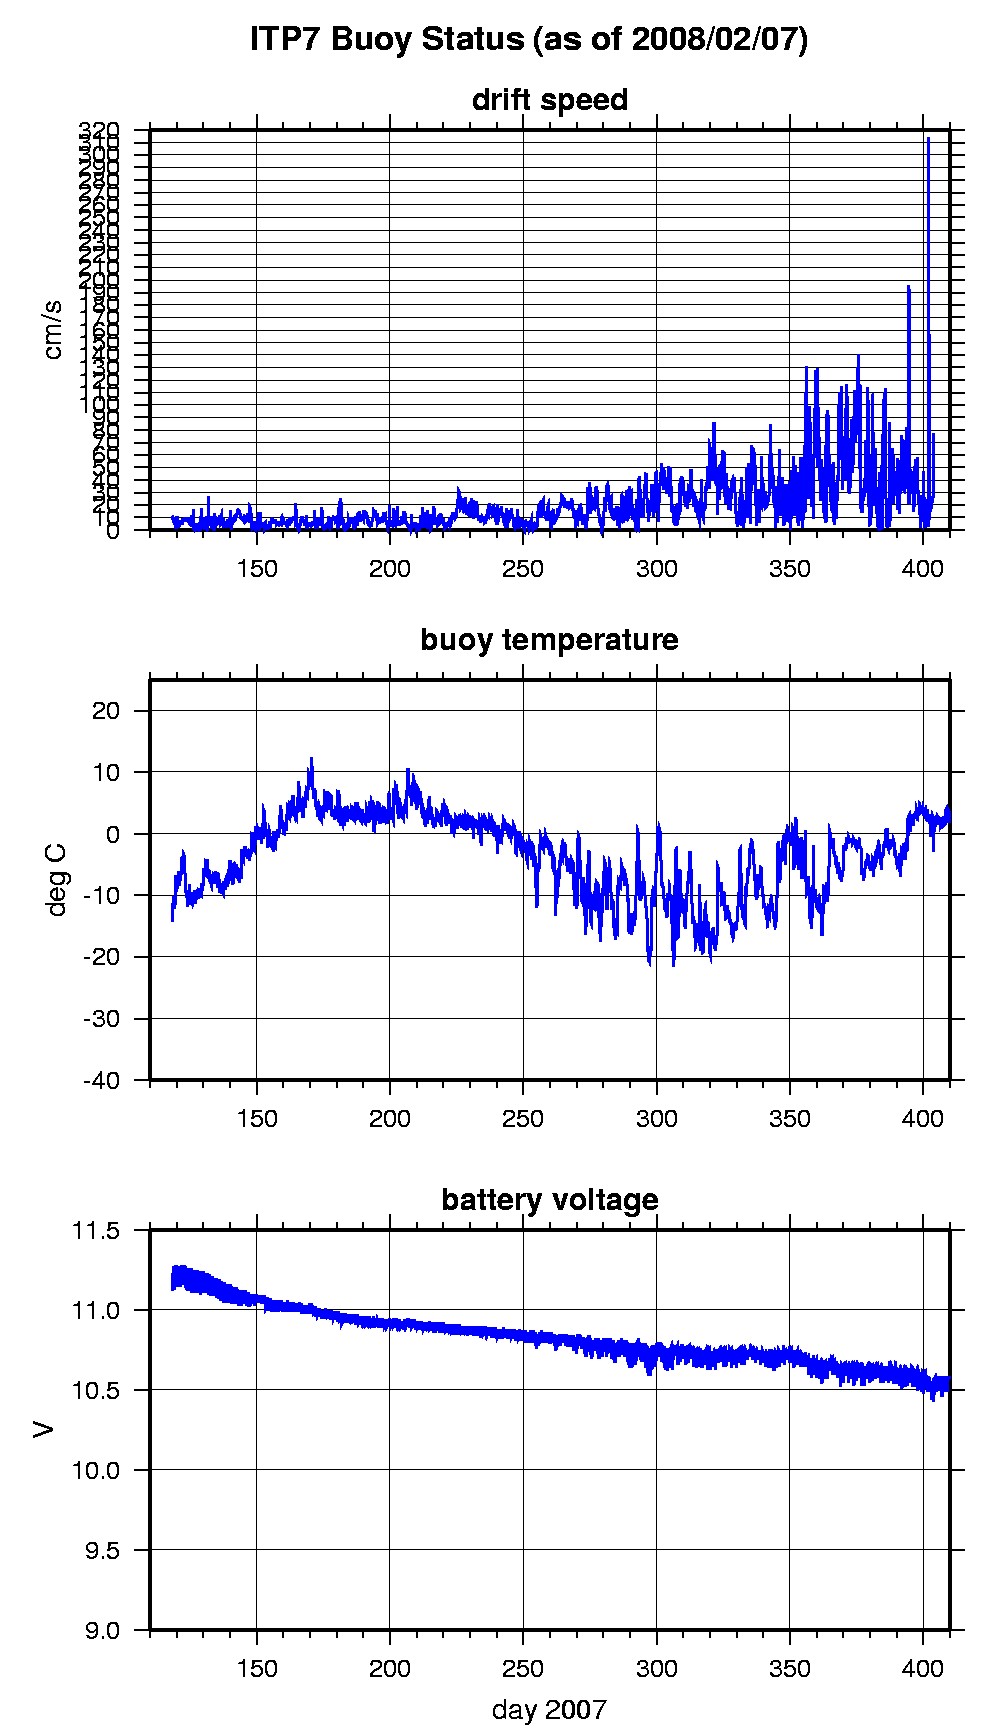
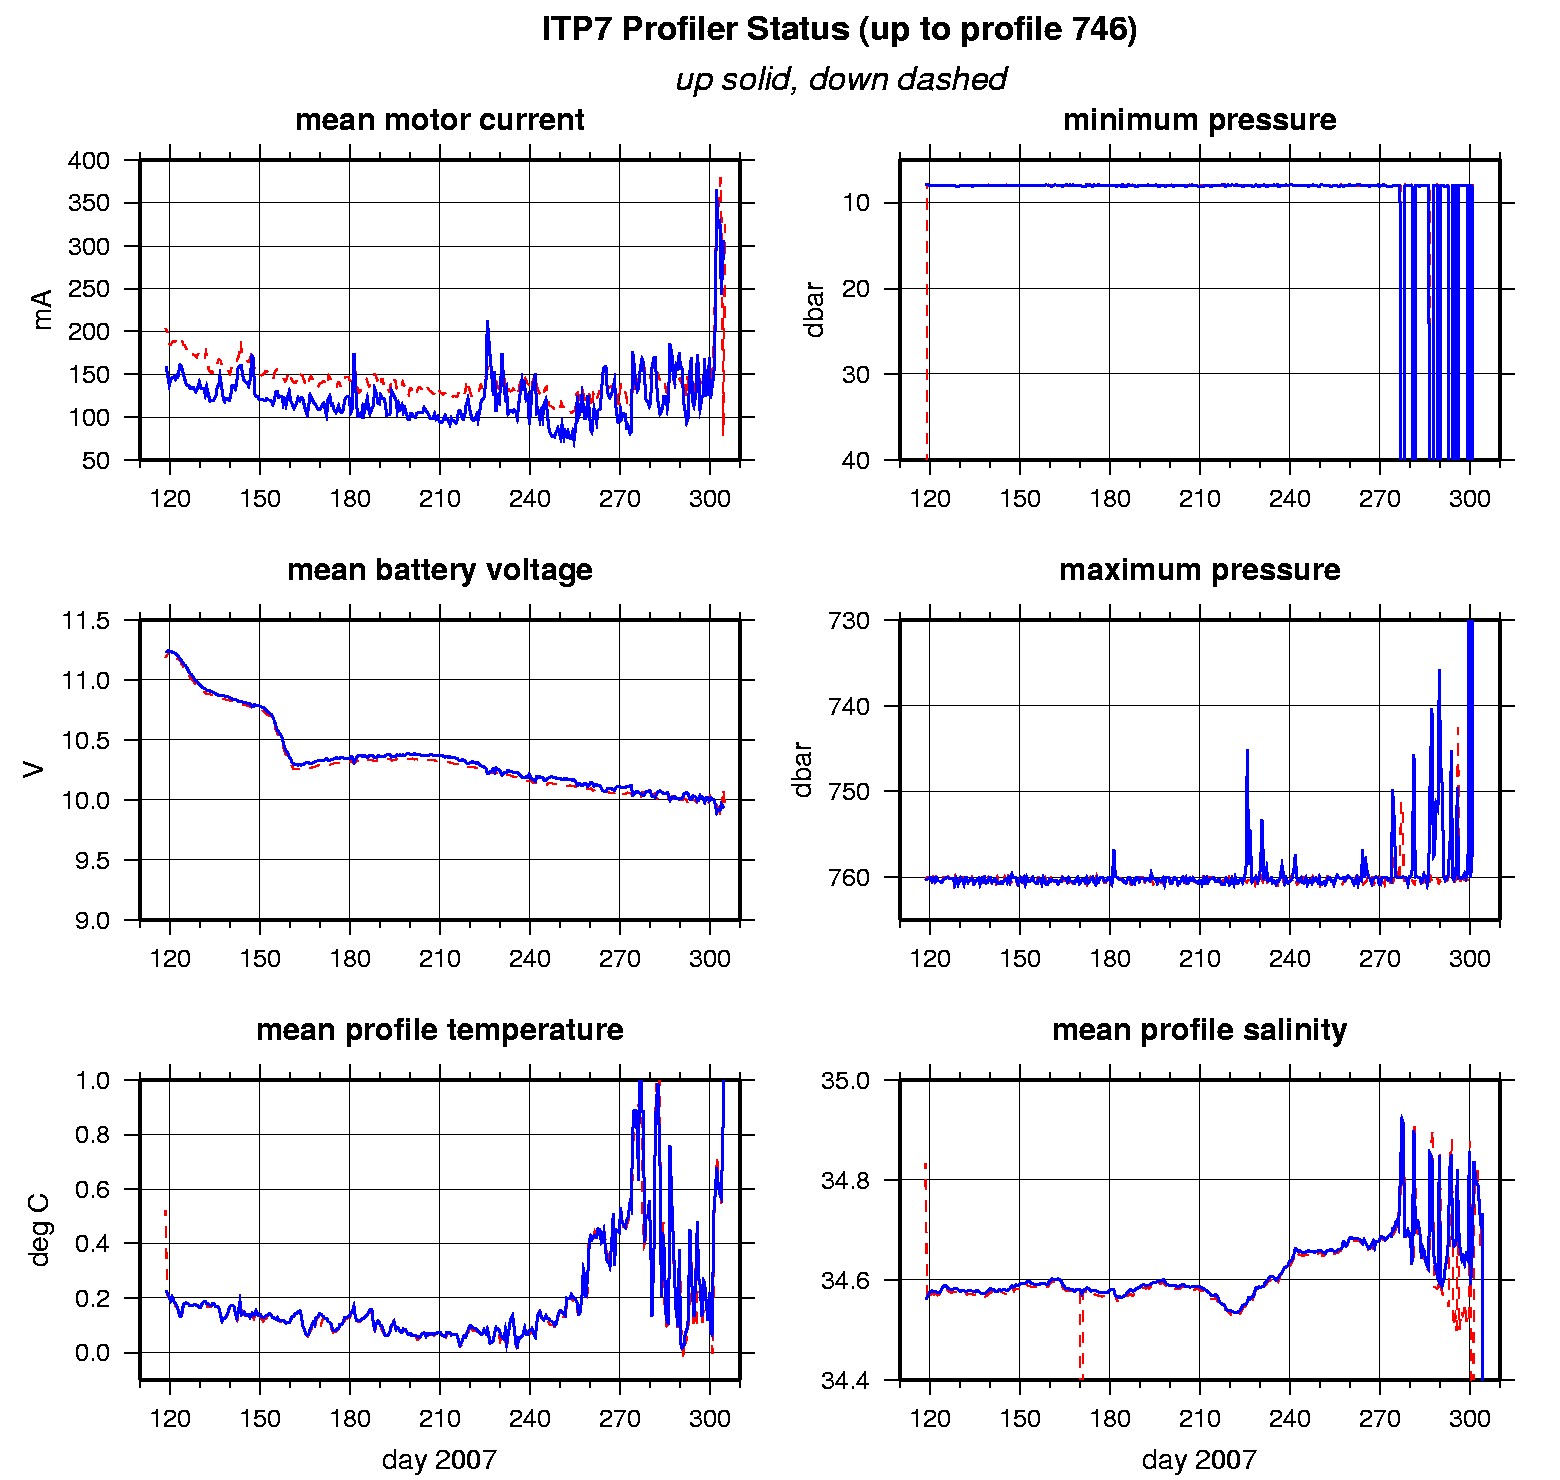
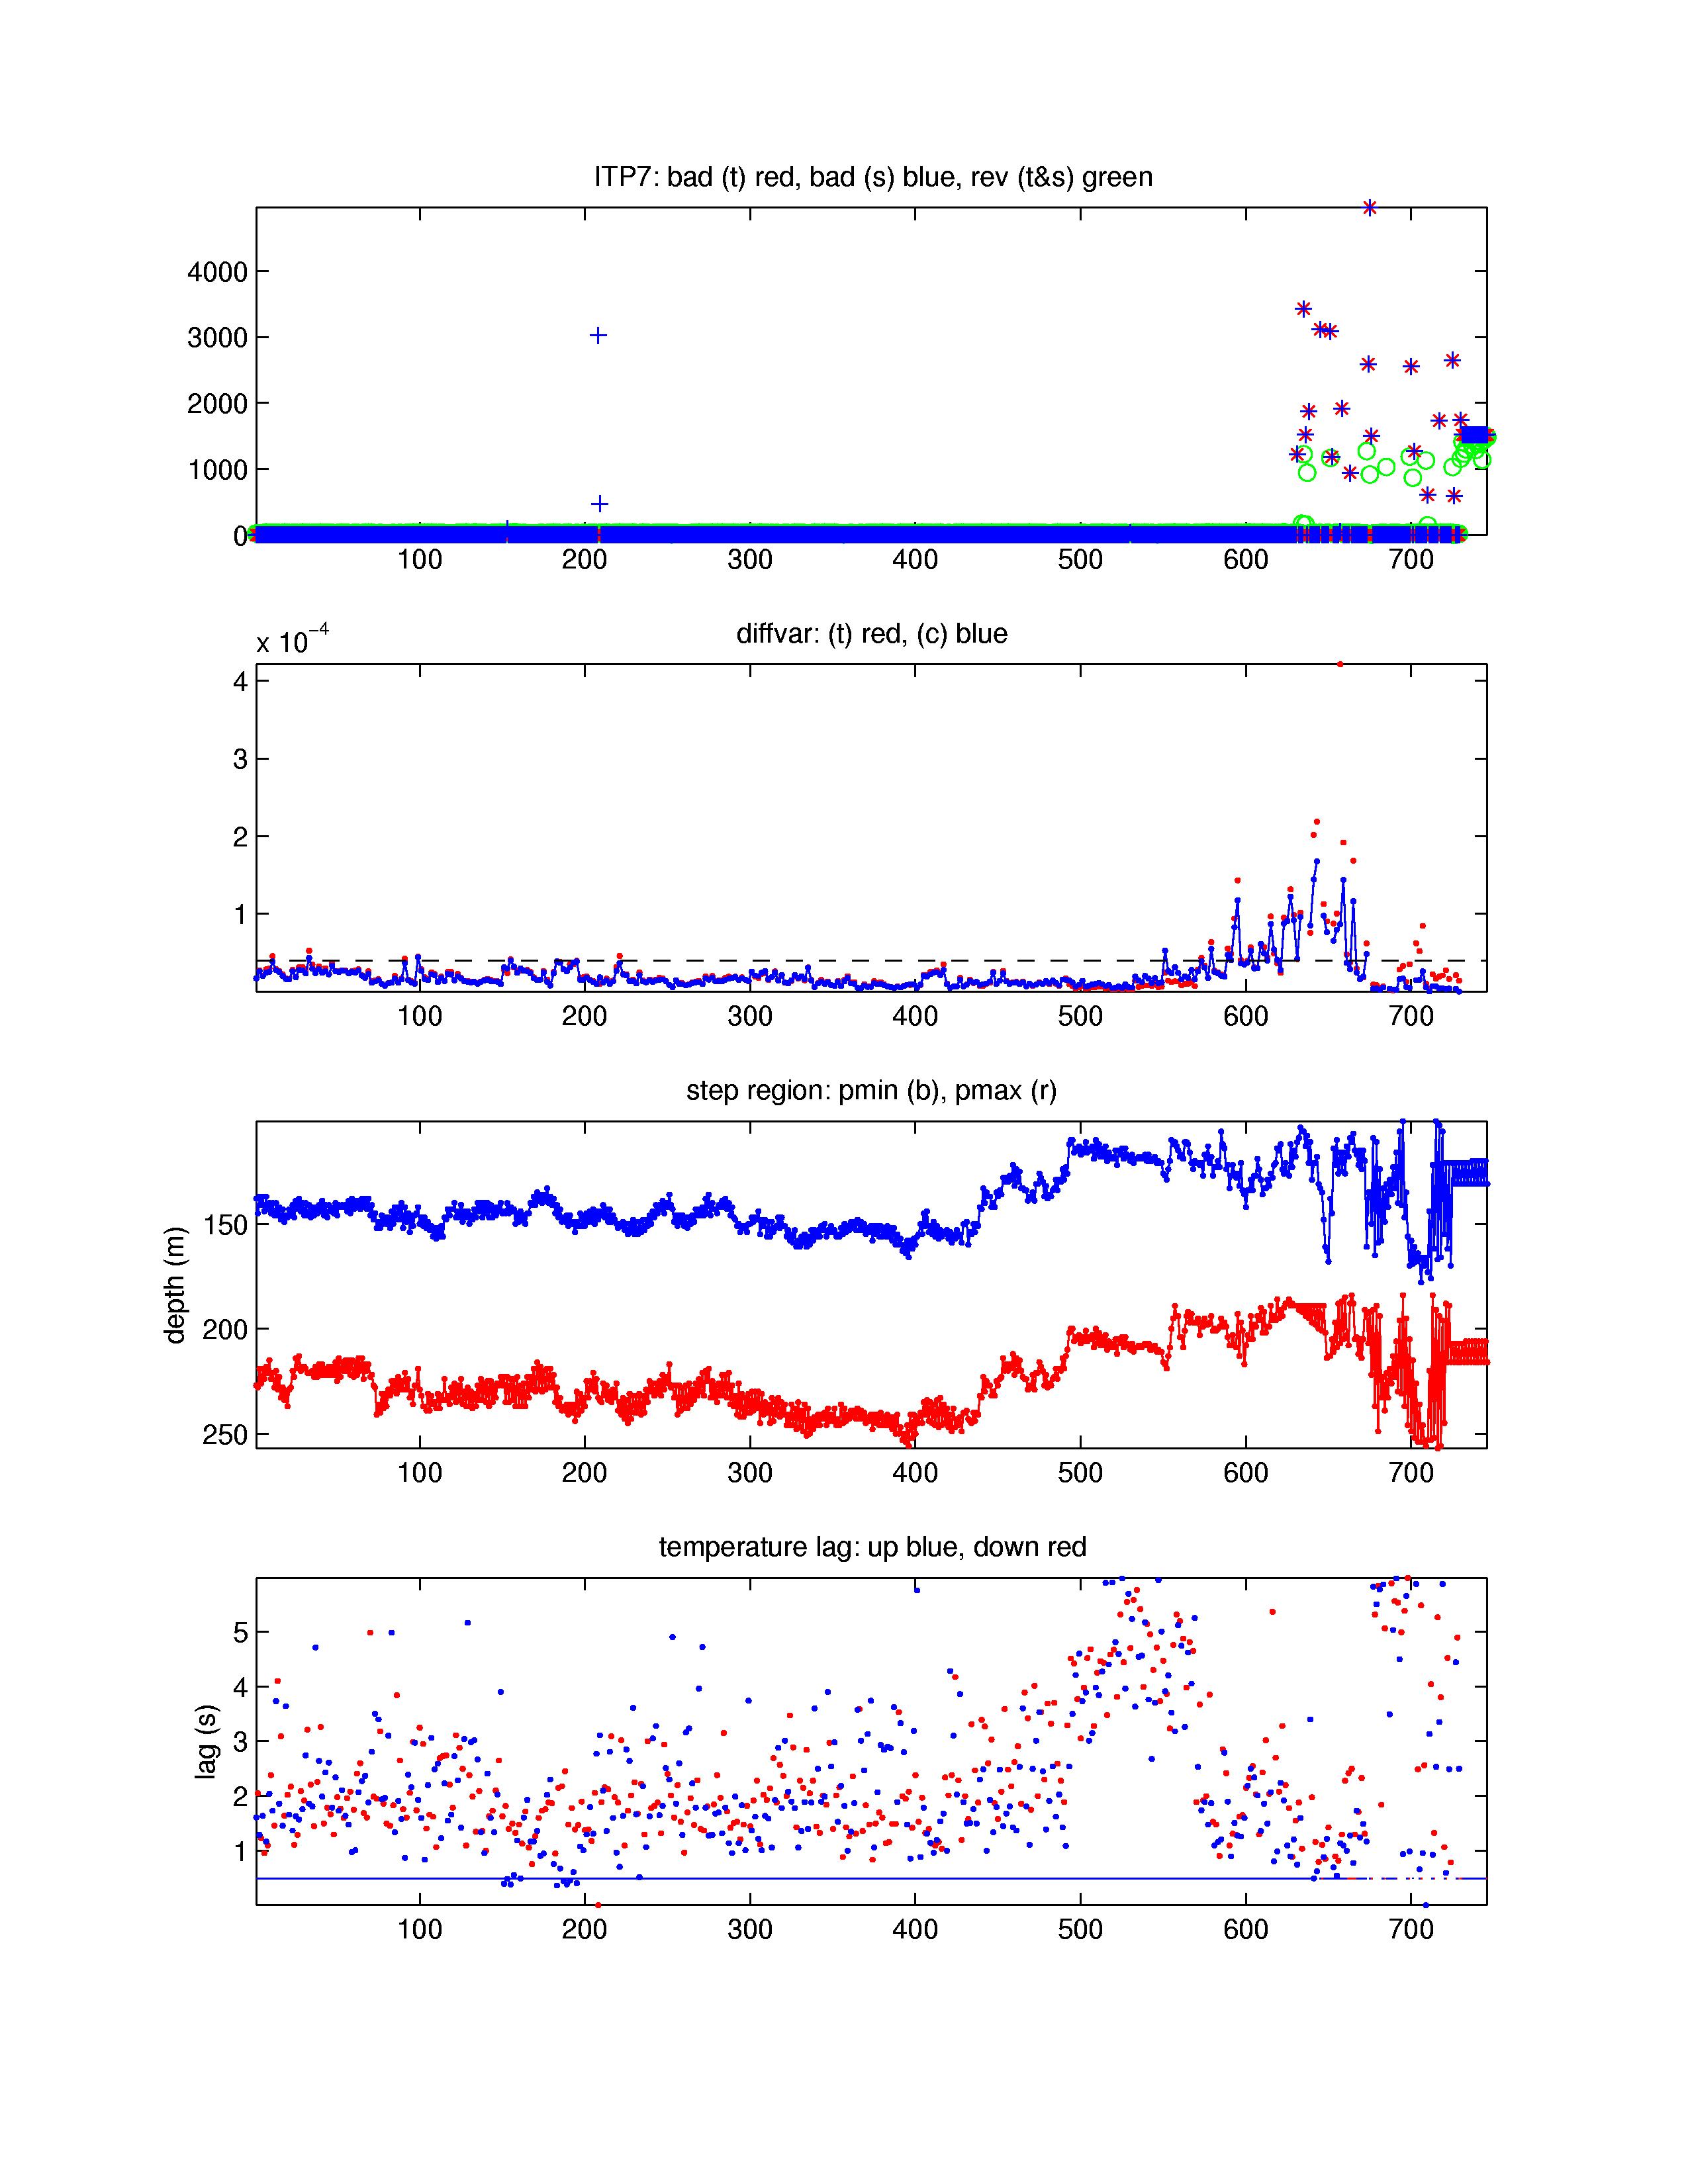
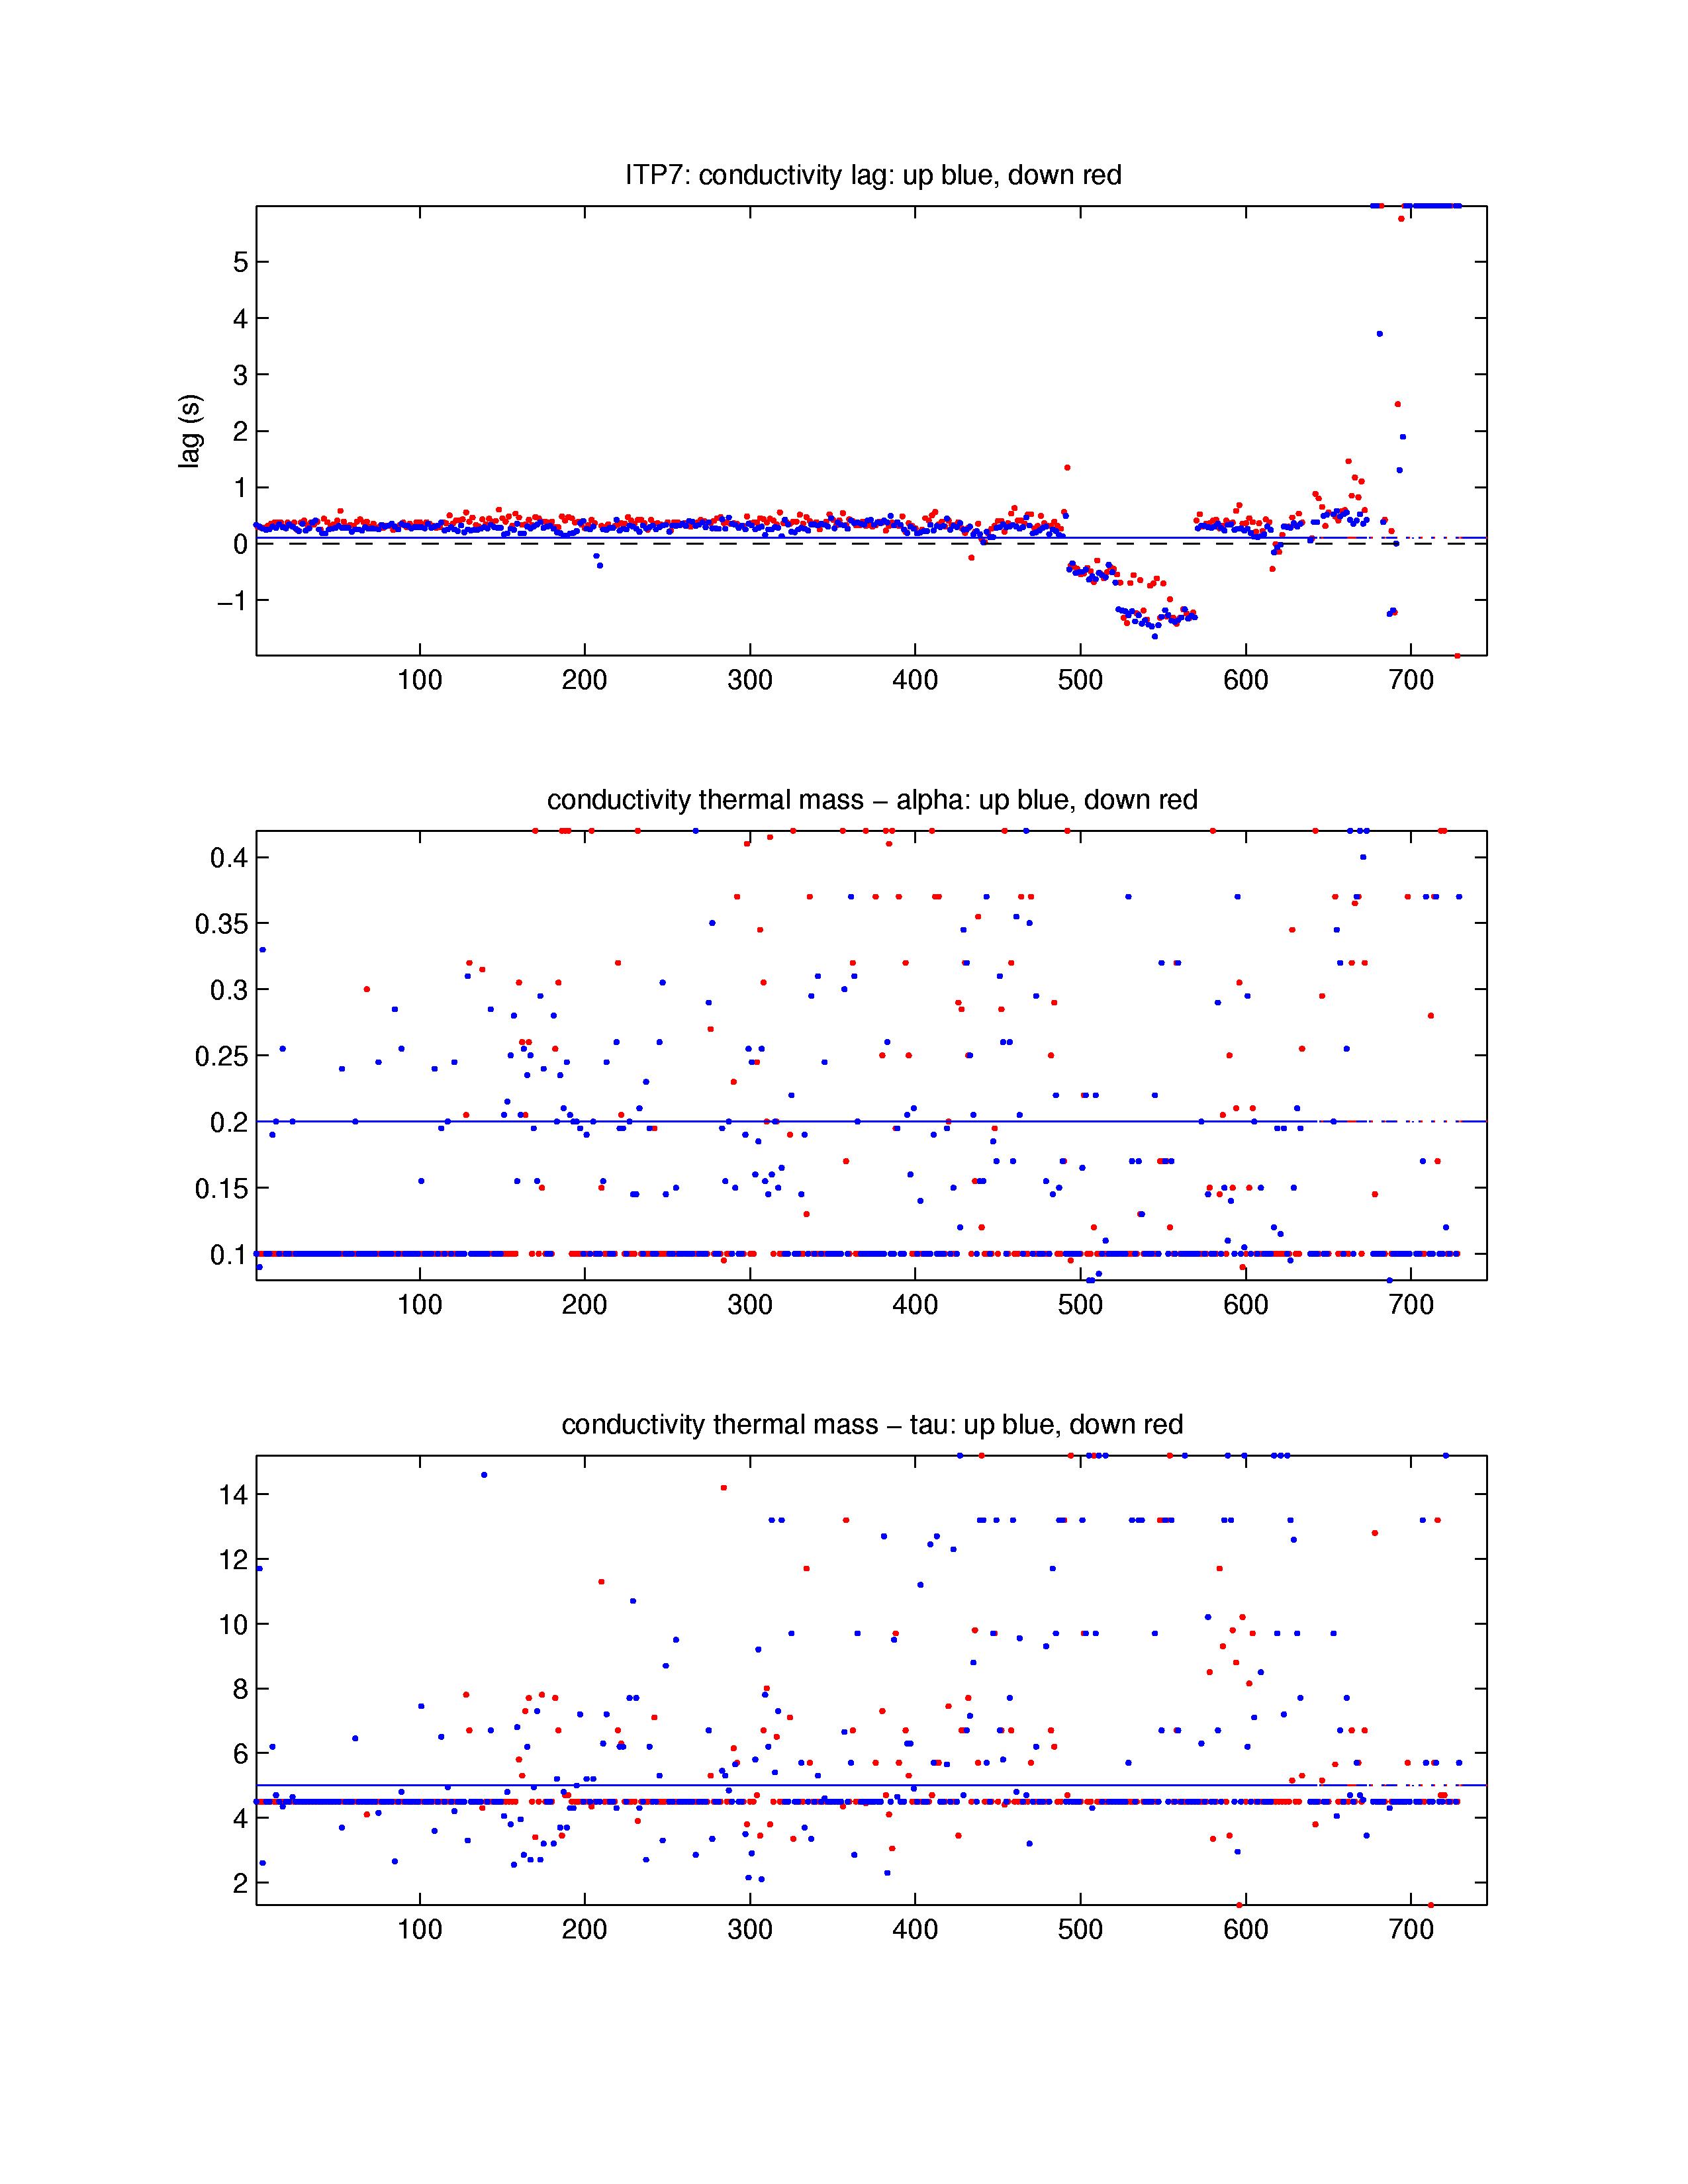
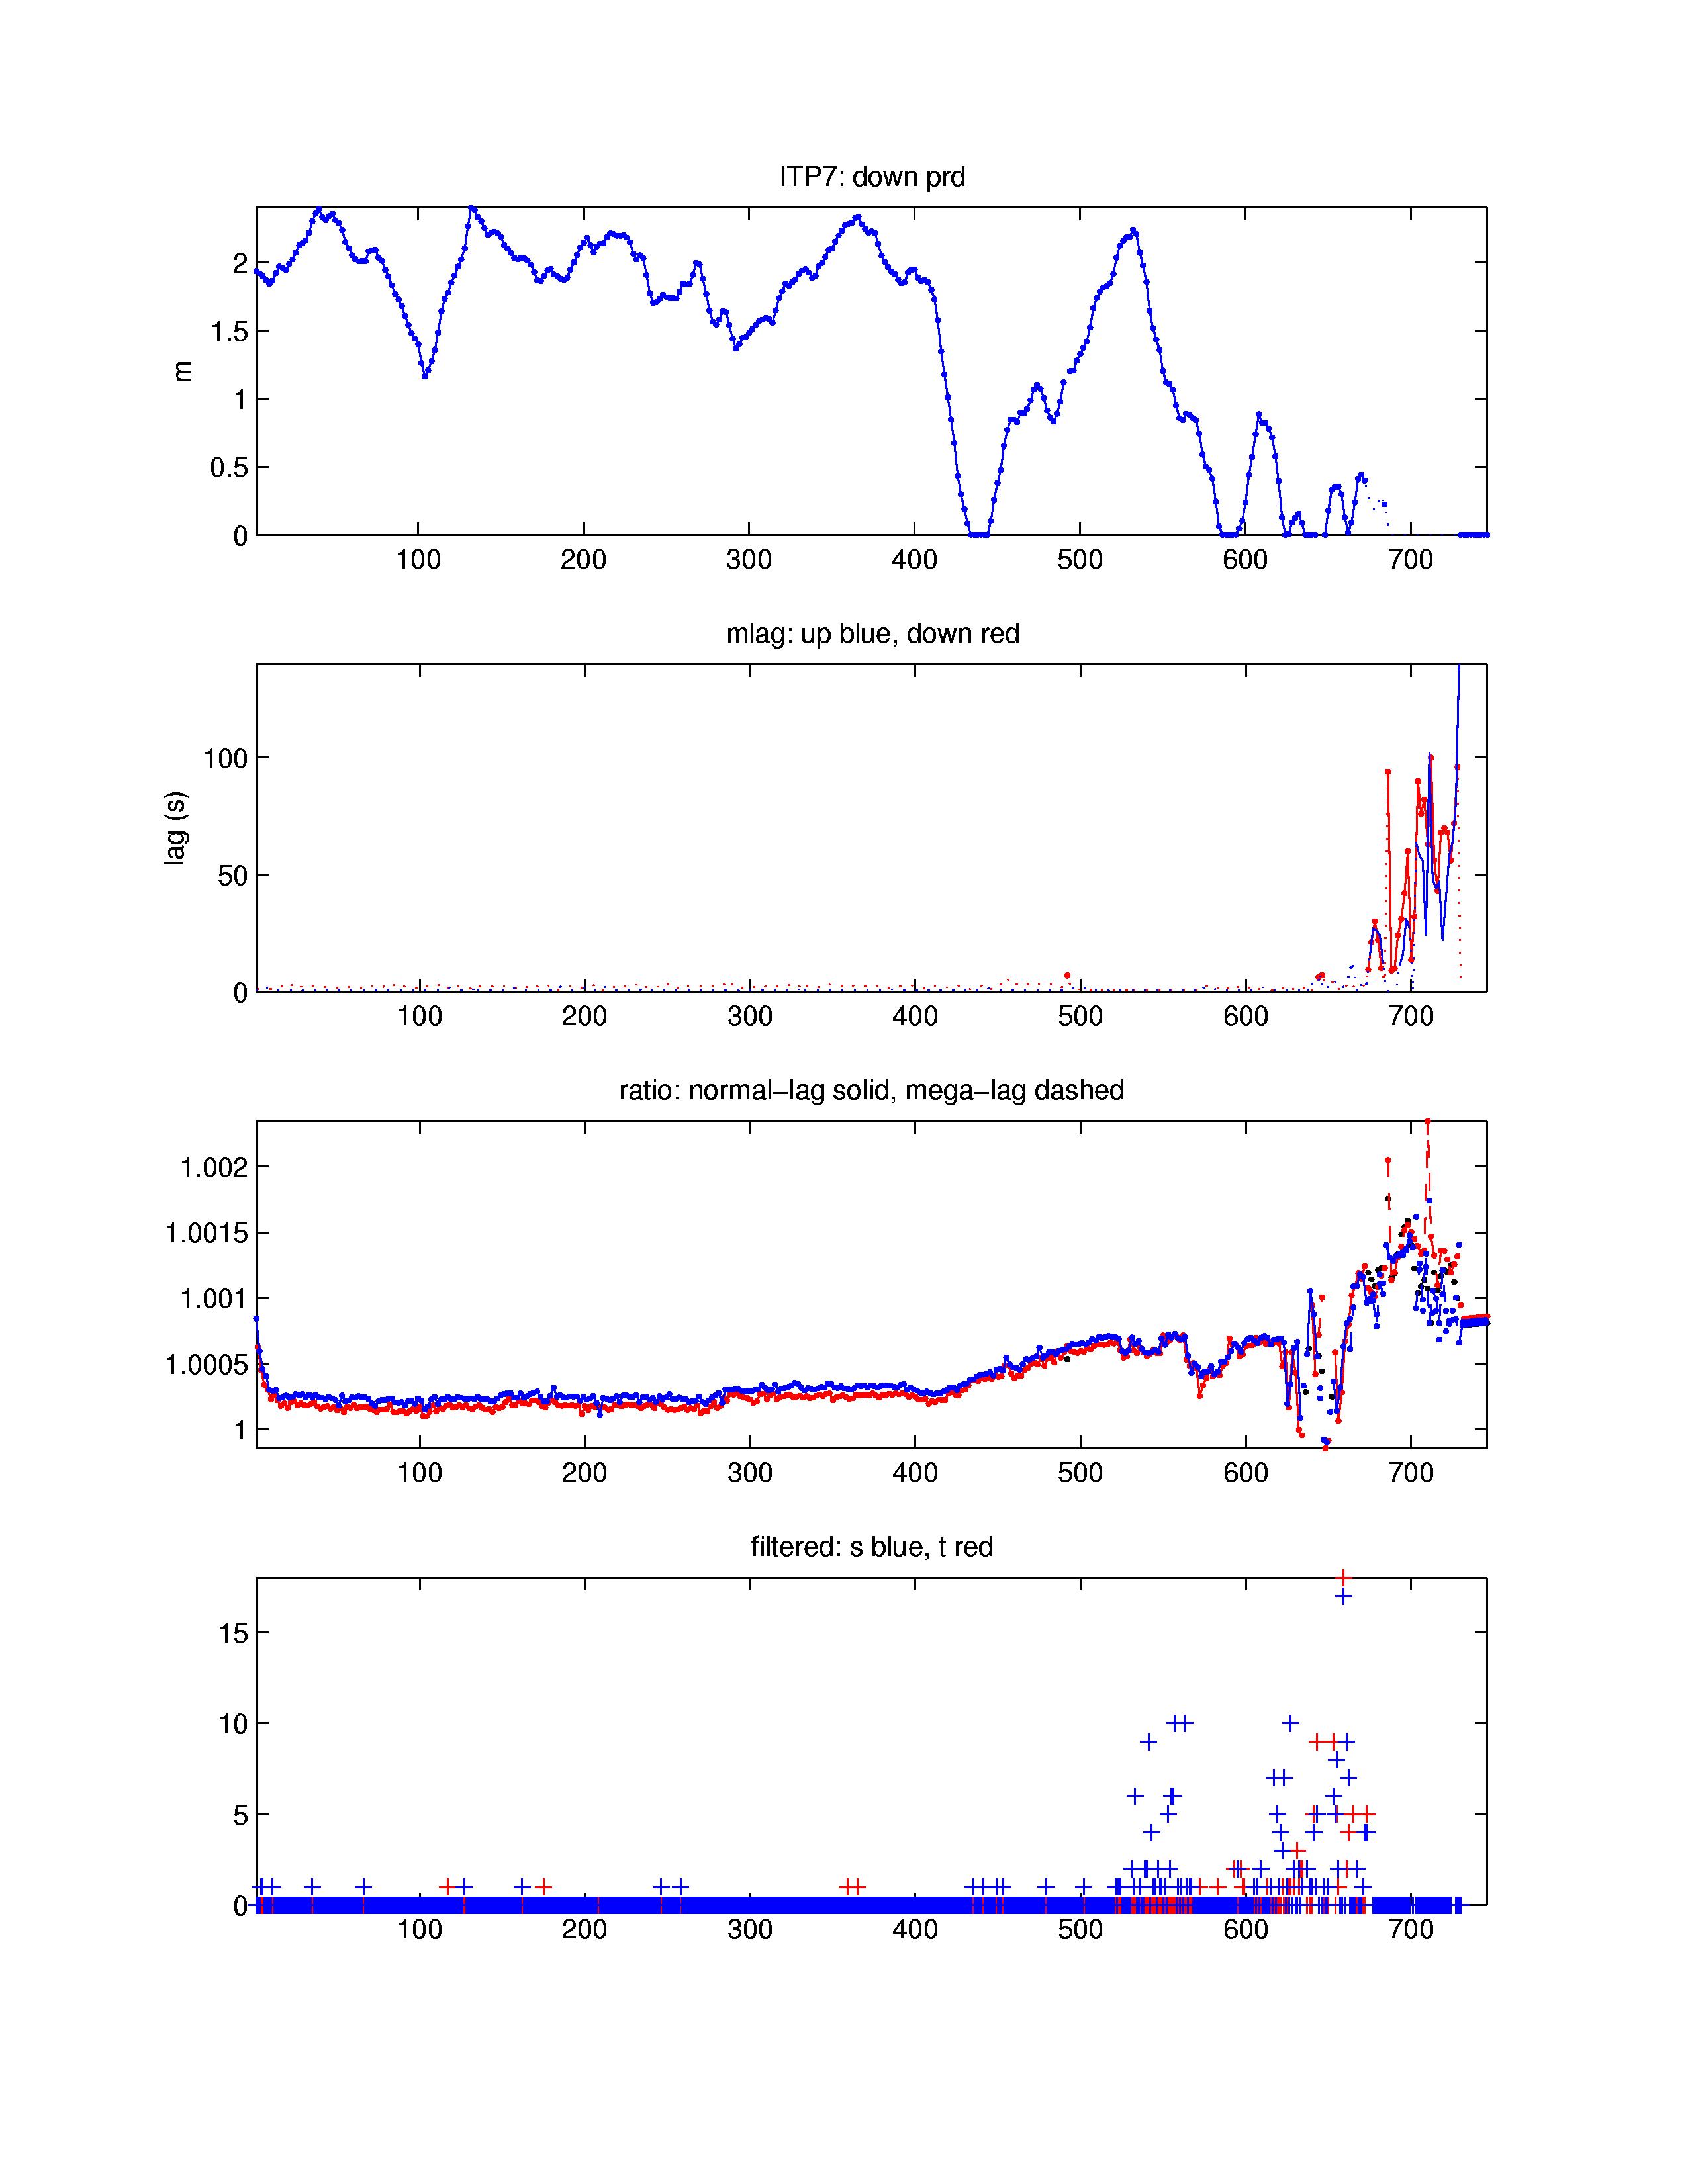
The 746 profiles that were obtained from ITP 7 were processed according to the procedures described in ITP Updated Data Processing Procedures. The processing parameters are shown in the figures to the right. Unlike previous ITPs in the western Arctic Ocean, thermohaline staircases for computing sensor lags are absent, so default lag constants were used to produce the final data. The speed of the platform increased after about profile 550 (as it passed through Fram Strait), so that the profiler had more frequent difficulties completing full profiles vertically. After profile 635, increasingly larger lags are needed to correct the T & S data, as an apparent major clog or pumping problem seemingly delayed the rate of the seawater passing the sensors by a few seconds initially and later by over a minute (compared to 0.5 second typical lag). An updated processing procedure to compute the "mega-lag" is implemented to tune these profiles based on comparison in T-S space through the halocline with last known good profiles. Typical Johnson et al. (2007) lag constants are not used when applying the mega-lag procedure, and the pressure lags between consecutive up and down profiles remain uncorrected. The larger lags smooth the signal and reduce the precision in the estimates, so the corrected data after profile 646 are of lesser quality, but may be useful for some applications.
The profiler hovered around 700 m depth on profiles 725 and 726, and around 300 m depth on profiles 732 through 746 (presumably due the mooring wire and anchor dragging on the bottom) so there are no profile data for those profiles. In the final product, 4% of the temperature and conductivity profiles (number 208 and 29 others after profile 635) were flagged as completely bad due to sensor fouling or pump failure, and another 7.5% (or 56) were corrected for large lags. The apparent constriction of flow past the sensor (lag) was progressively worse at the end of the record when the ITP drifted through Fram Strait and dragged on the East Greenland Shelf, and are probably related to drift speed, freezing in the colder East Greenland water, and/or bio-fouling.
See the Data Products tab to the left for descriptions of the three levels (I, II, III) of data processing and to access all data.
