ITP 8 Data Processing
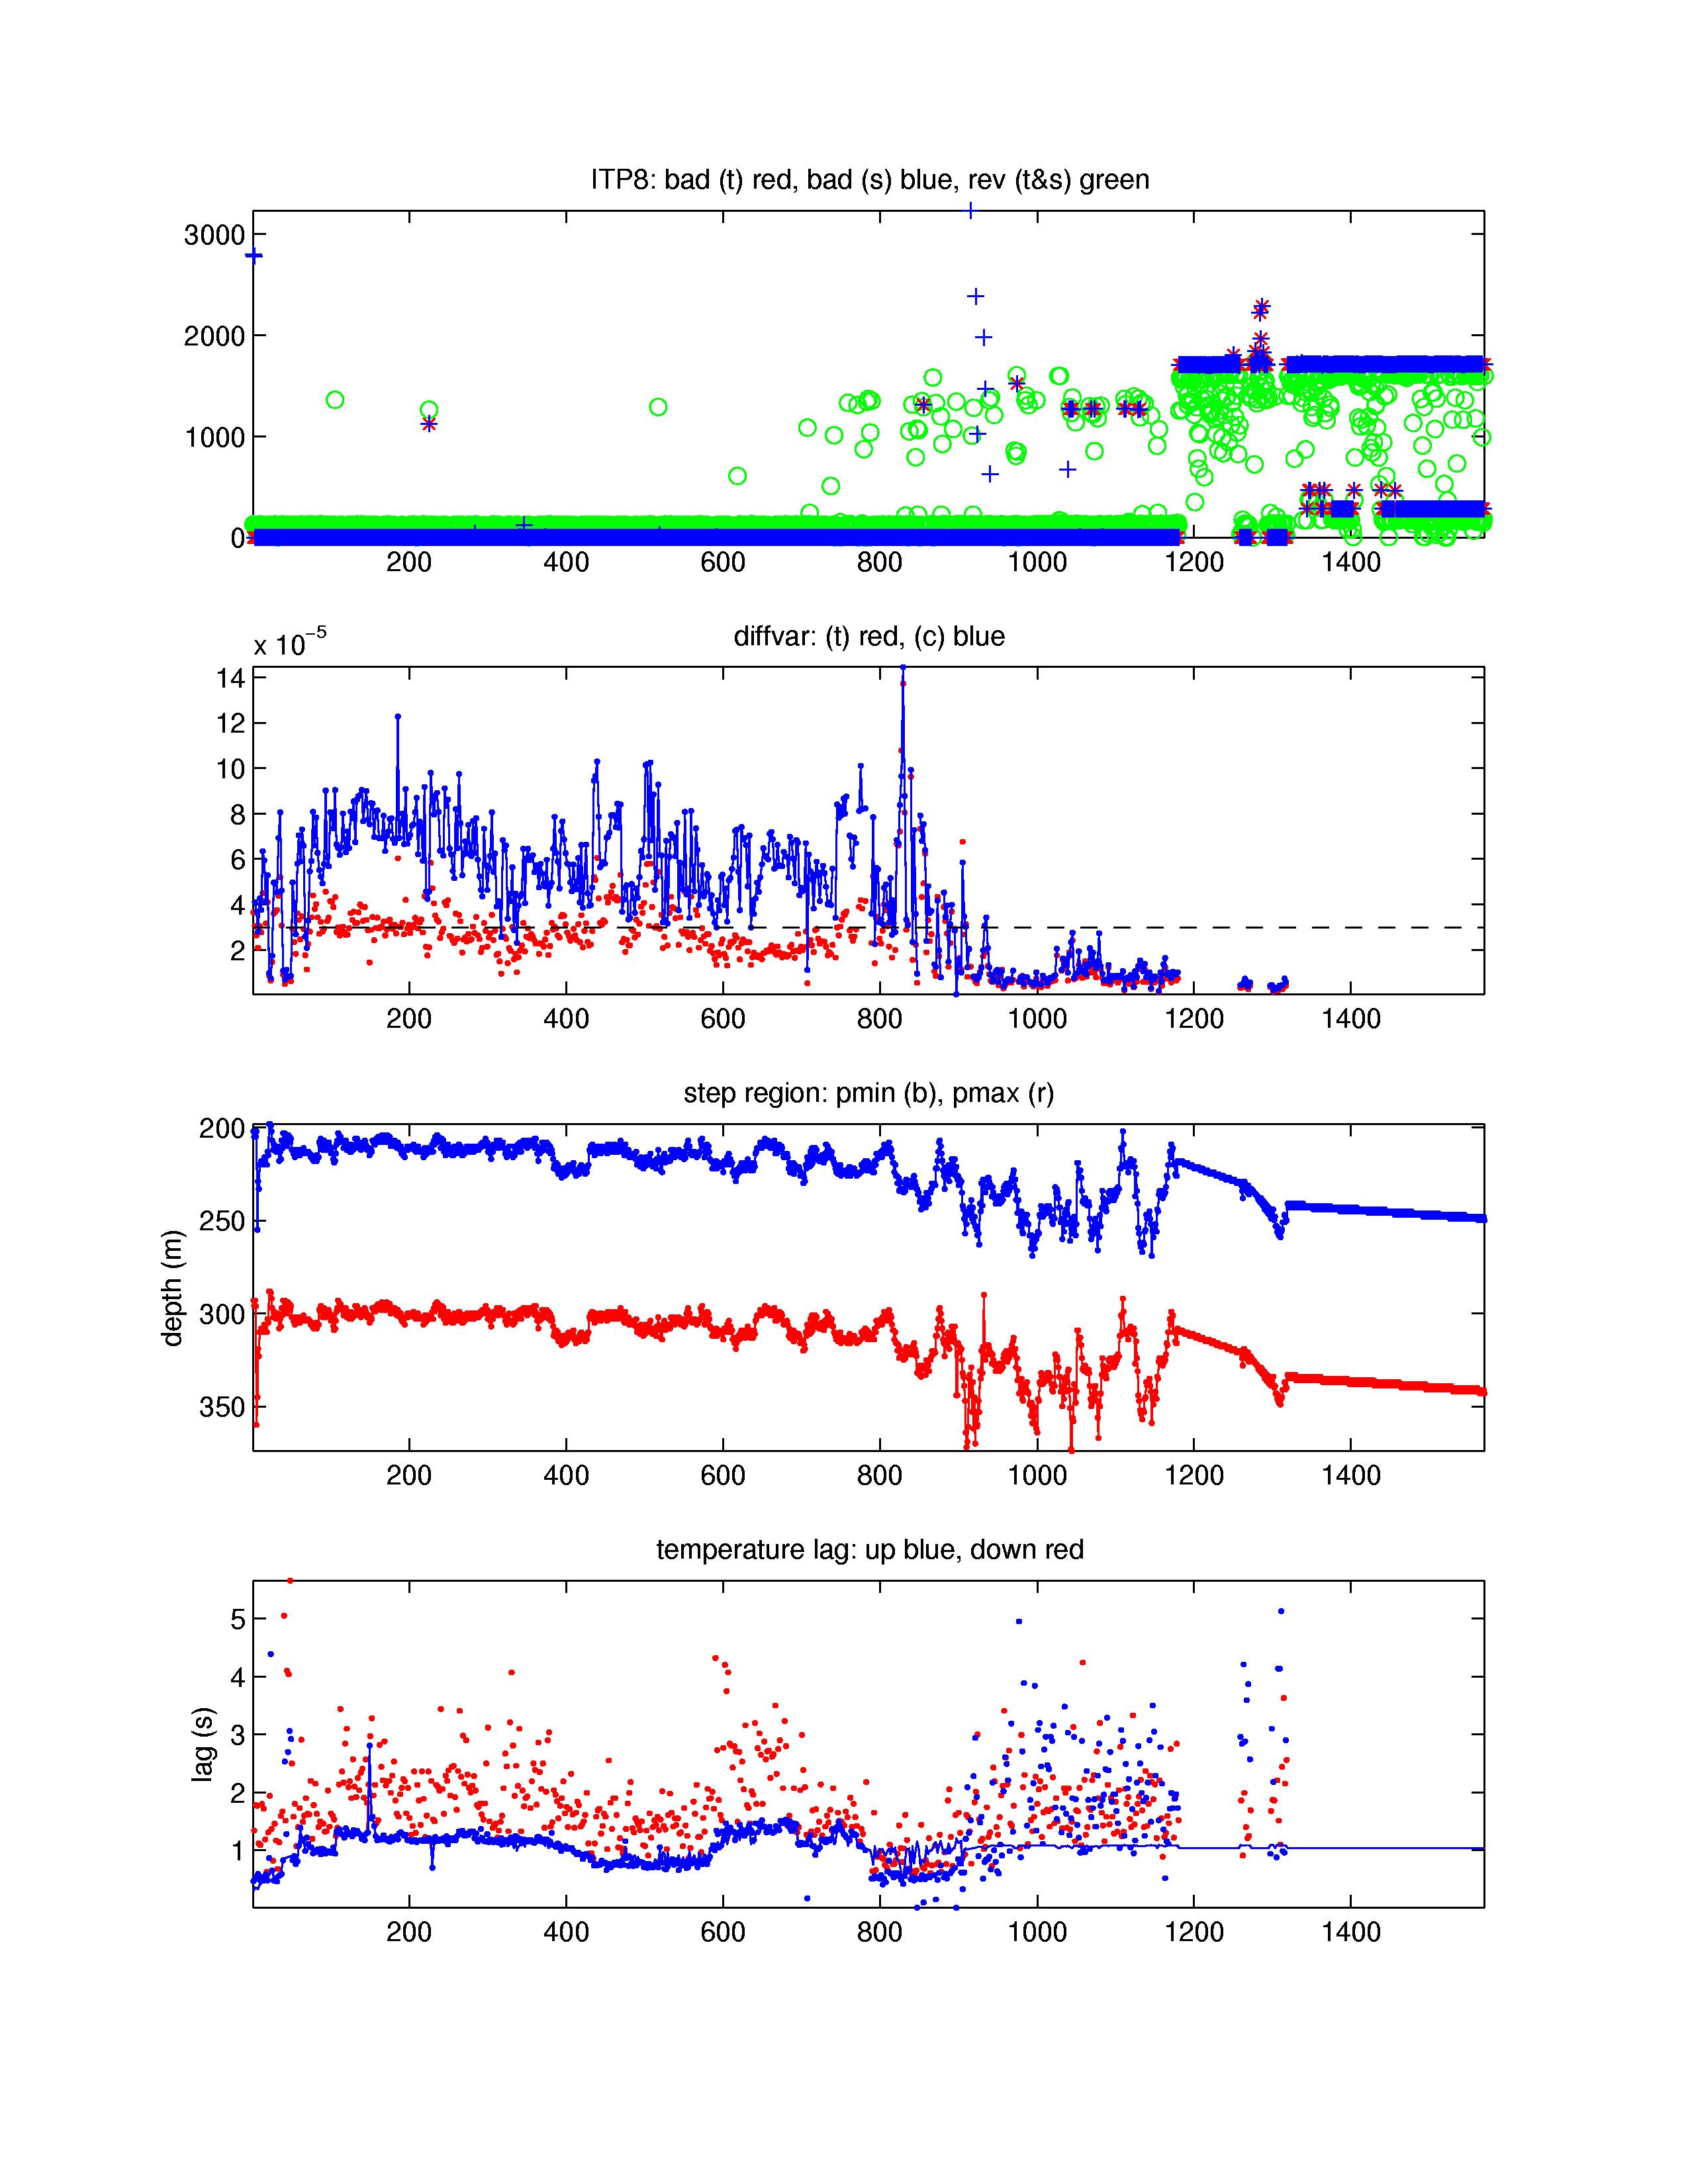
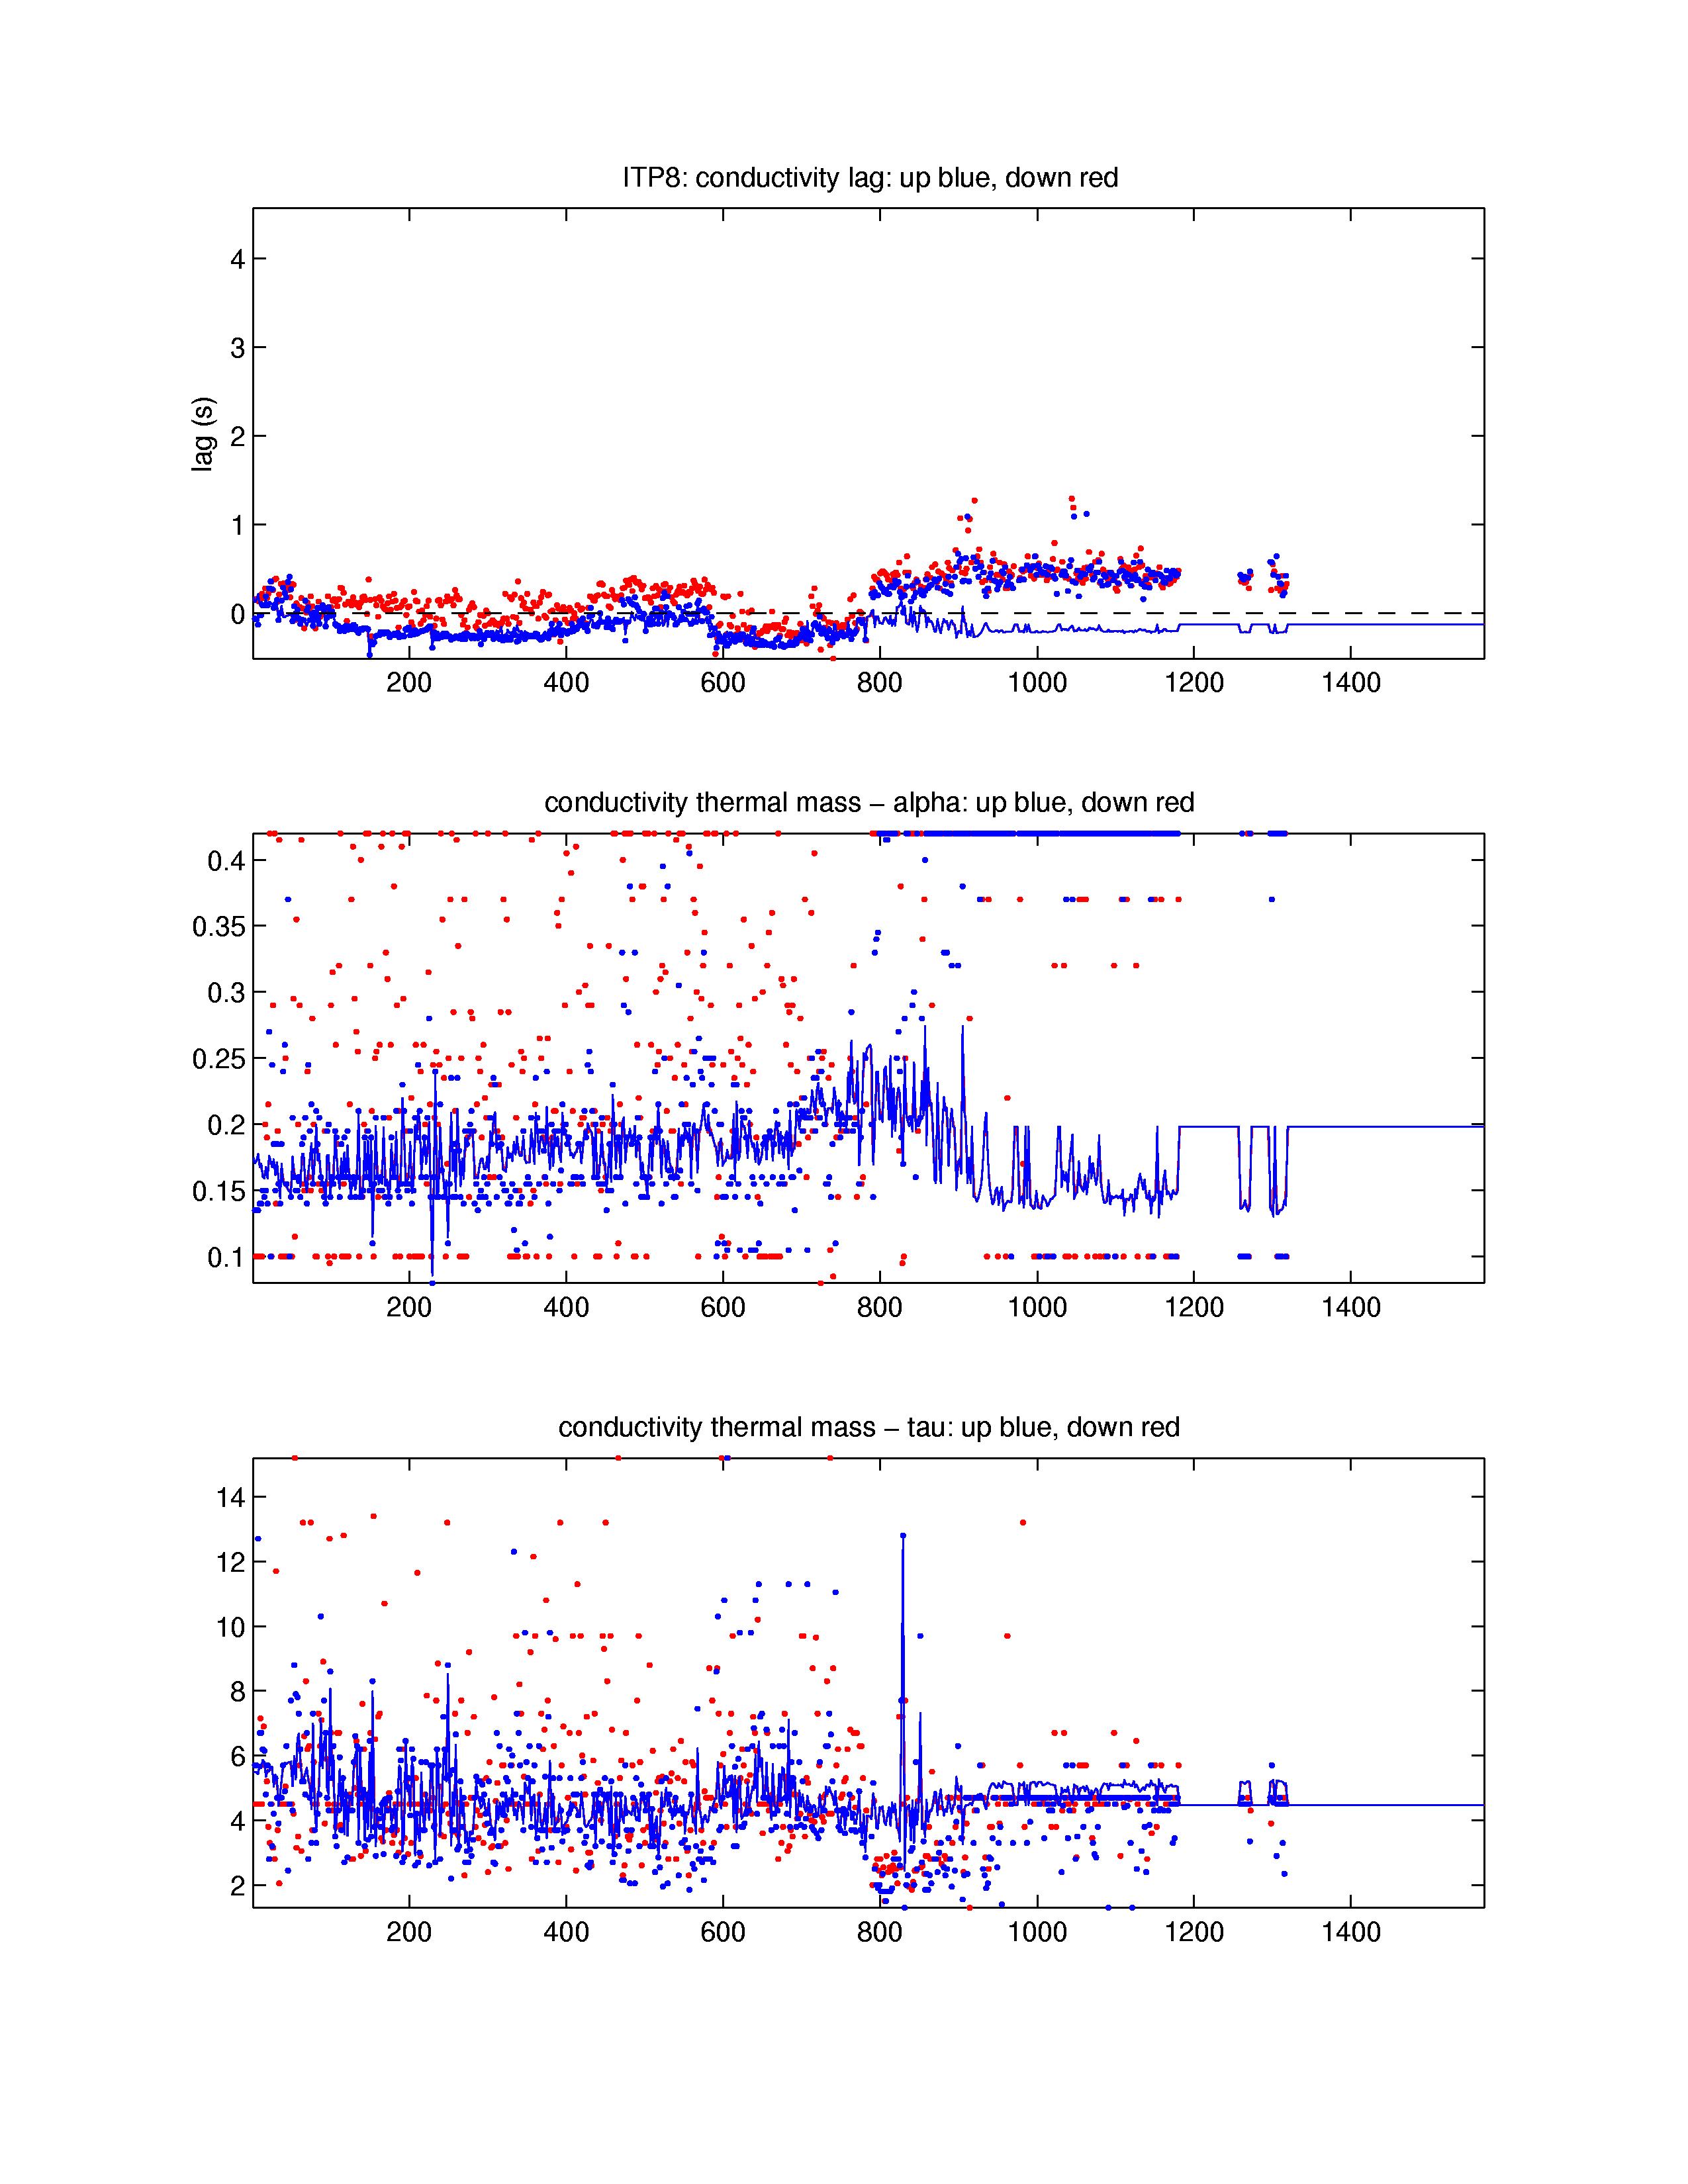
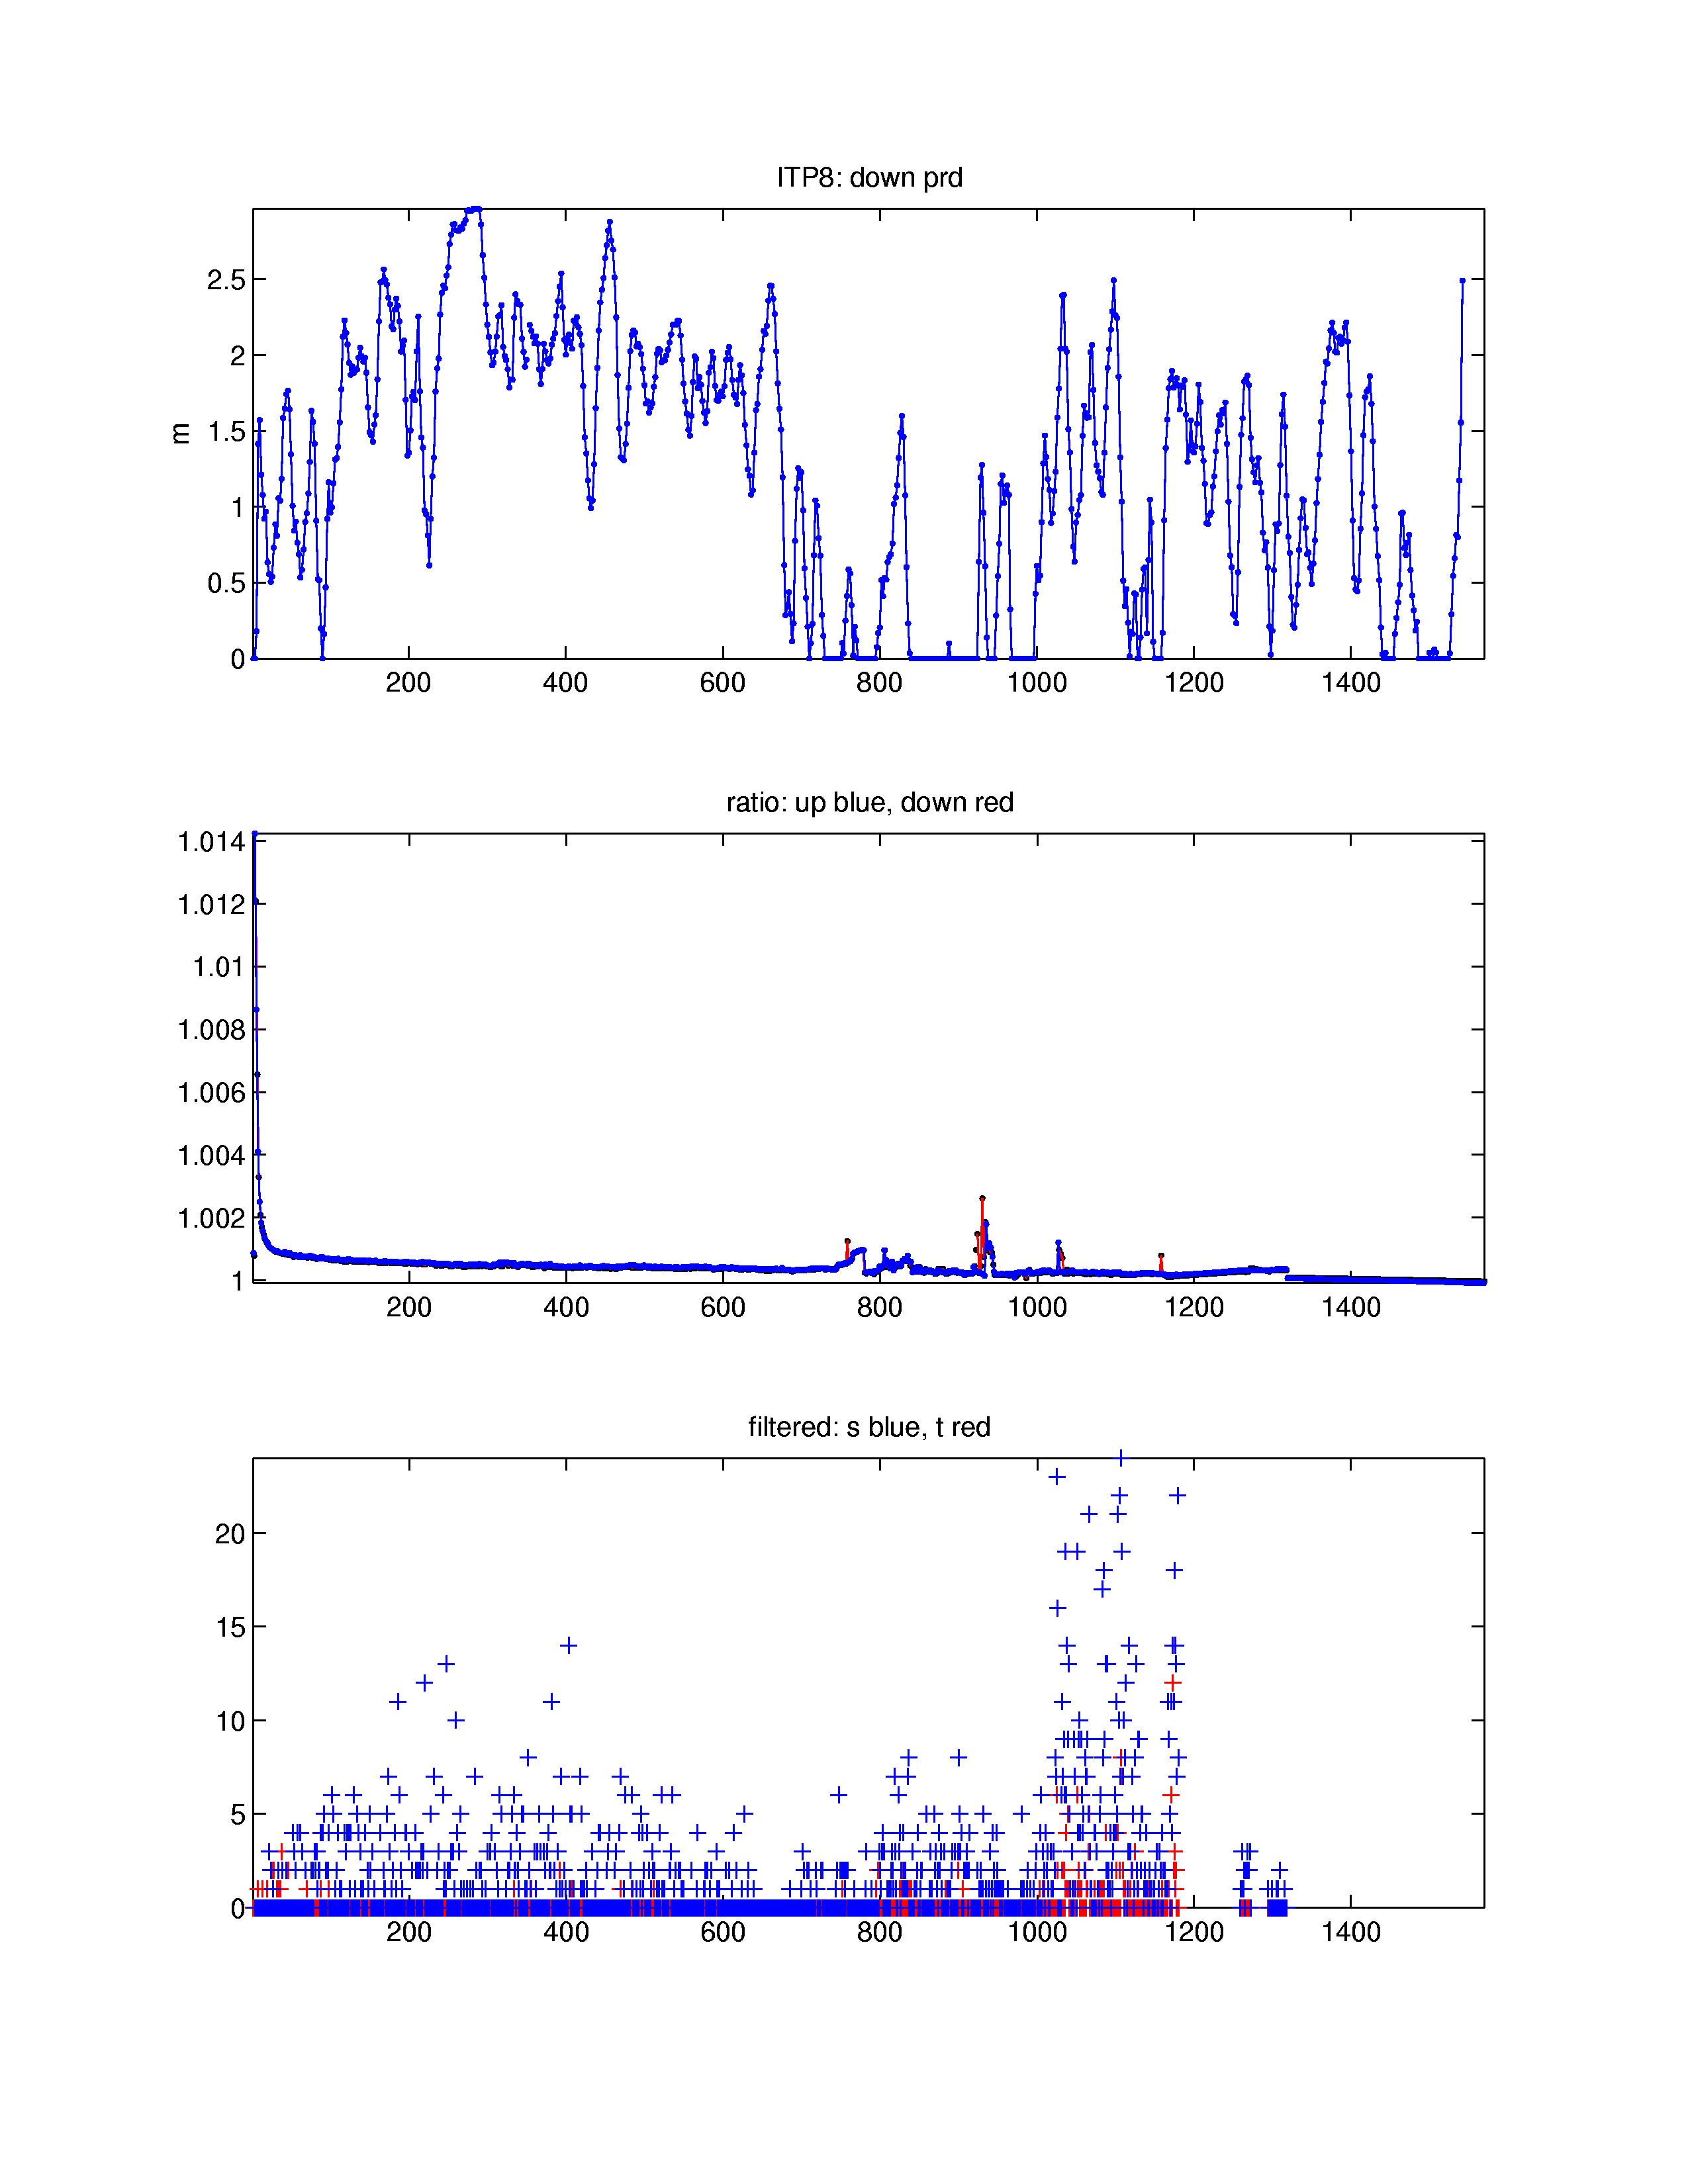
The 1569 attempted profiles that were retrieved from the ITP profiler were processed according to the procedures described in the ITP Updated Data Processing Procedures. The processing parameters are shown in the figures to the right.
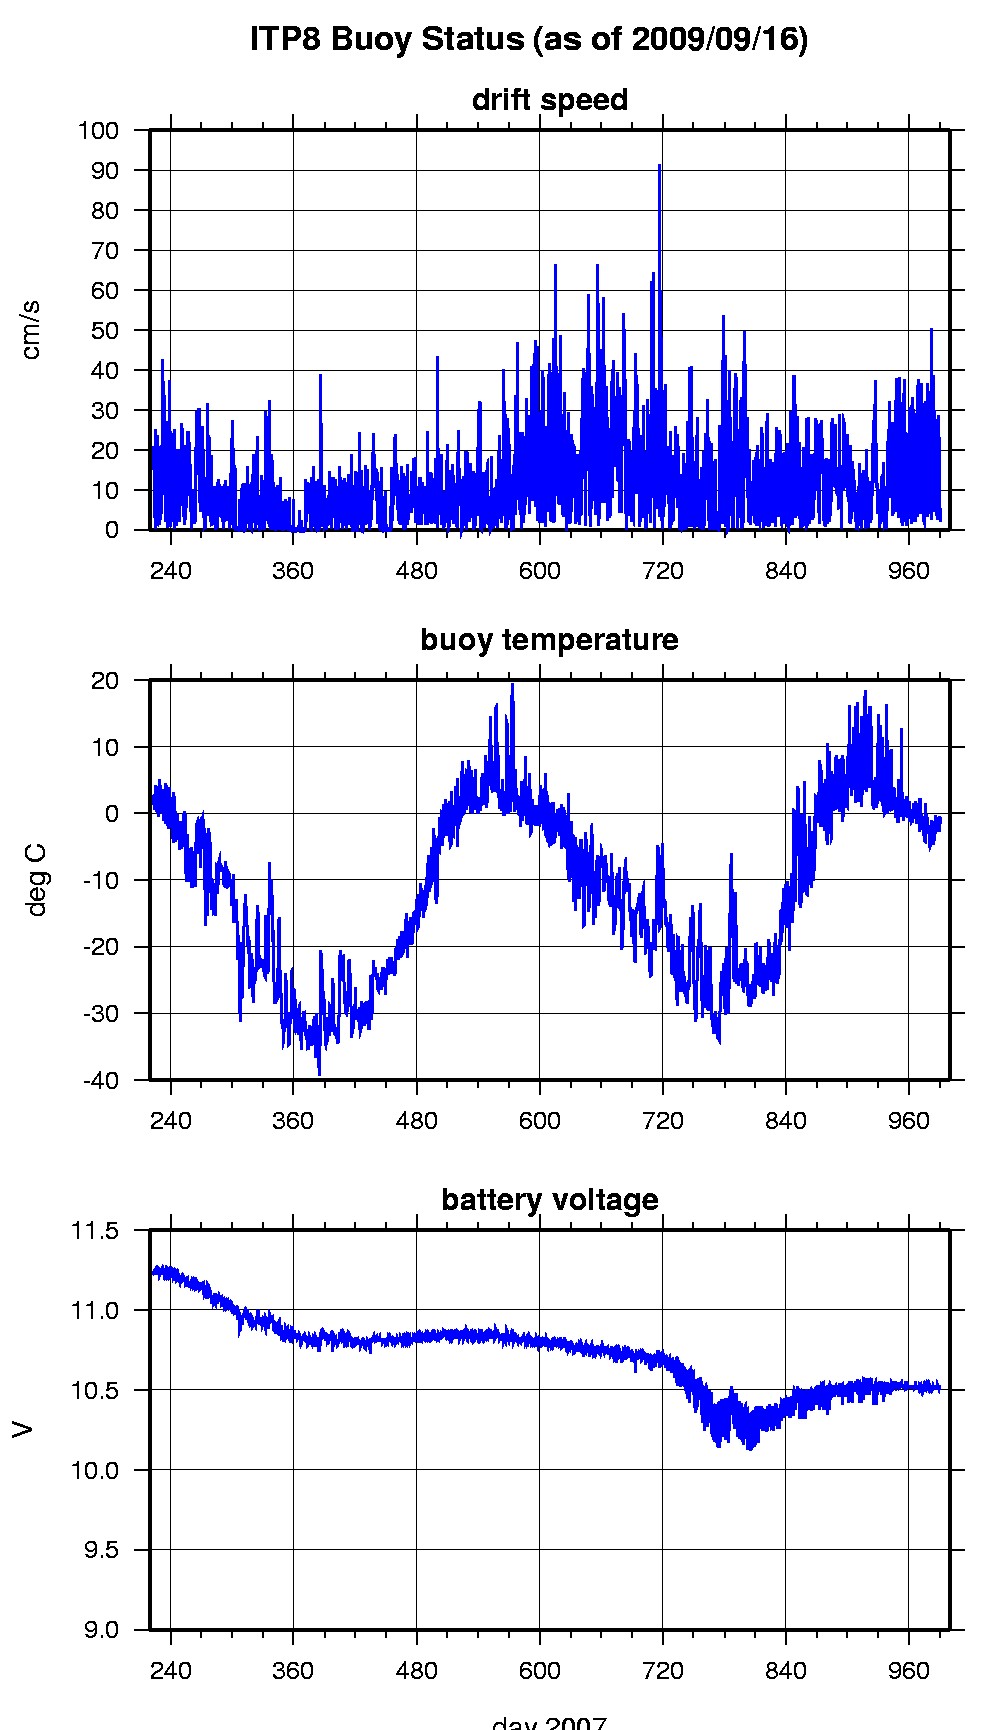
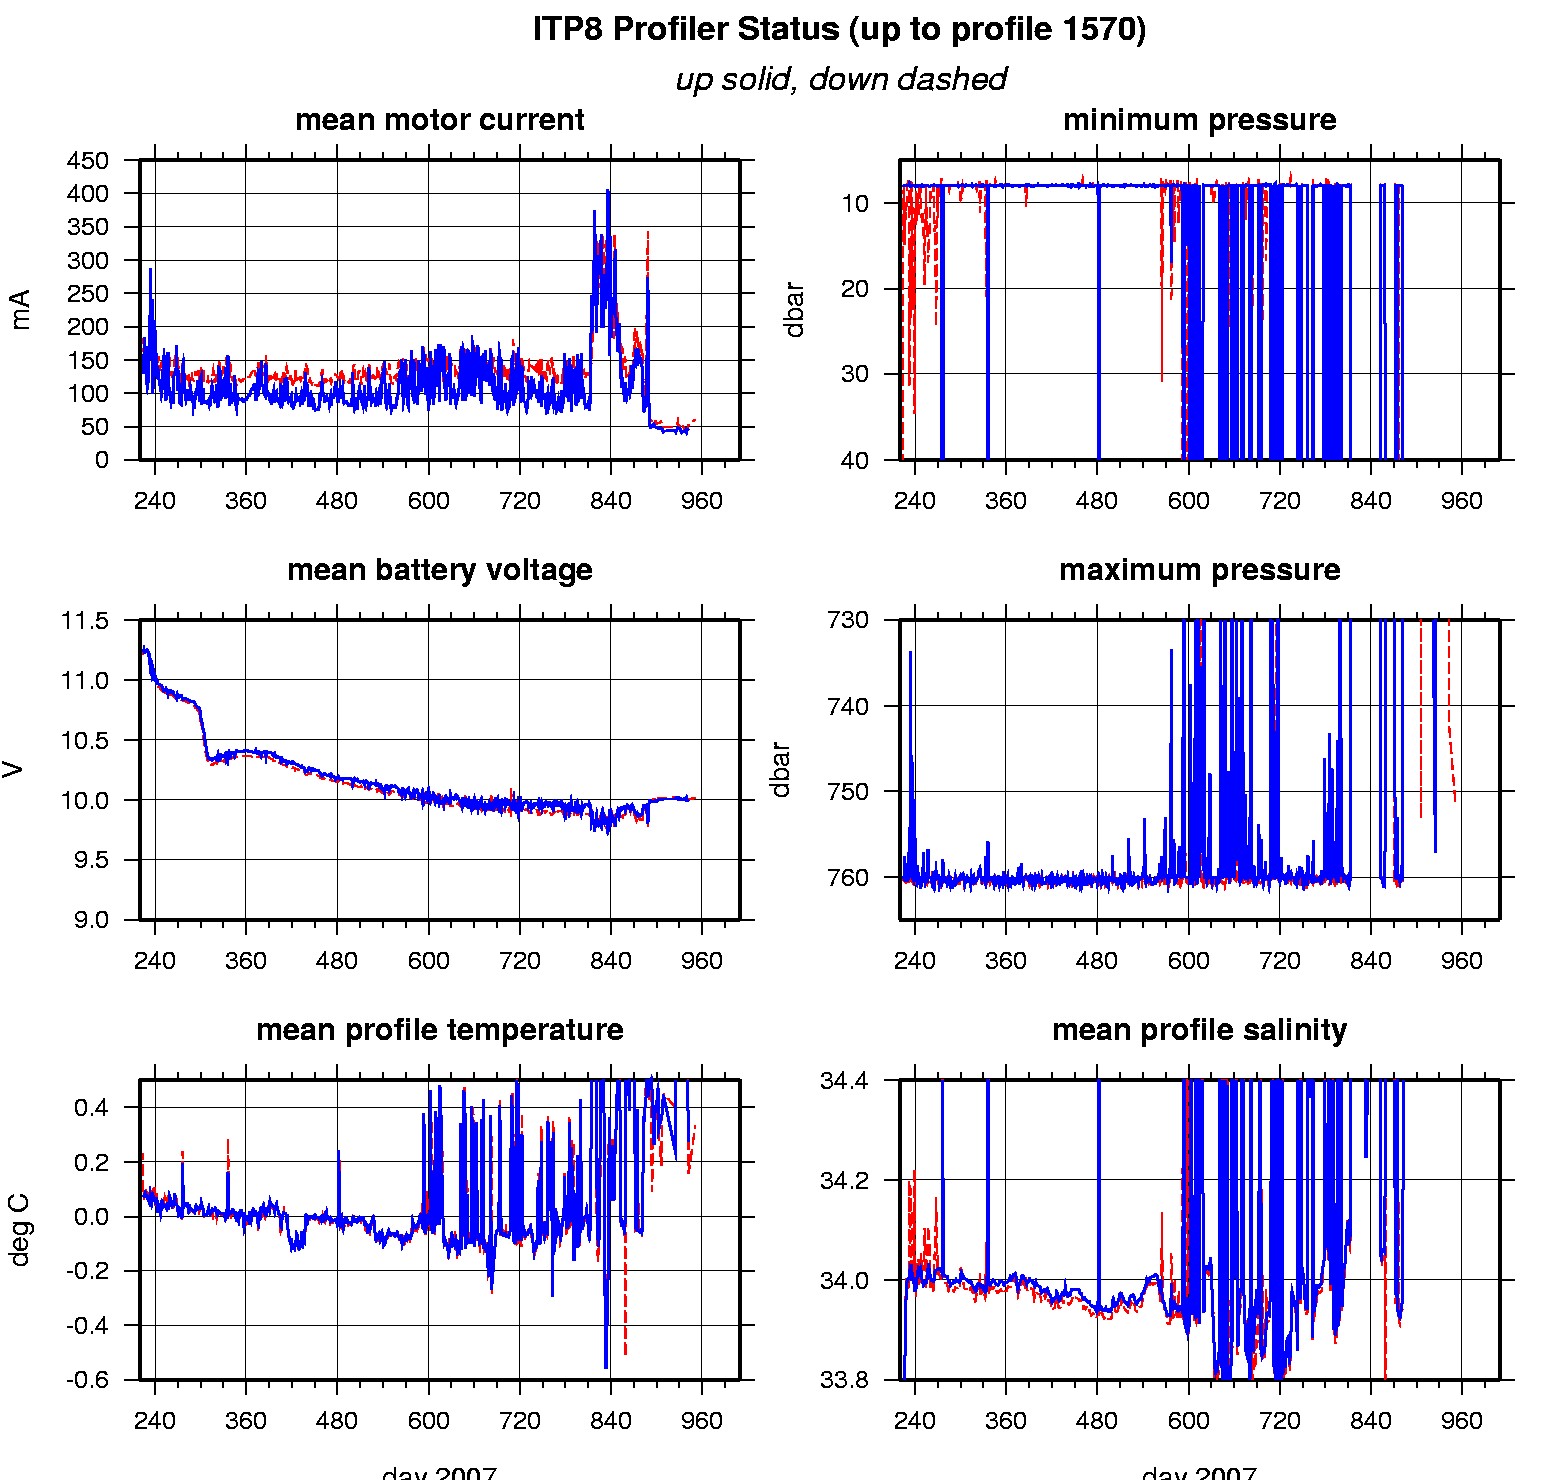
Thermohaline staircases were found in the data up to about profile 900 enabling determination of sensor lag corrections (which did not vary greatly). Afterwards, the lags are predominantly extrapolated from the earlier data. Data that were not transmitted indicate that the profiler was often unable to profile the full extent vertically between profiles 707 and 1180, which is attributed to increased drift speeds. Between profiles 1181 to 1258 and 1274 to 1295, the profiler was dragged over shallow topography and unable to profile at all, although it was able to recover and obtain 34 additional profiles between these intervals. After profile 1318, the instrument dragged again, and became tangled in the tether for the remainder of the drift. No CTD information was transferred from the underwater unit to the surface unit for profile 352 for unknown reasons. Large conductivity adjustments were applied during the first week of acquired profiles, likely due to icing on the sensor. Other biofouling instances are less than previous ITPs.
See the Data Products tab to the left for descriptions of the three levels (I, II, III) of data processing and to access all data.
