ITP 16 Data Processing
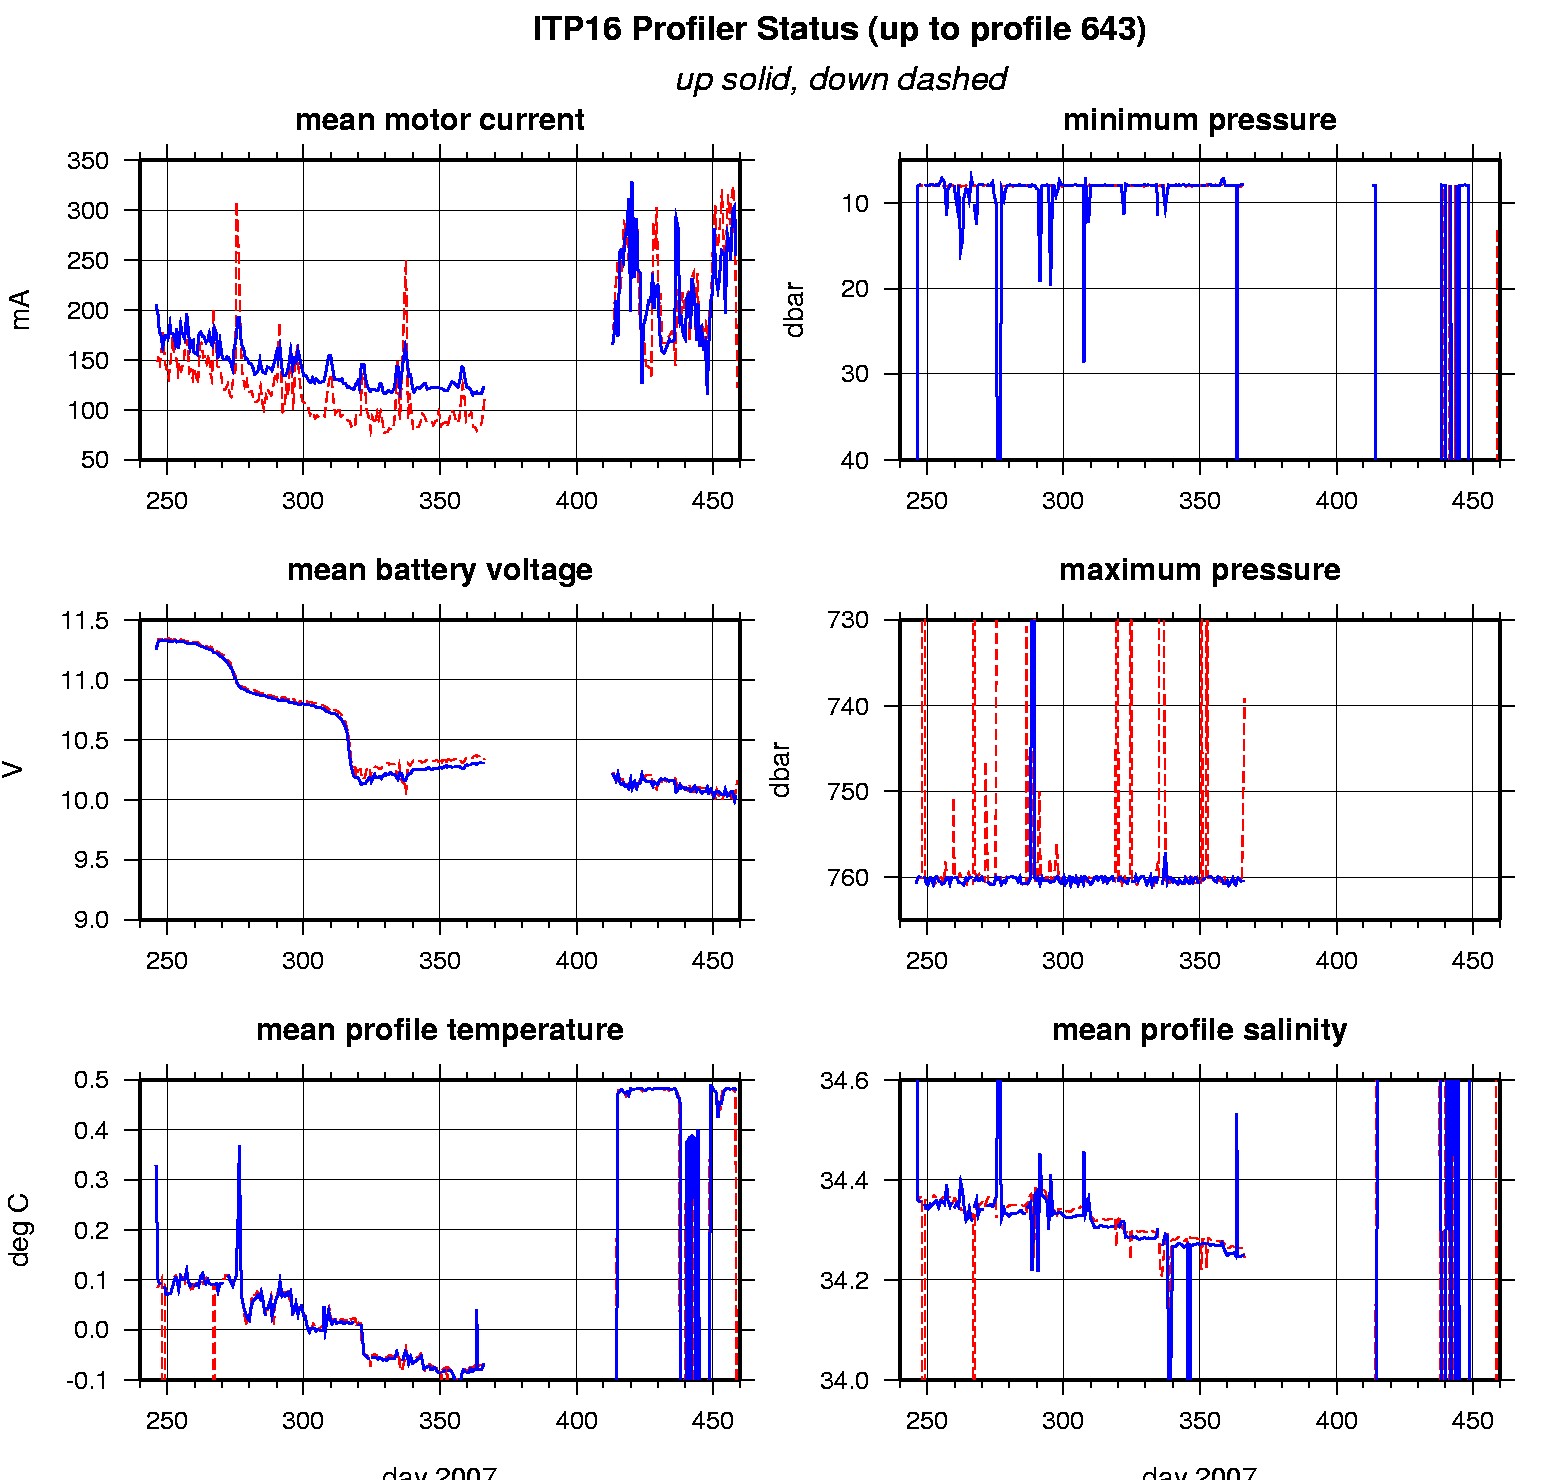
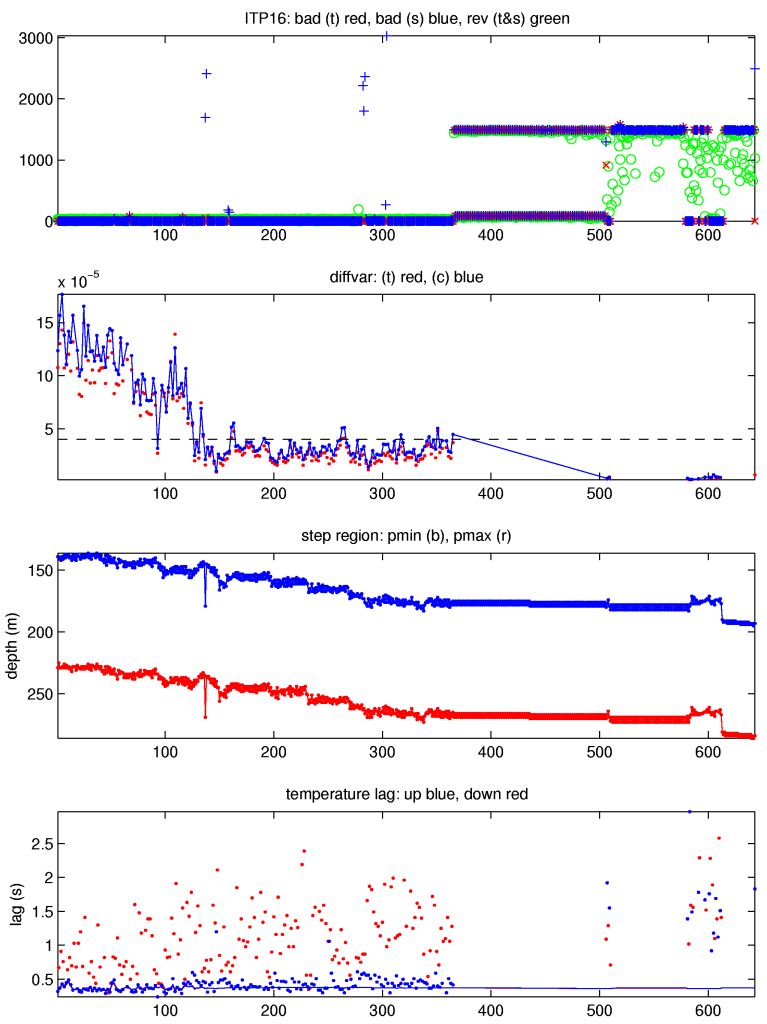
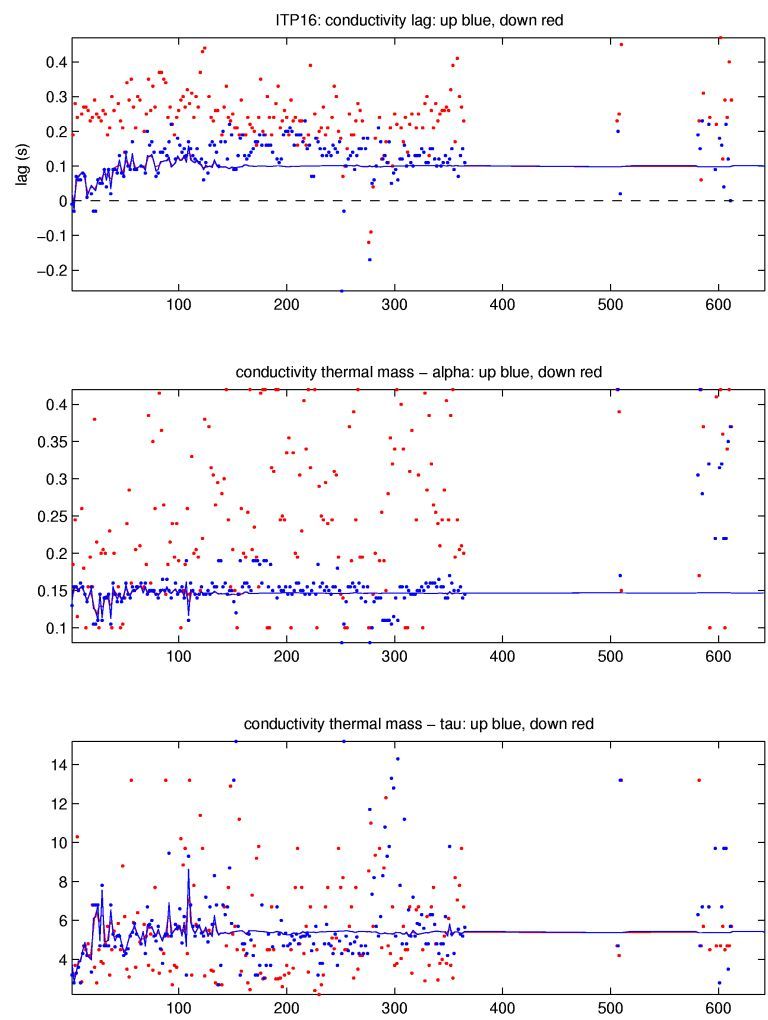
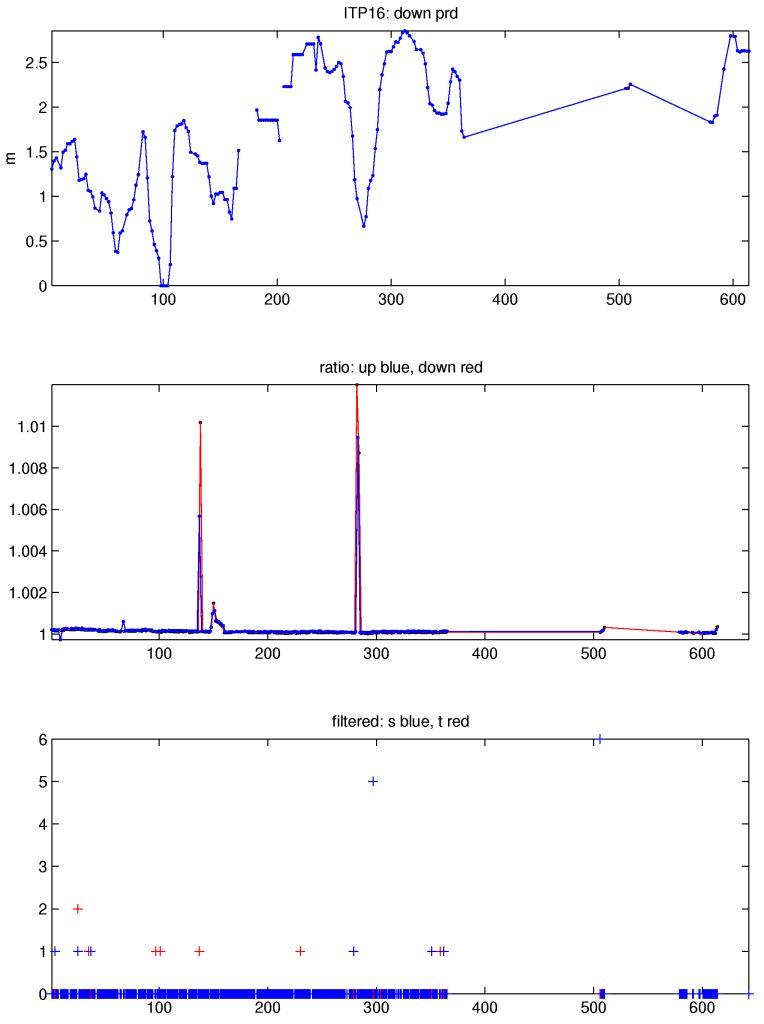
The 643 profile attempts that were recovered from the ITP were processed according to the procedures described in ITP Updated Data Processing Procedures, but only 372 good profiles resulted. The processing parameters for ITP 16 are shown in the figures to the right. In particular, this system suffered the greatest percentage of incomplete profiles due to resets (24%) than any other, the vast majority due to the mooring dragging in shallow water between profiles 366 to 505, but 16 earlier misses were due to the 2007 profiler software reset error.
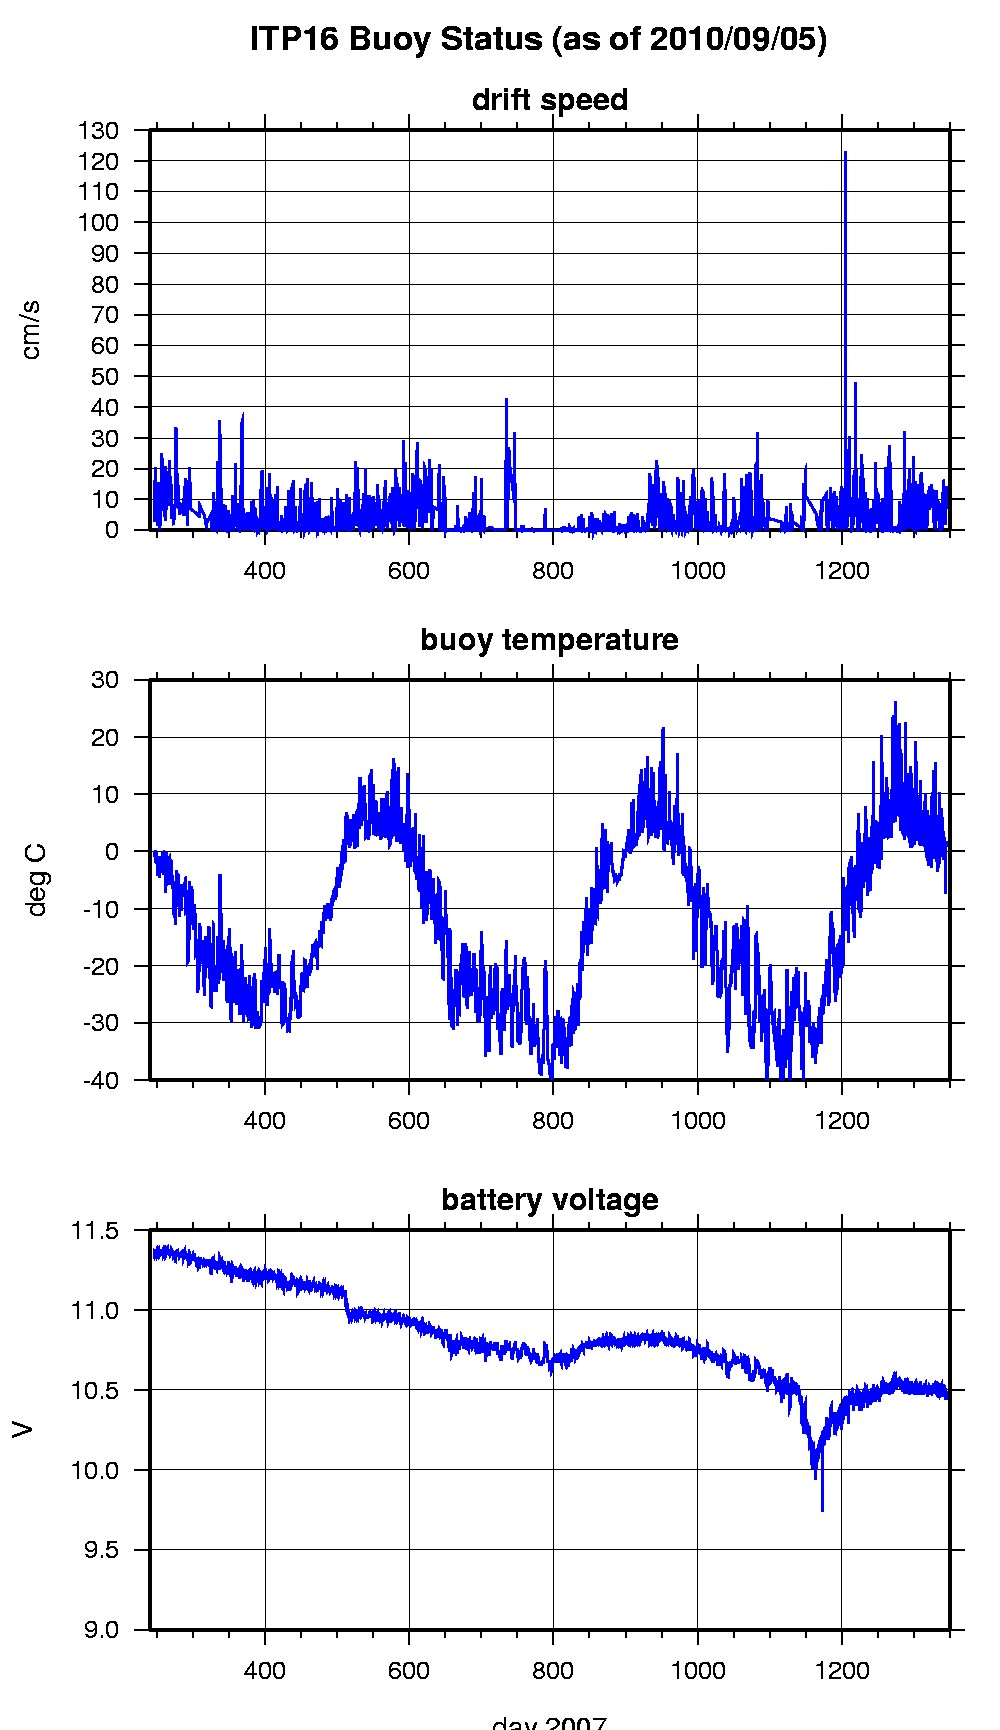
The package drifted through seawaters with three distinct subsurface temperature maxima: 1) between 0.7 and 0.95 deg before mid-November while located in the basin north of 87.25N, 2) between 0.55 and 0.7 deg until January 1, 2008, and 3) rounded around 0.5 deg C in the Lincoln Sea north of Ellsmere Island mid-winter 2008. Staircases were only present in the north basin to determine CTD sensor lags, which were relatively stable and extrapolated over the remainder of the series where lags could not be determined. The drift of the buoy was almost always less than 30 cm/s, so instances when the profiler could not climb the wire due to seawater drag were rare.
After mid-February, the system drifted off of the ridge and over deeper water (>500 m) north of the Ellsmere shelf in the Lincoln Sea, where the profiler resumed profiling down to as much as 515 m for several days, then mostly hovered around 400 m between profiles 510 and 580, resumed profiling again to 511 m, then hovered from profiles 615 to 642. The profiles taken after dragging may have been subject to more contamination as the instrument resumed and may have been profiling closer to the ocean bottom. While the dataset before profile 366 was nearly free of fouling, more T & S data were removed amongst the later profiles, including the last. See the Data Products tab to the left for descriptions of the three levels (I, II, III) of data processing and to access all data.
