ITP49 Data Processing
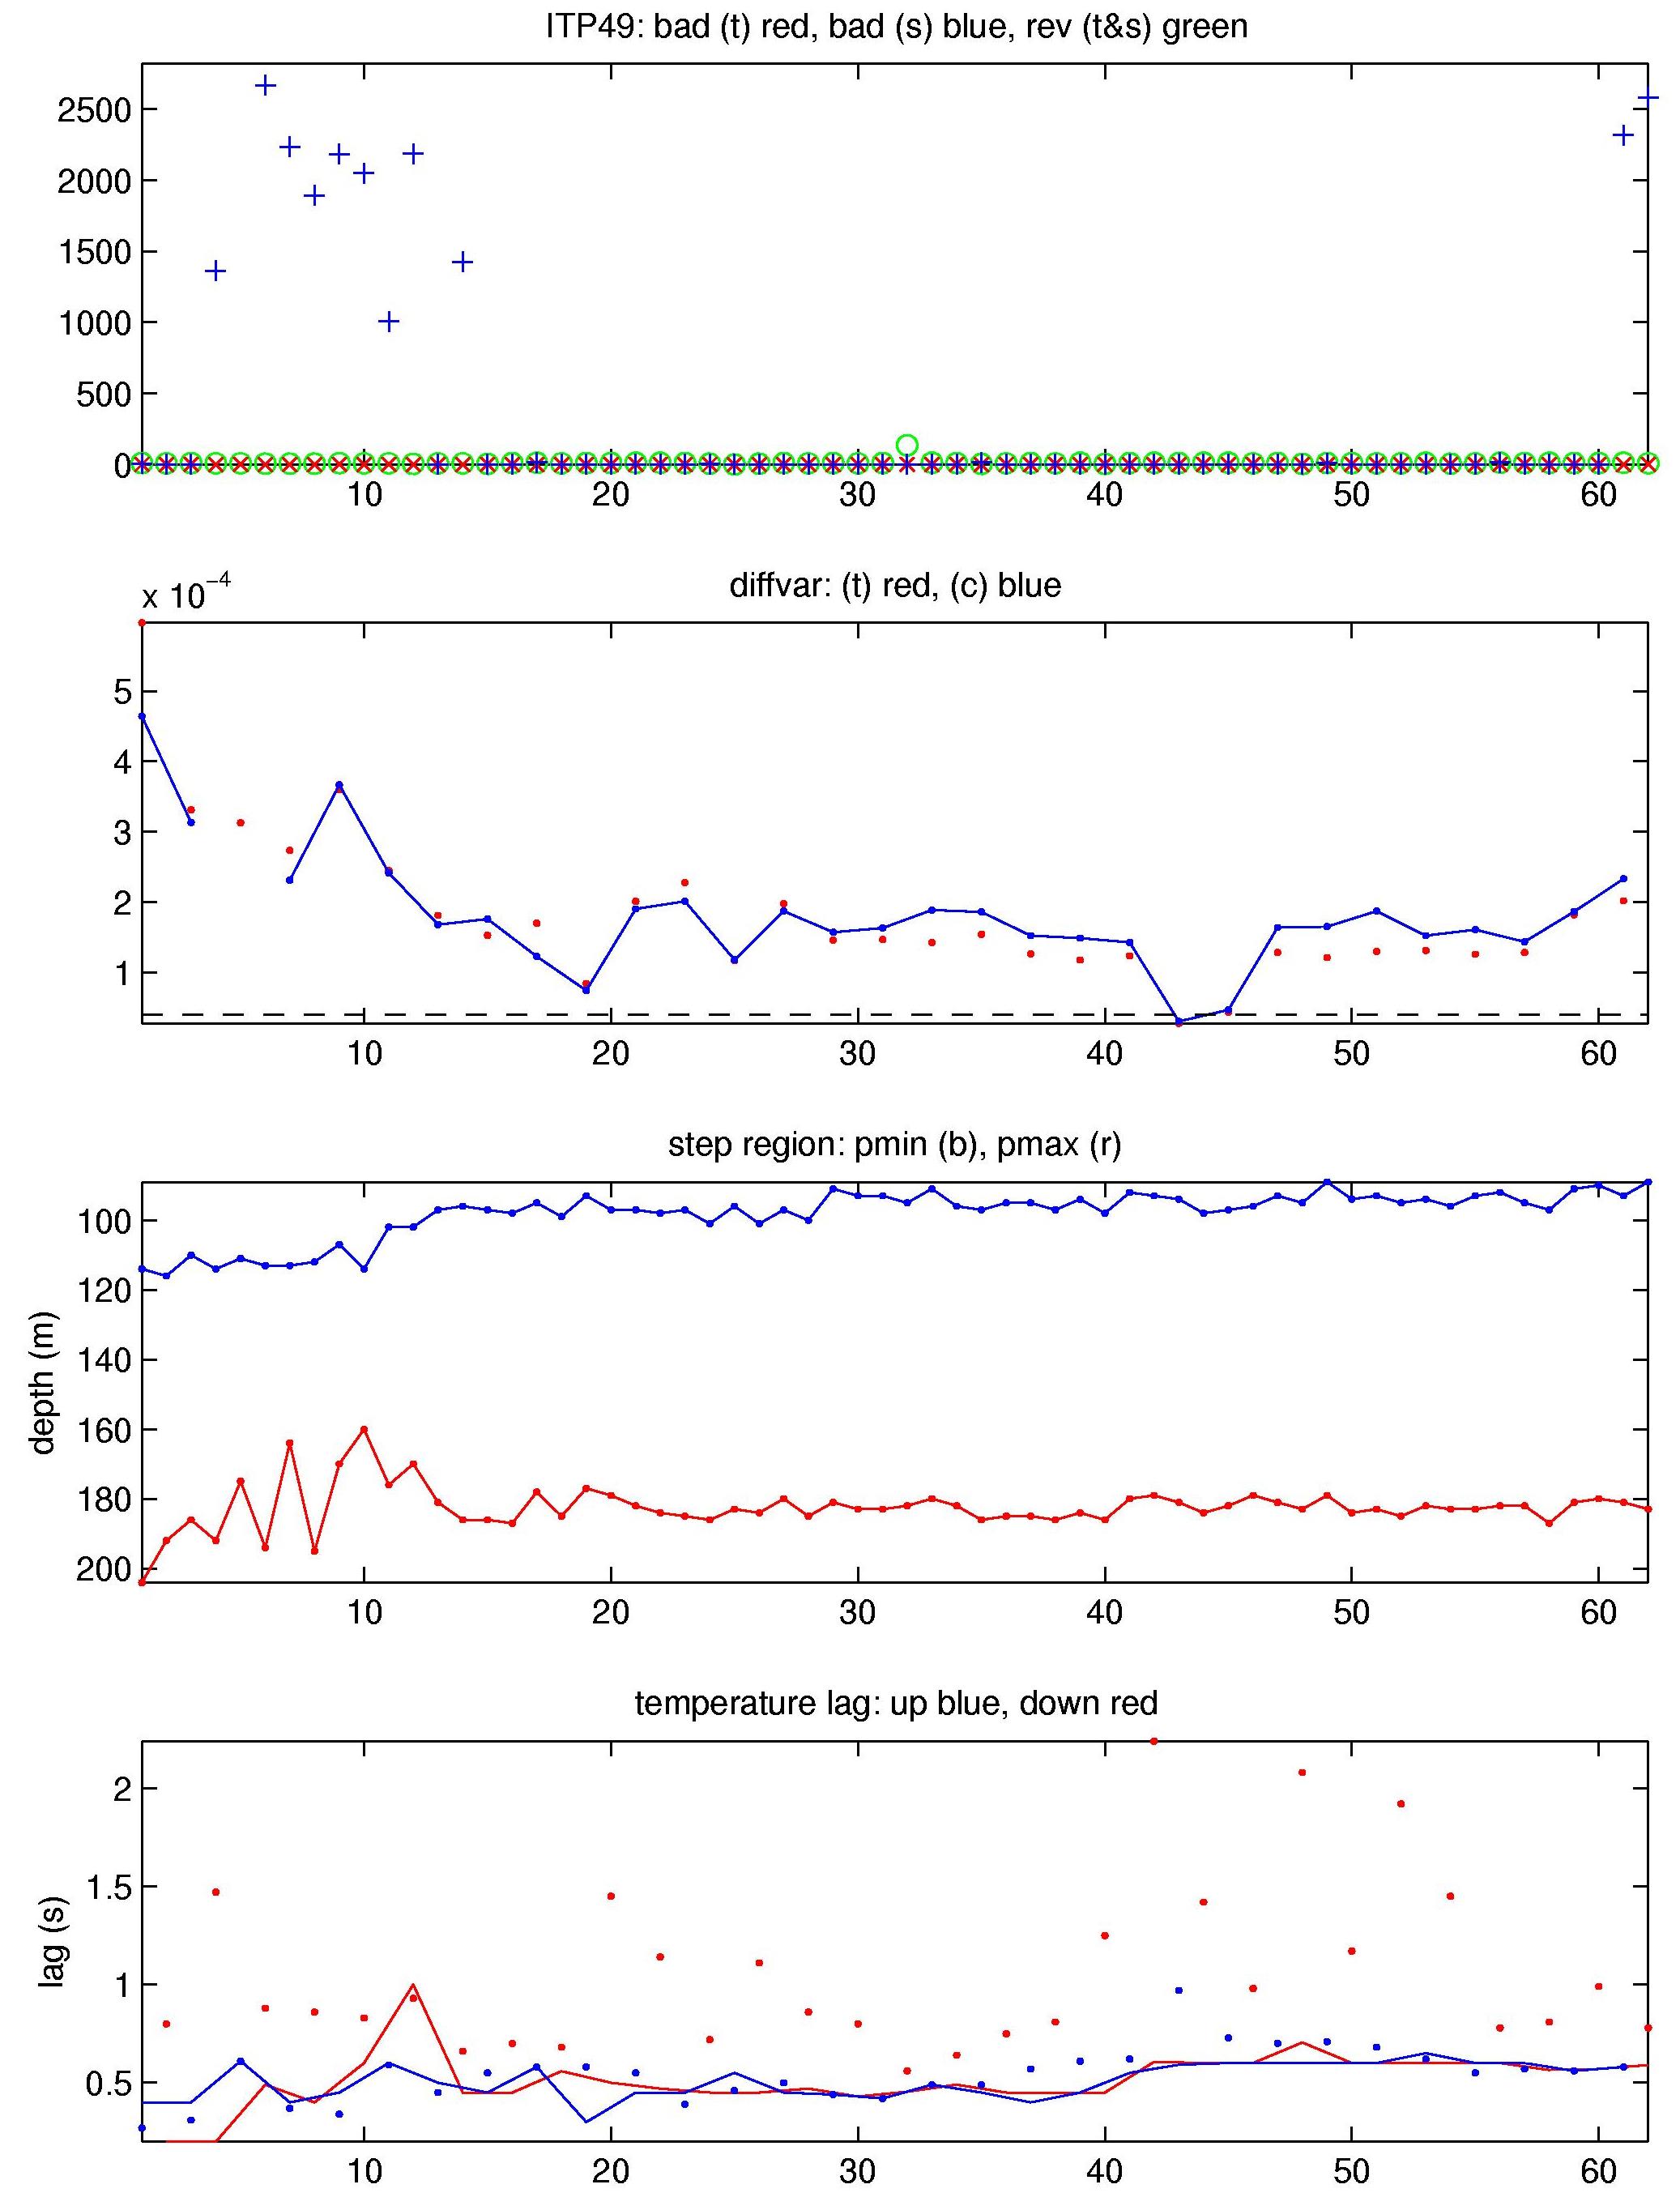
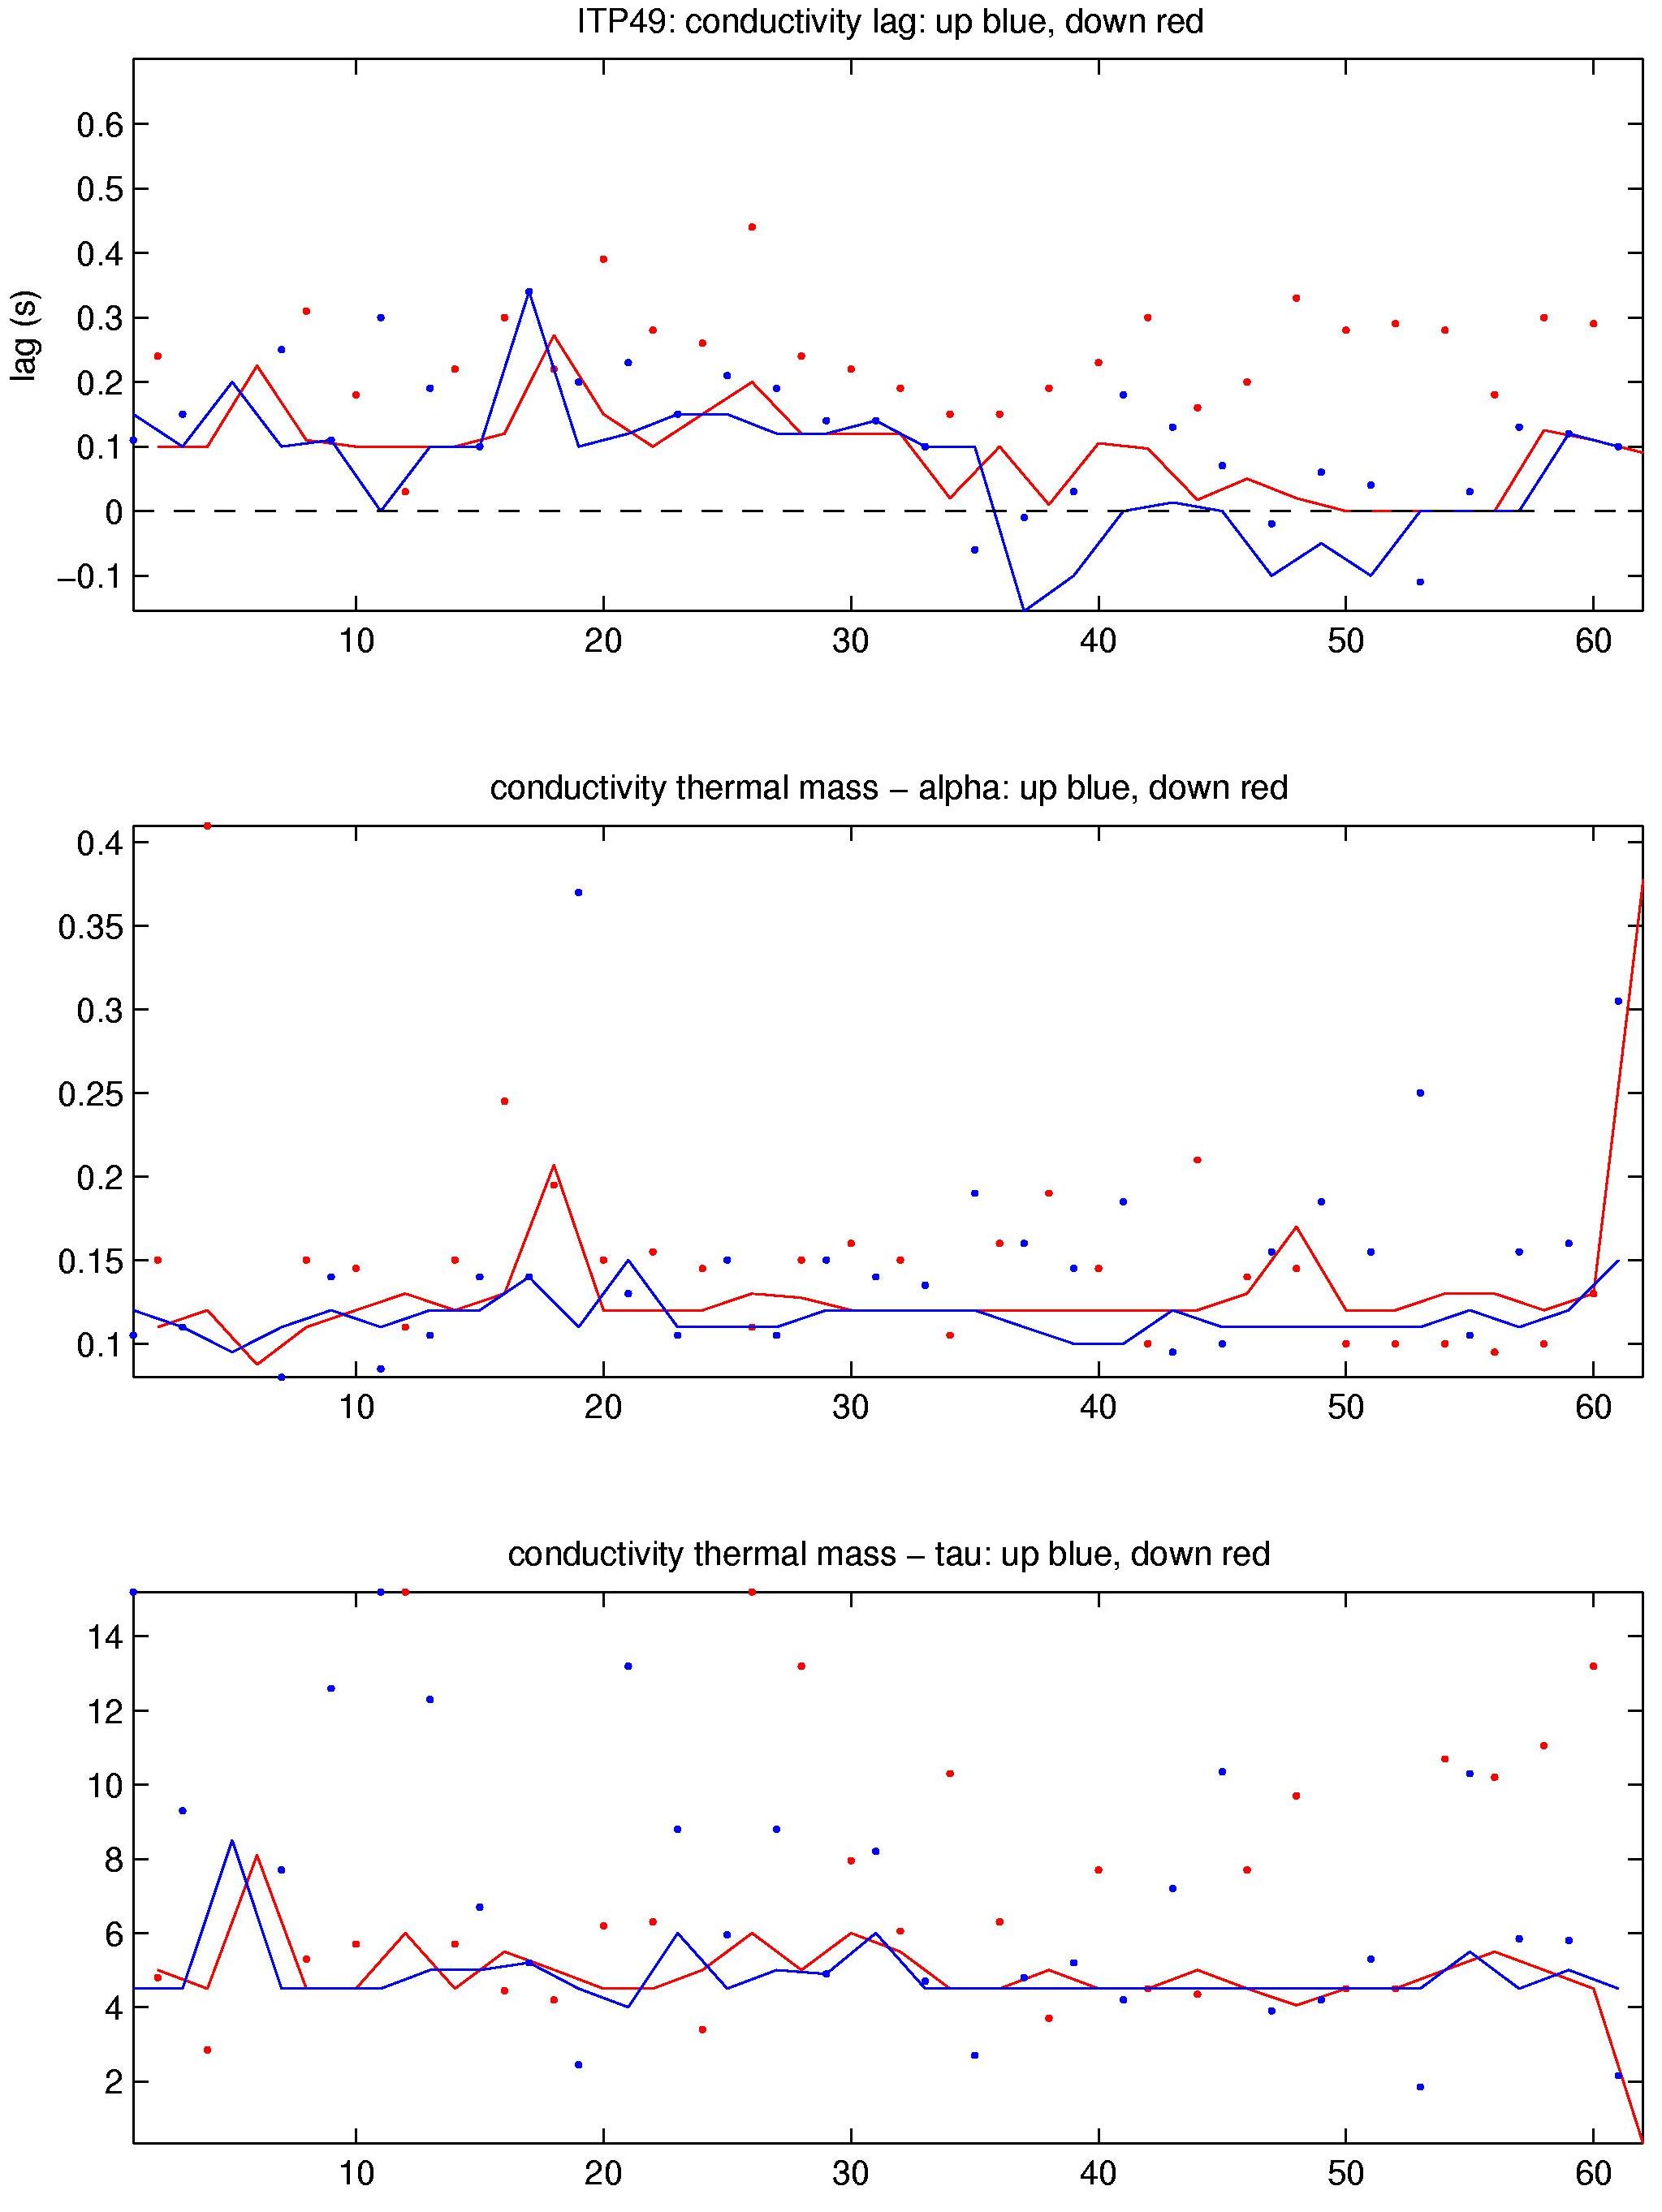
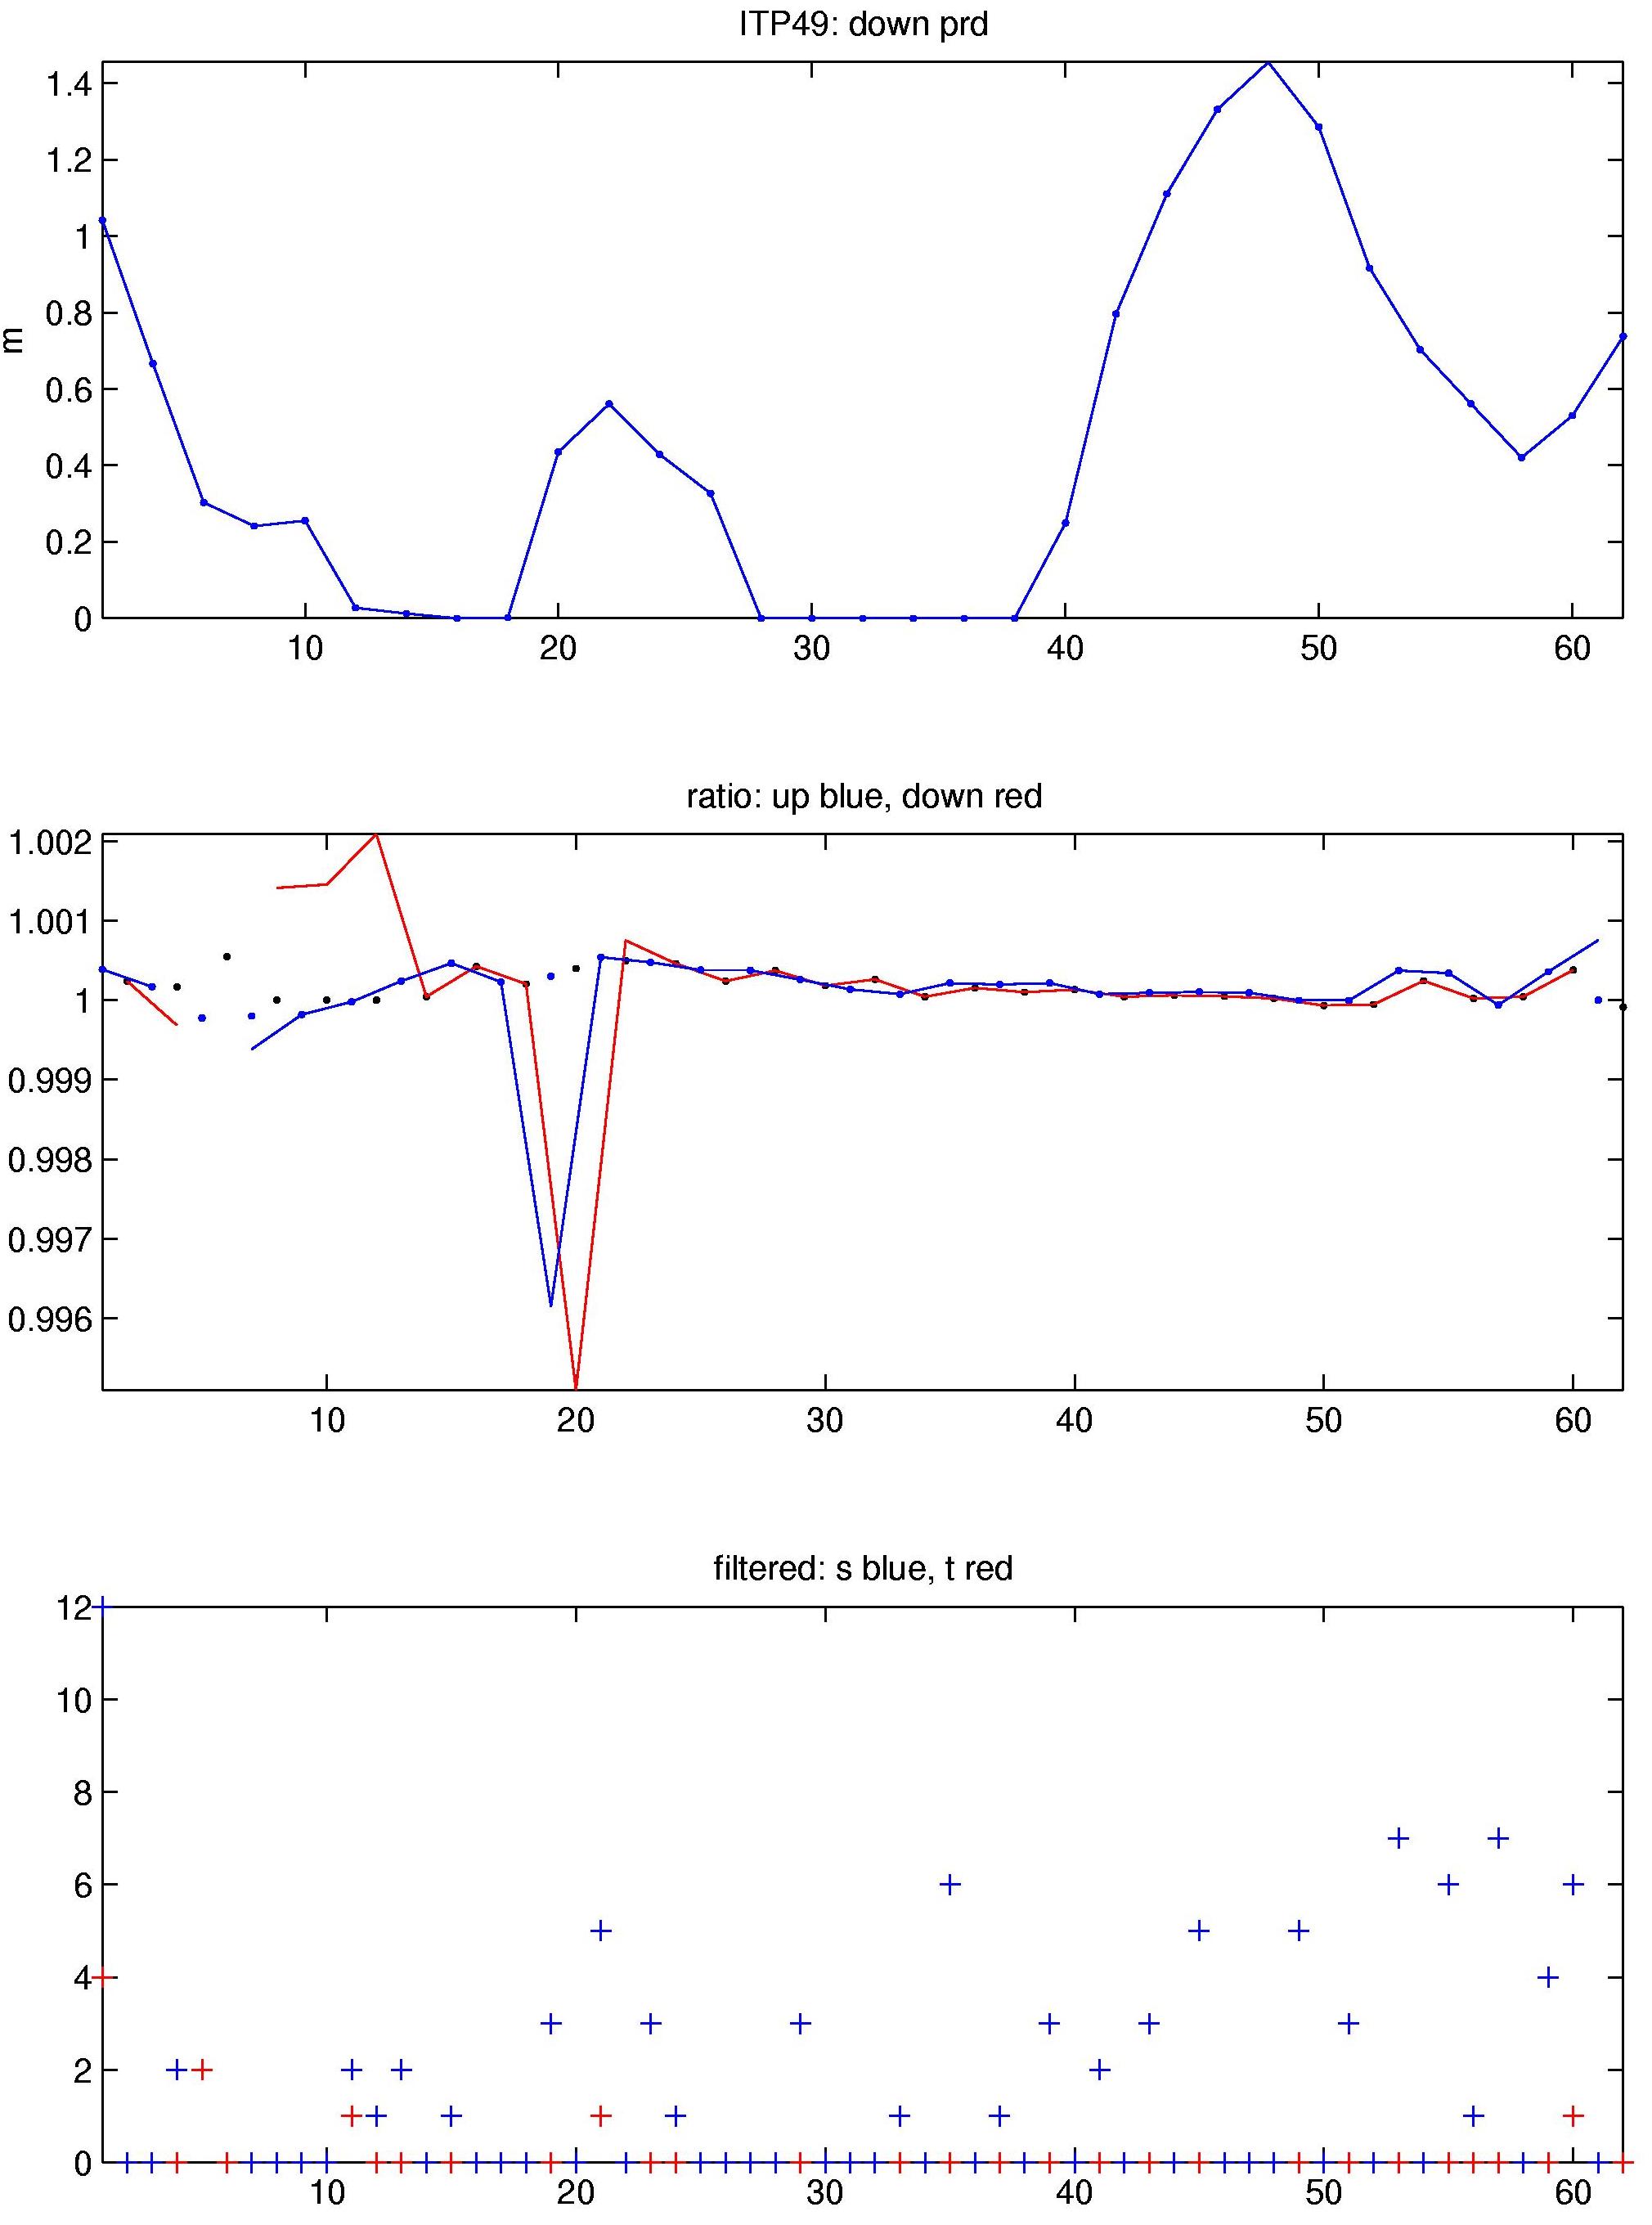
The 62 profiles that were transmitted from the ITP were processed according to the procedures described in the ITP Updated Data Processing Procedures. The processing parameters for this ITP are shown in the figures to the right.
After collecting two good profiles, CTD data quality dropped starting with profile 3. In addition to profile segments of poor conductivity typically related to cell contamination, conductivity also developed a varying, sometimes large number of very large short-term spikes. The latter was more likely related to instrument problems rather than contaminations. The instrument seemed to recover by profile 20 or so, yielding better salinity estimates for the remainder of the short record.
Oxygen was noisy for the first two profiles, but seemed to follow the general profile shape seen in earlier ITP DO profiles collected in this area (e.g., ITP 57 profiles 300 to 350). However, the oxygen calibration factor changed from typical values near unity to a factor around 2.7, and the profile shape changed significantly as well. Starting with profile 3, oxygen data were deleted. Following more deliberations, profiles 1 and 2 were eventually removed as well because of noise.
The temperature record included two very unusual profiles (19 and 20) for which deep values were 0.5 to 1 degree colder compared to profiles before and after. Since, however, the pattern was repeated over two profiles, and since shallow values matched earlier and later profiles, the data were not edited out. Since this pushed temperature outside the mapped fields typically used at this depth, the conductivity calibration for these two profiles was estimated from earlier/later profiles. This seemed reasonable as the conductivity calibration time series did not change much in time here.
Thermohaline staircases were available to generate initial estimates for CTD lag corrections. They were adjusted manually to reduce profile noise. The conductivity calibration adjustments (variable "rat") were somewhat variable for the early noisy profiles, but still relatively flat and near unity.
See the Data Products tab to the left for descriptions of the three levels (I, II, III) of data processing and to access all data.
