ITP55 Data Processing
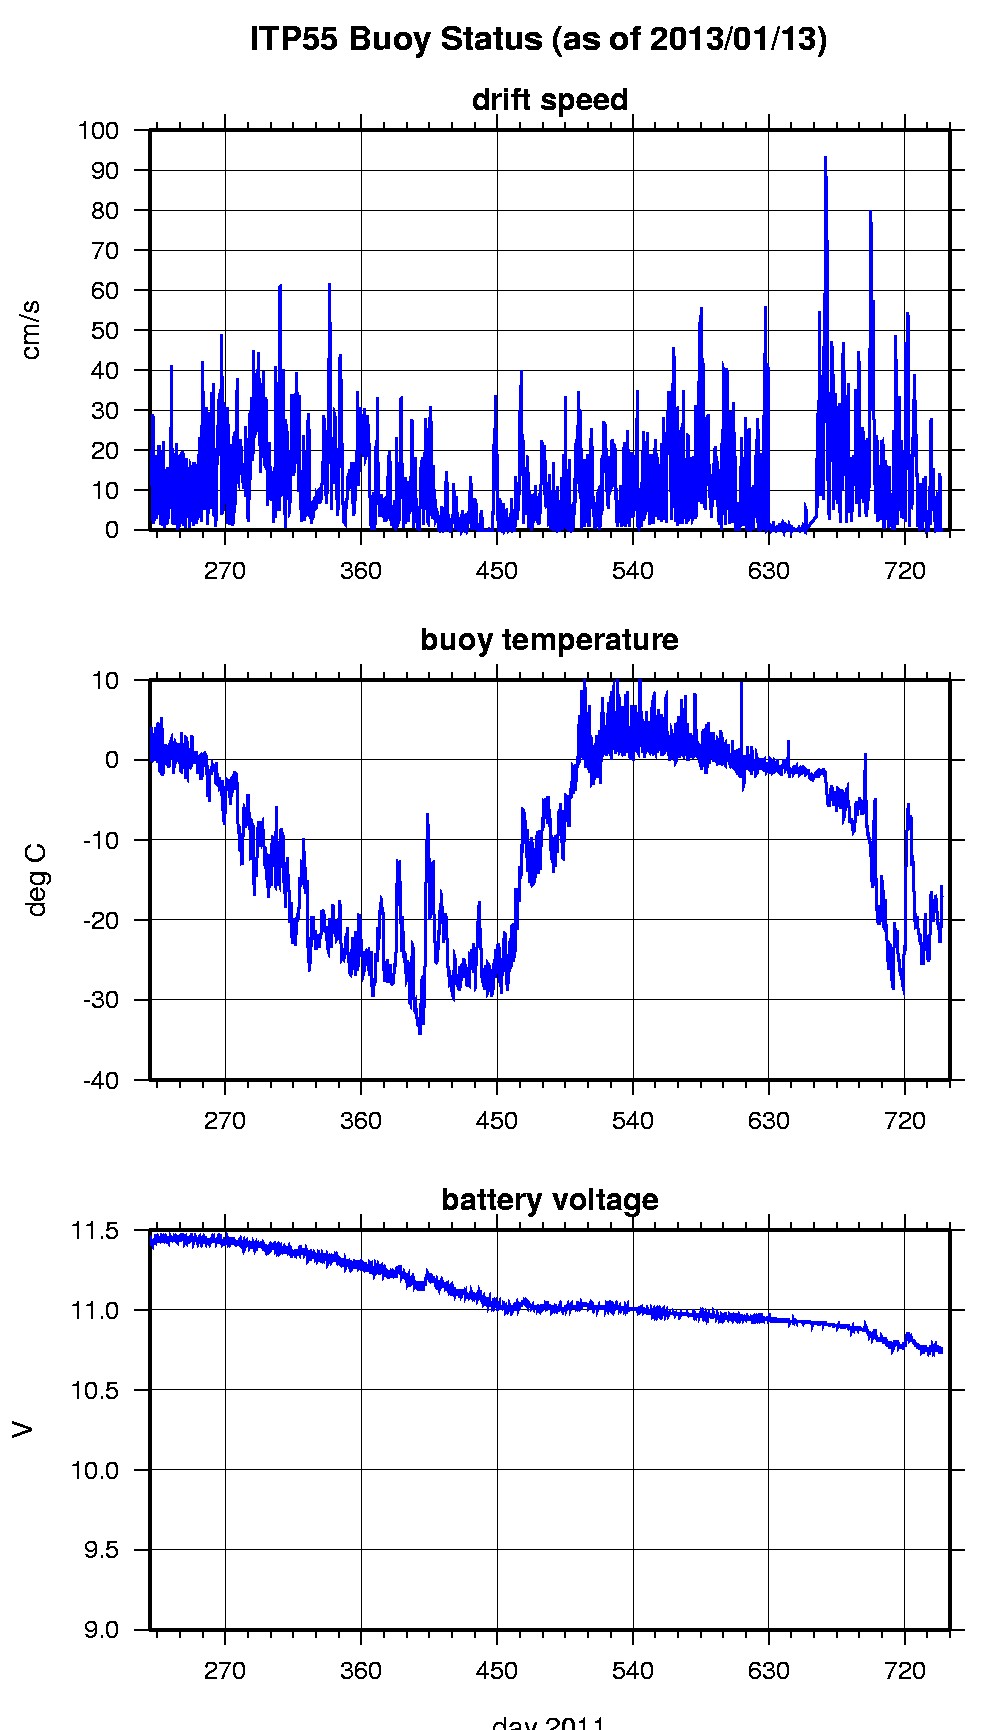
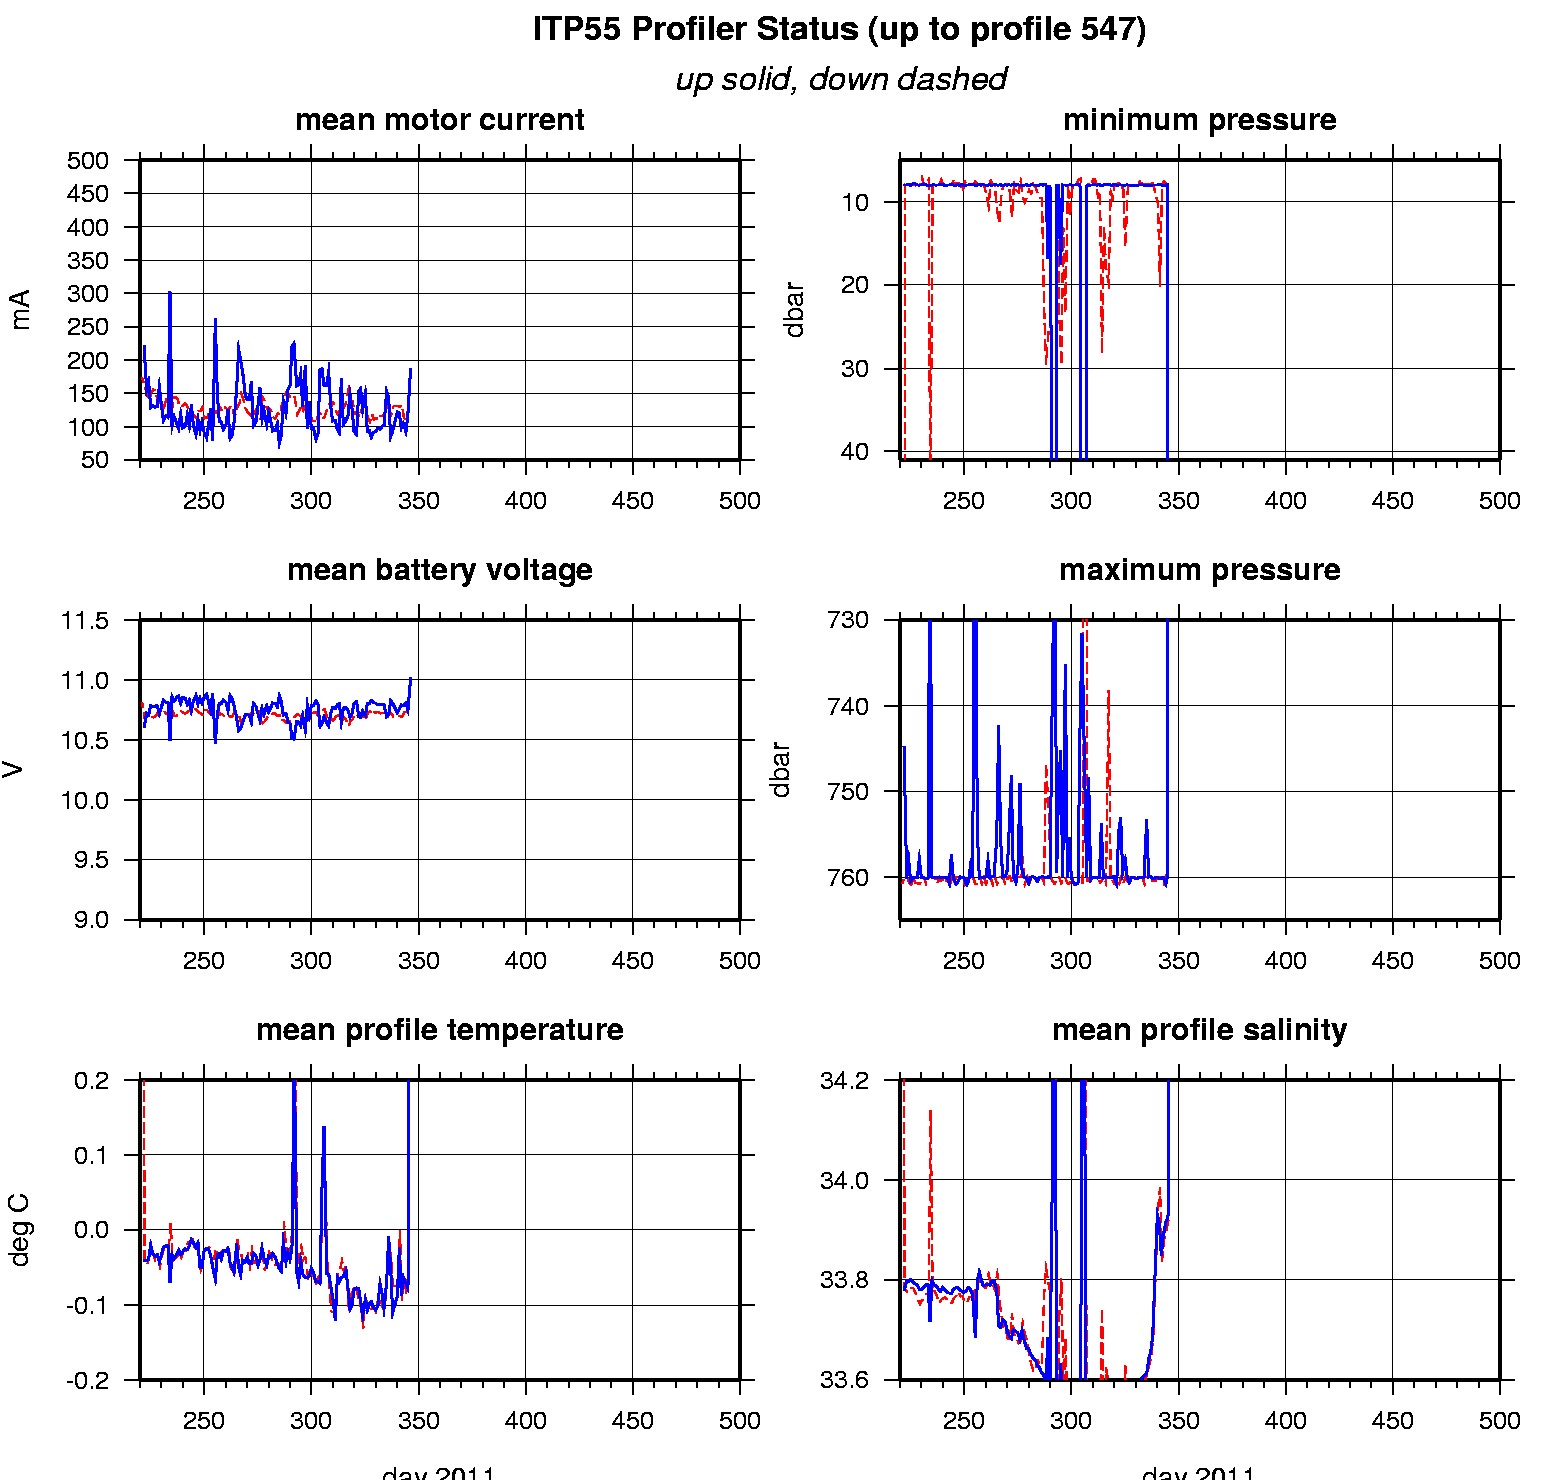
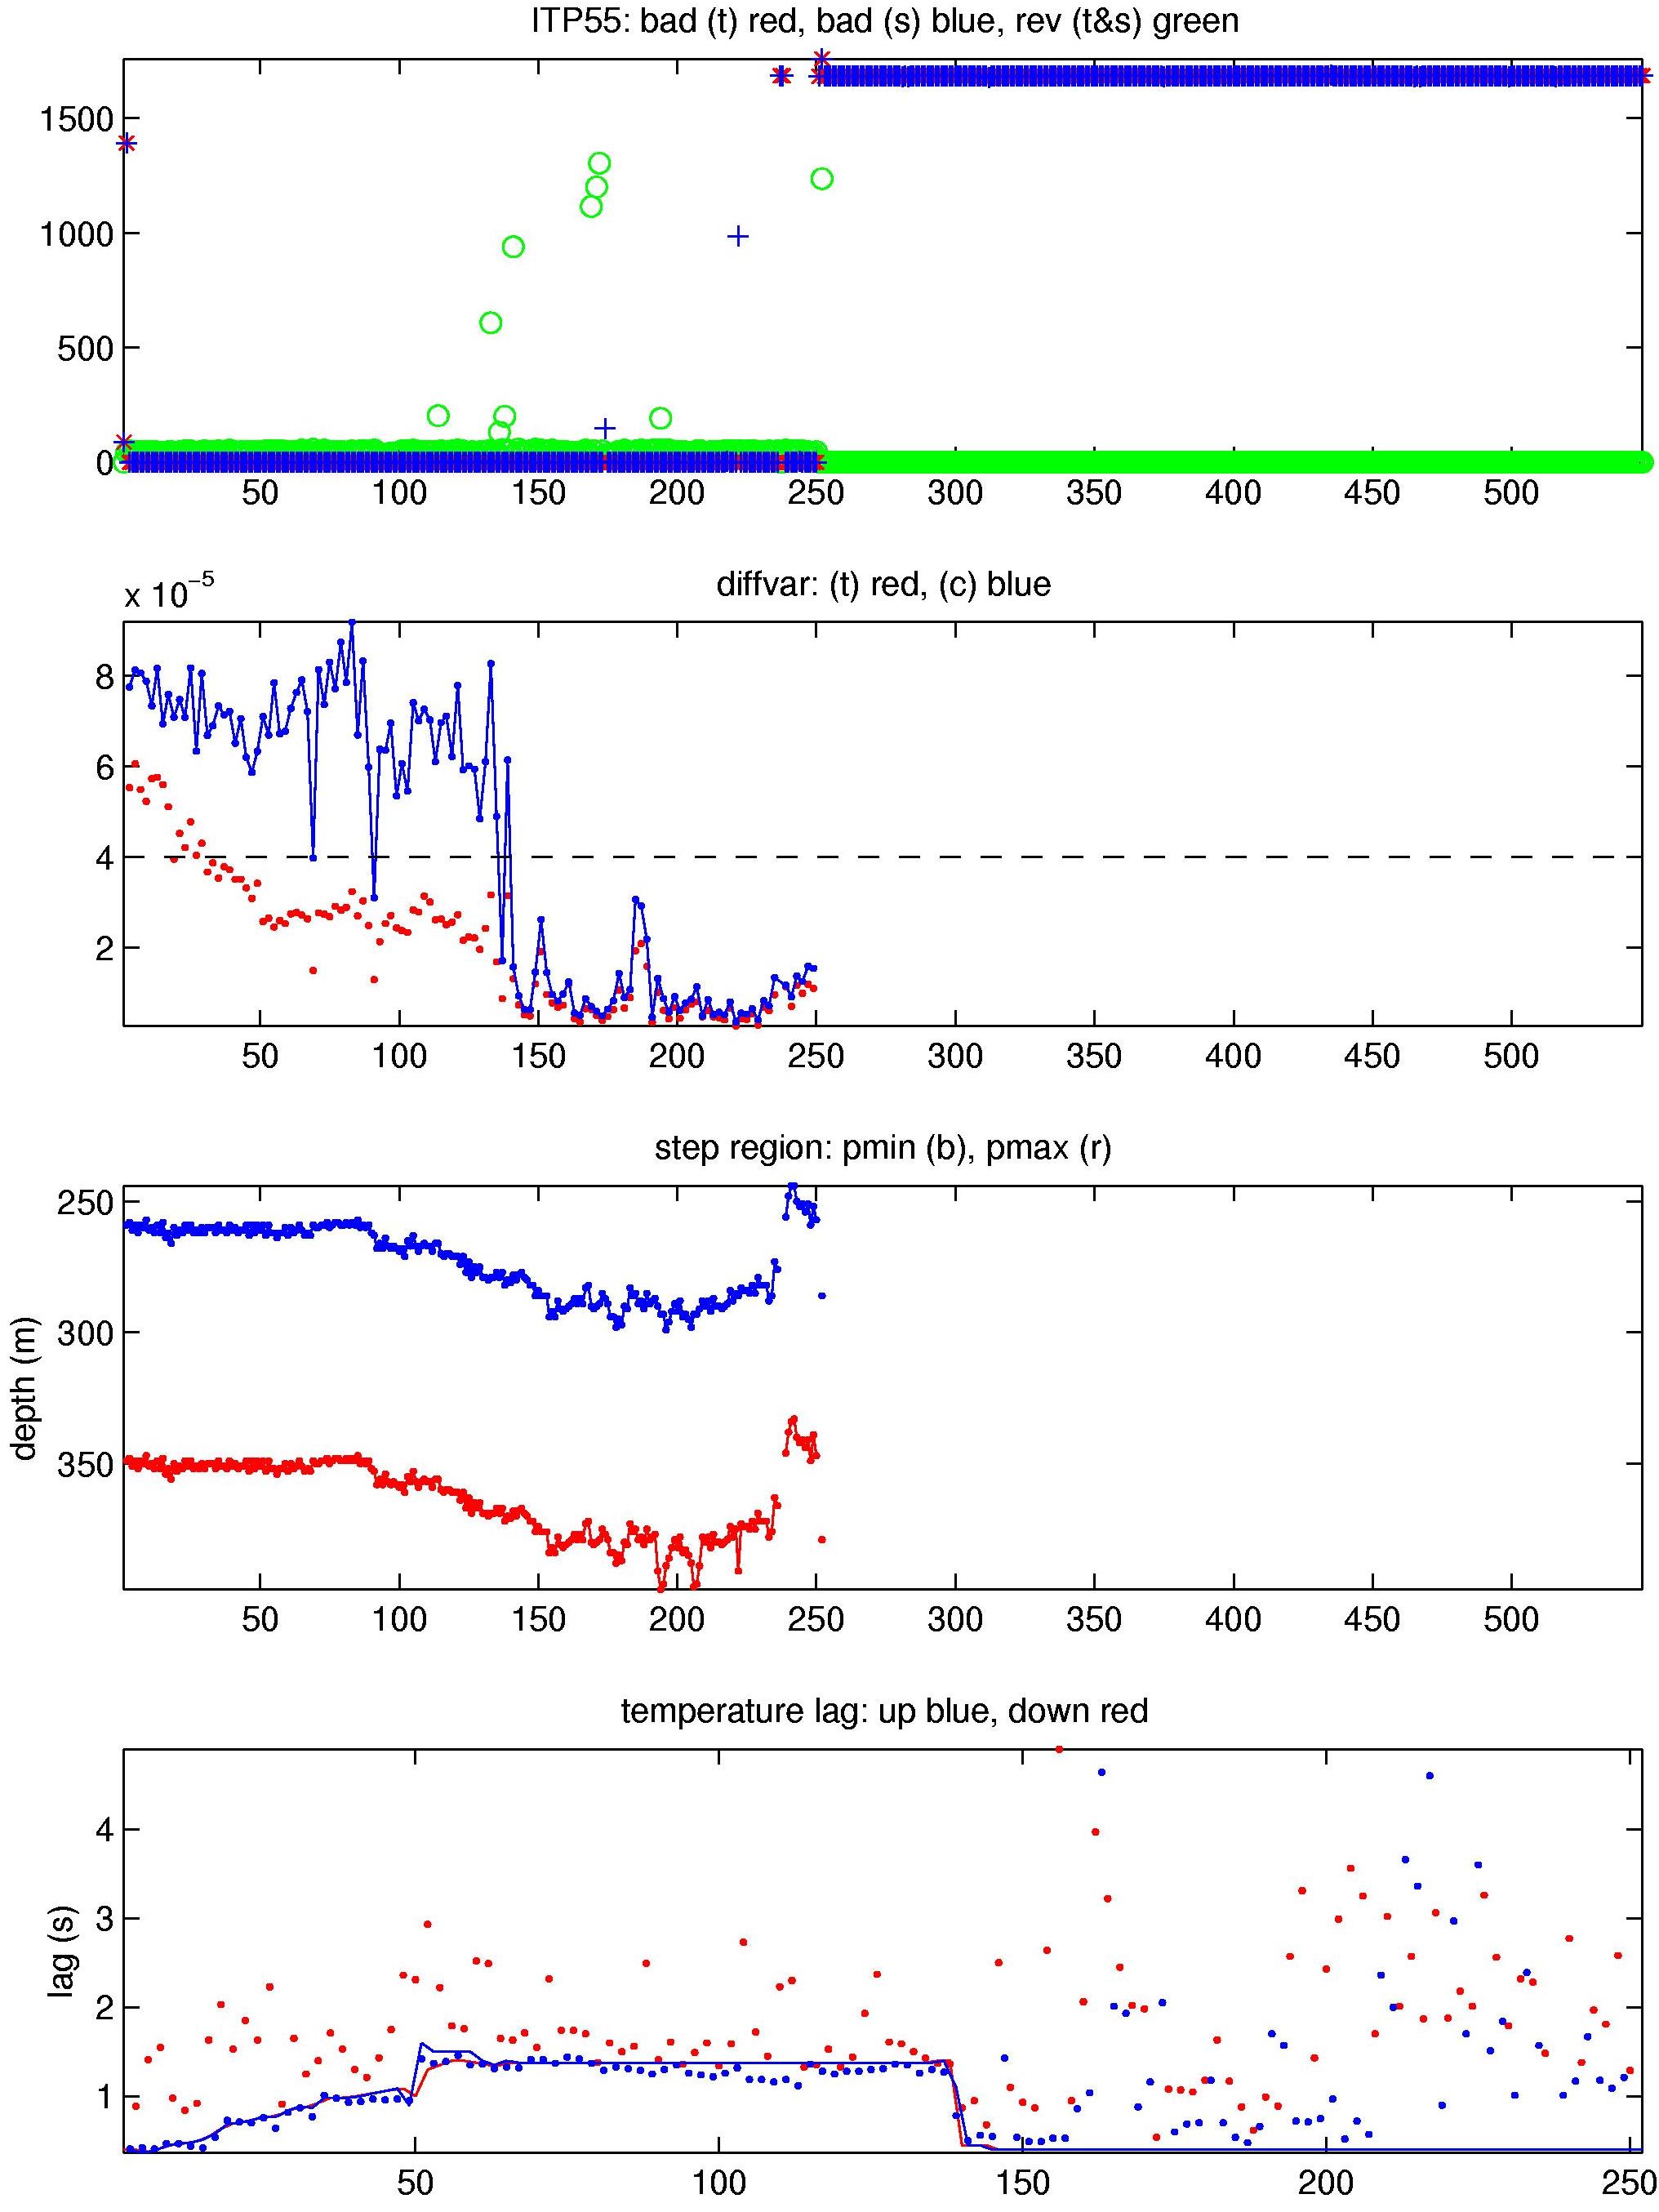
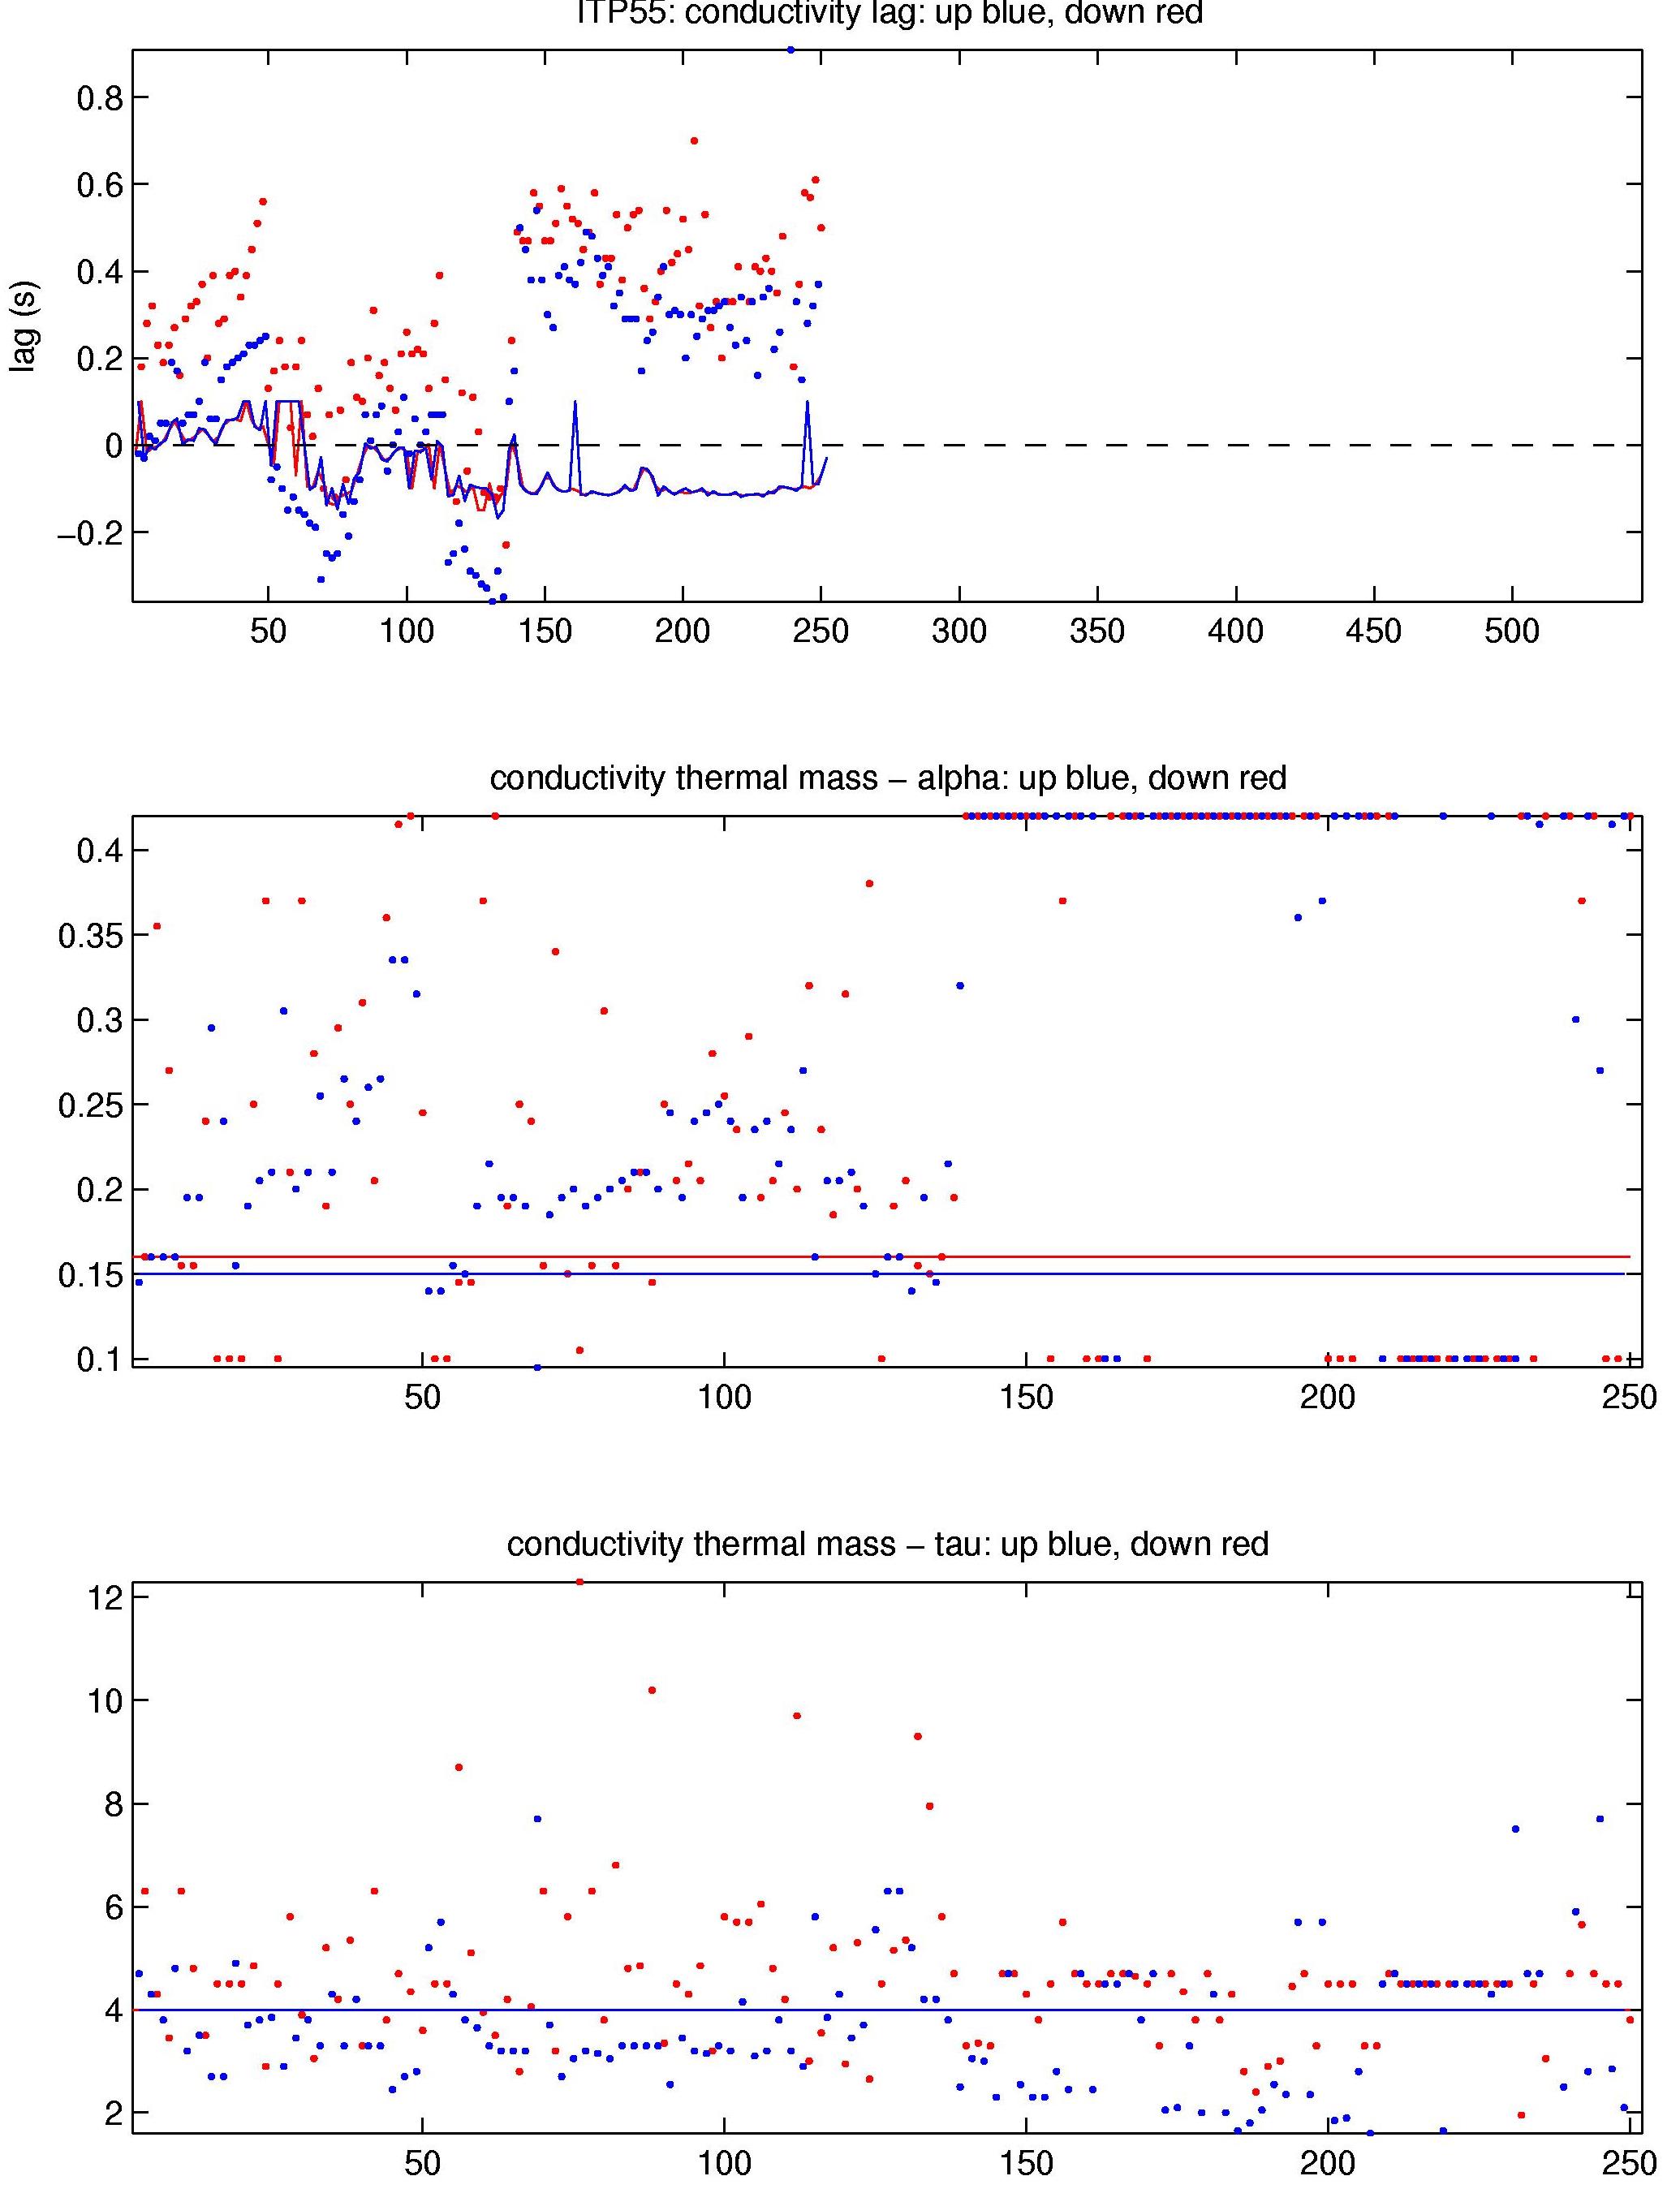
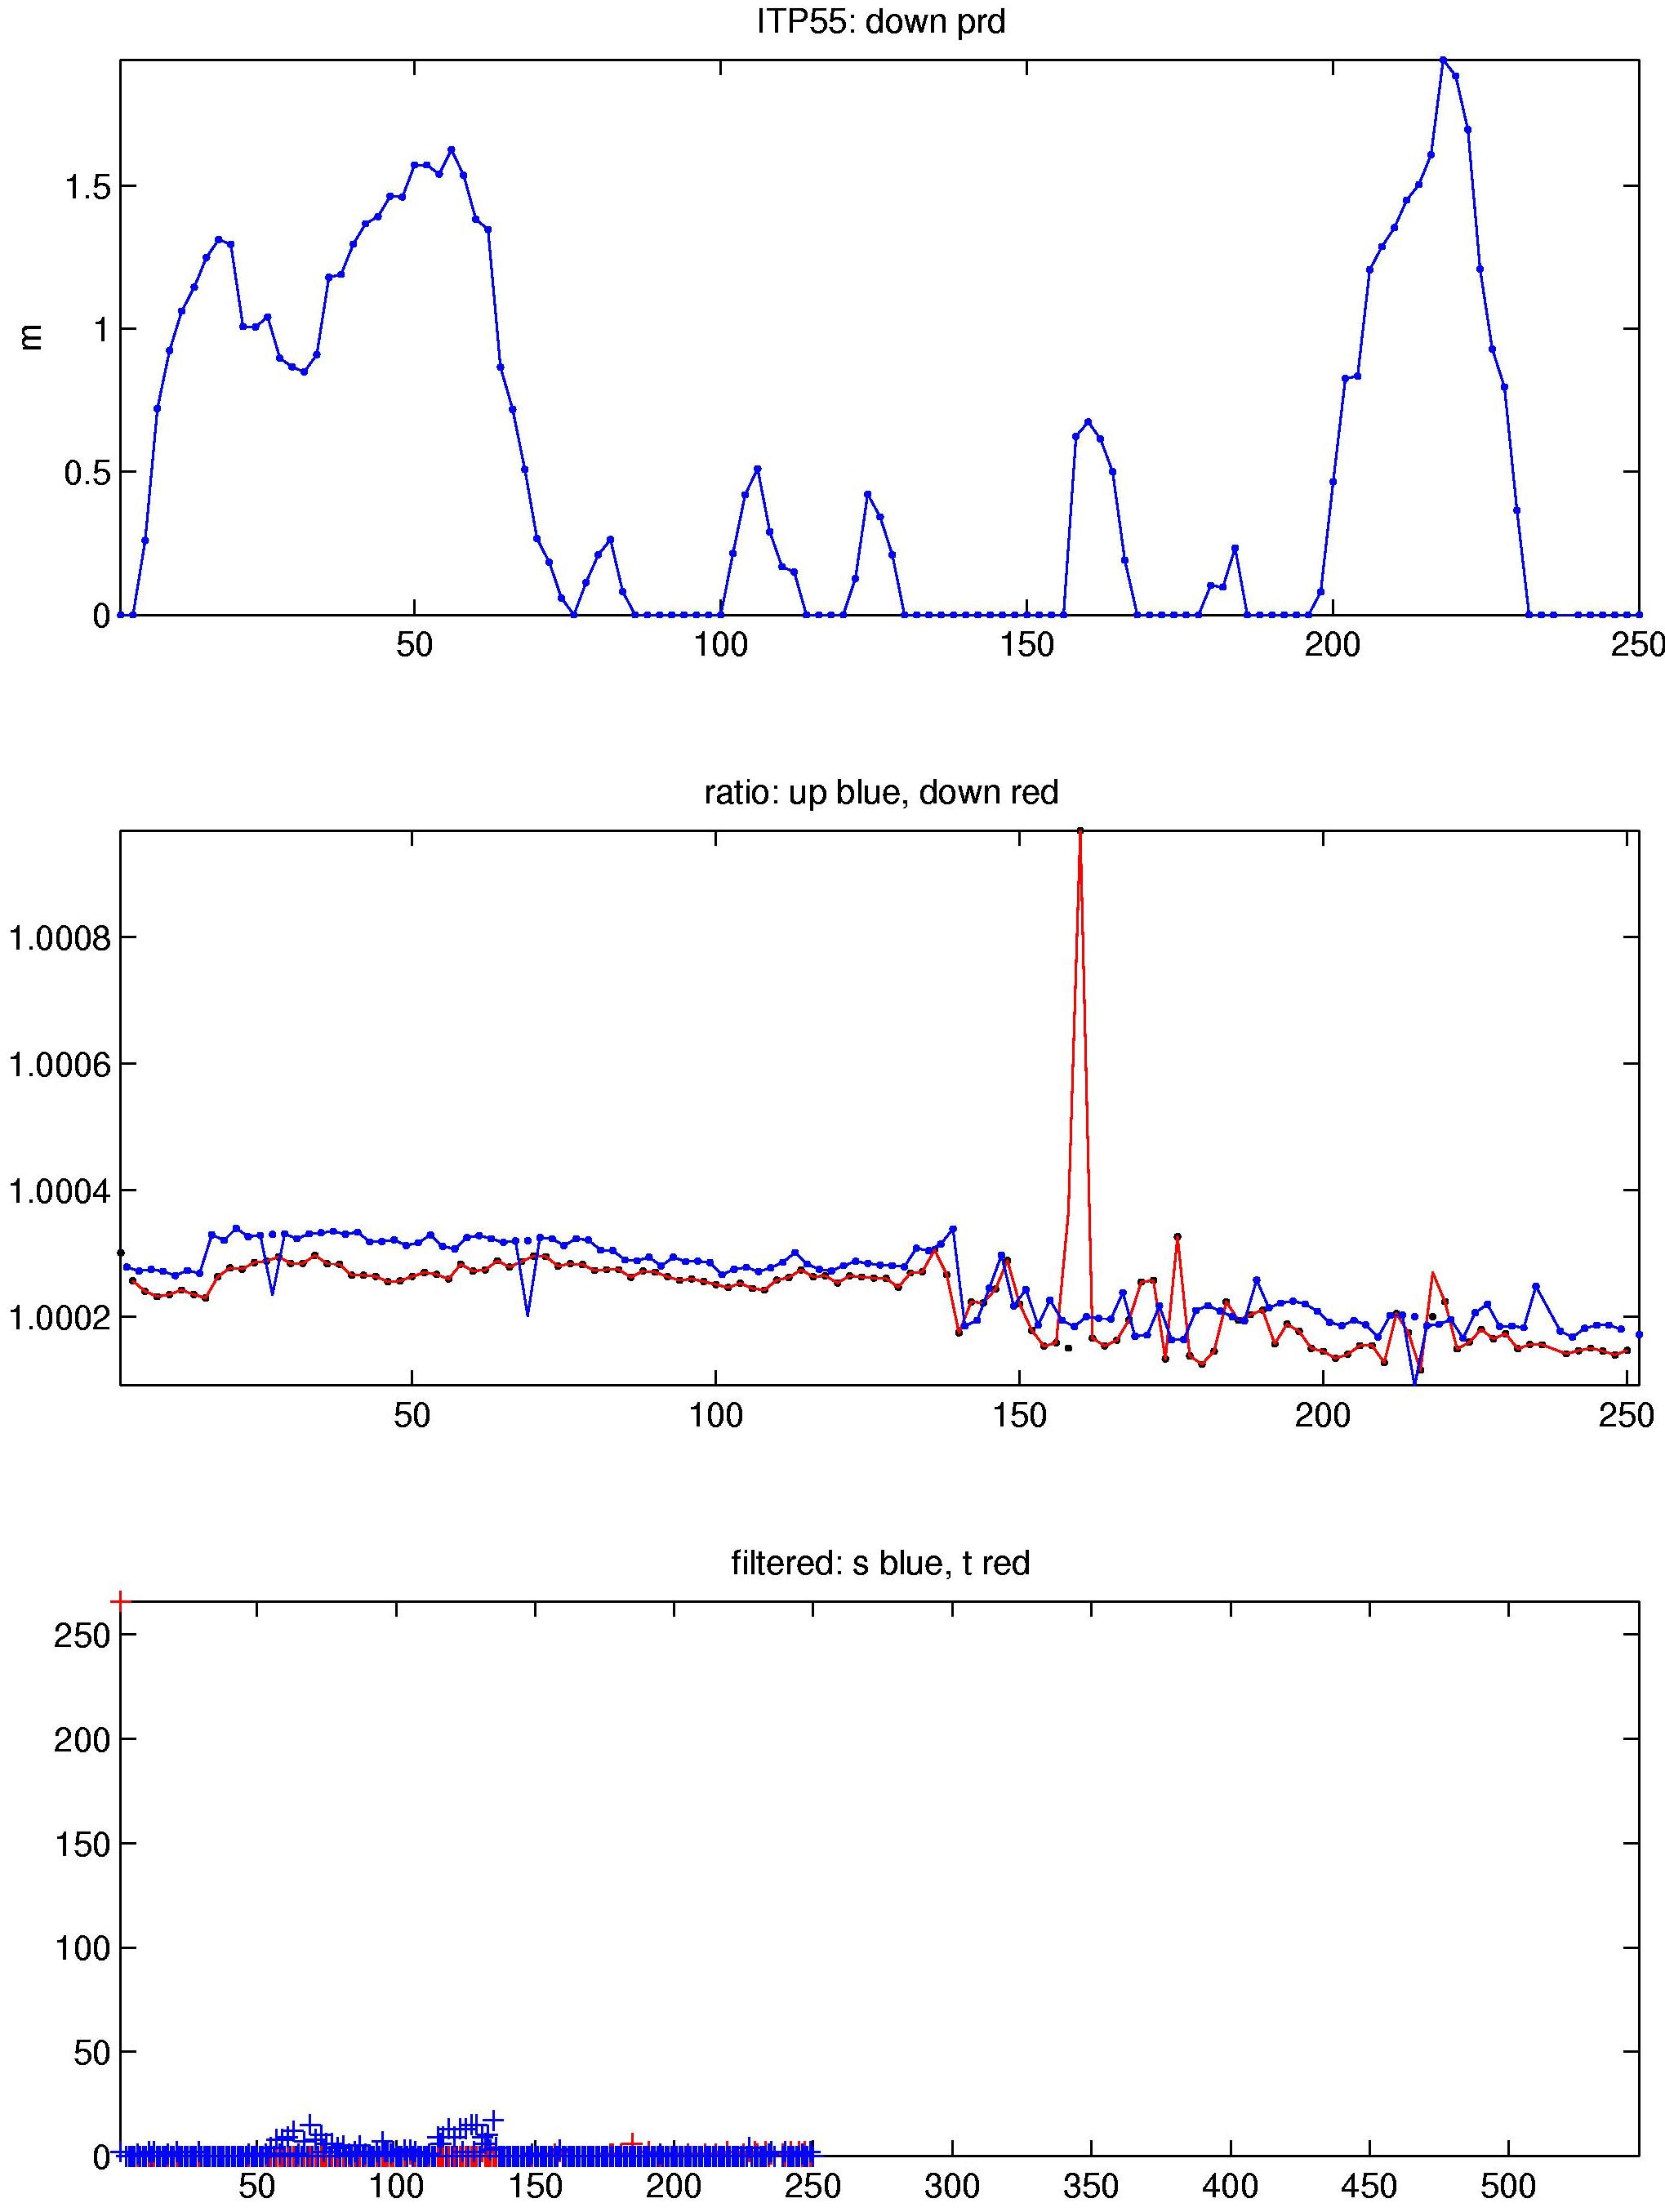
Of the 547 profiles that were transmitted from the ITP, only the first 251 actually profiled the water column (when the mooring anchor began dragging bottom), and these were processed according to the procedures described in the ITP Updated Data Processing Procedures. The processing parameters for are shown in the figures to the right. Before the mooring ran aground, buoy drift speeds did not prevent the profiler from covering nearly the full vertical extent of all but a few profiles that it communicated to the surface package.
Thermohaline staircases were well defined initially, and used to generate initial estimates for CTD lag corrections. However, the conductivity steps soon became smeared, both the temperature and conductivity lags drifted, and fixed lags had to be applied after profile 50.
See the Data Products tab to the left for descriptions of the three levels (I, II, III) of data processing and to access all data.
