ITP27 Data Processing
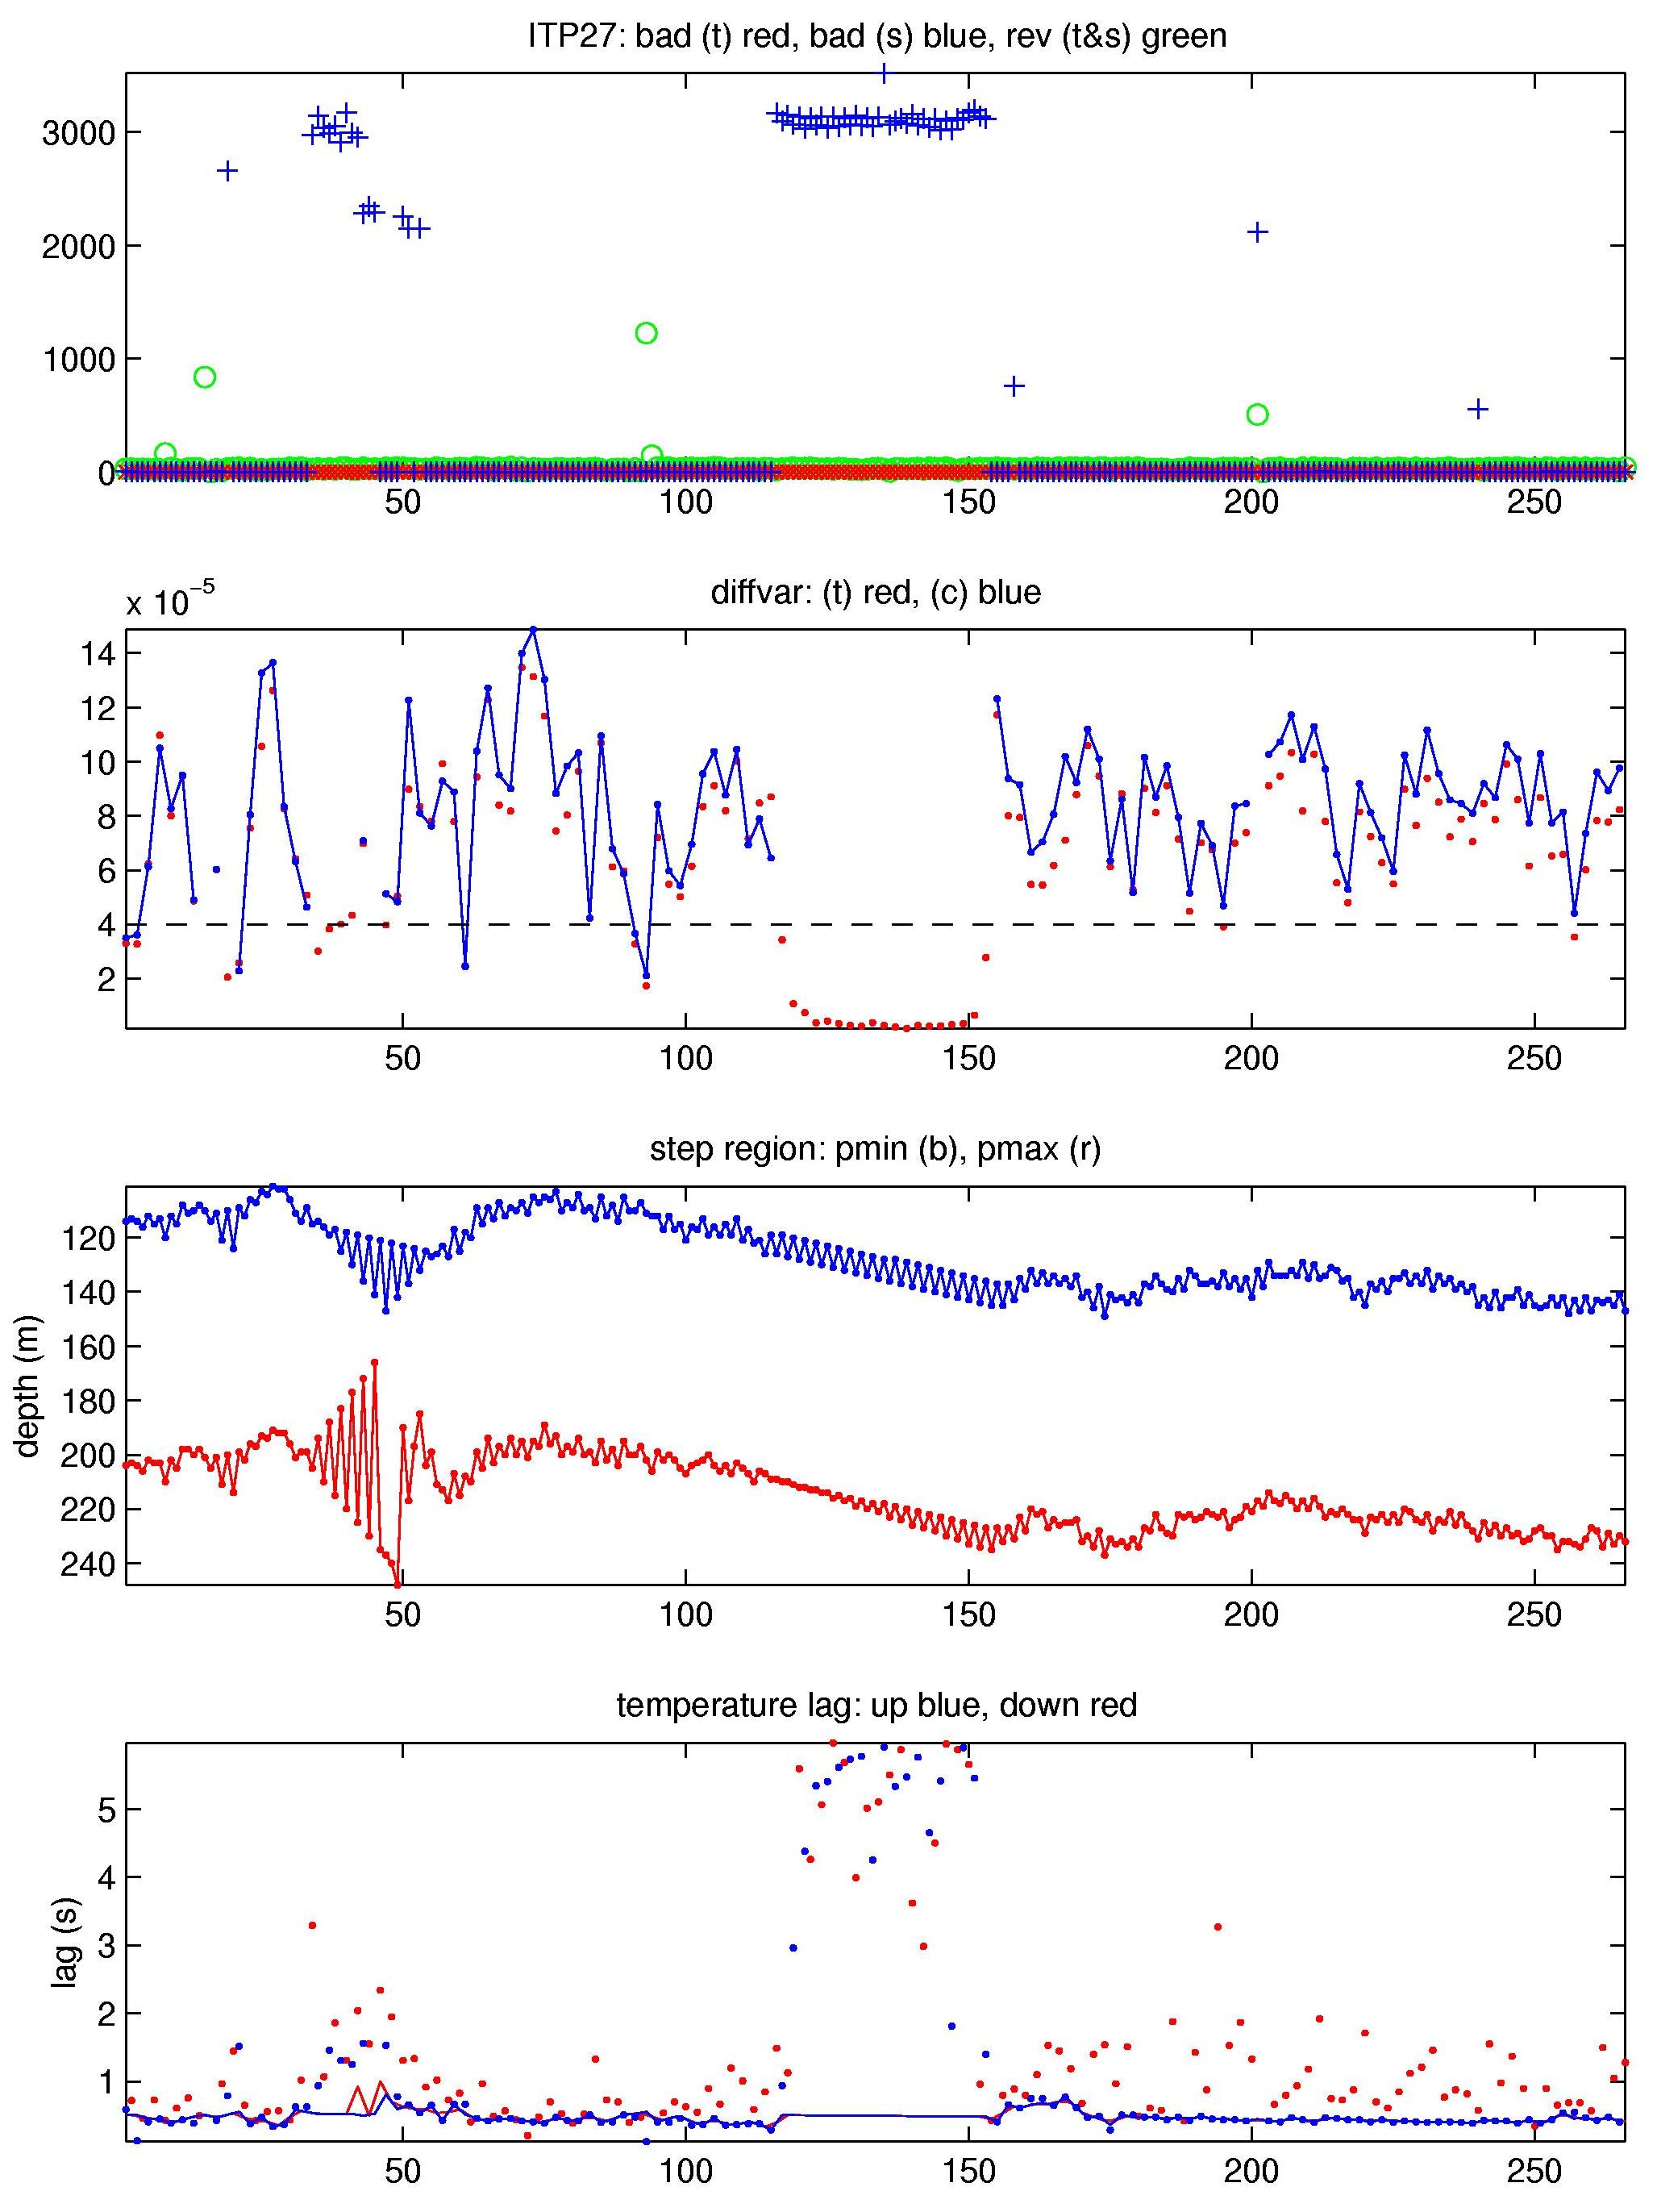
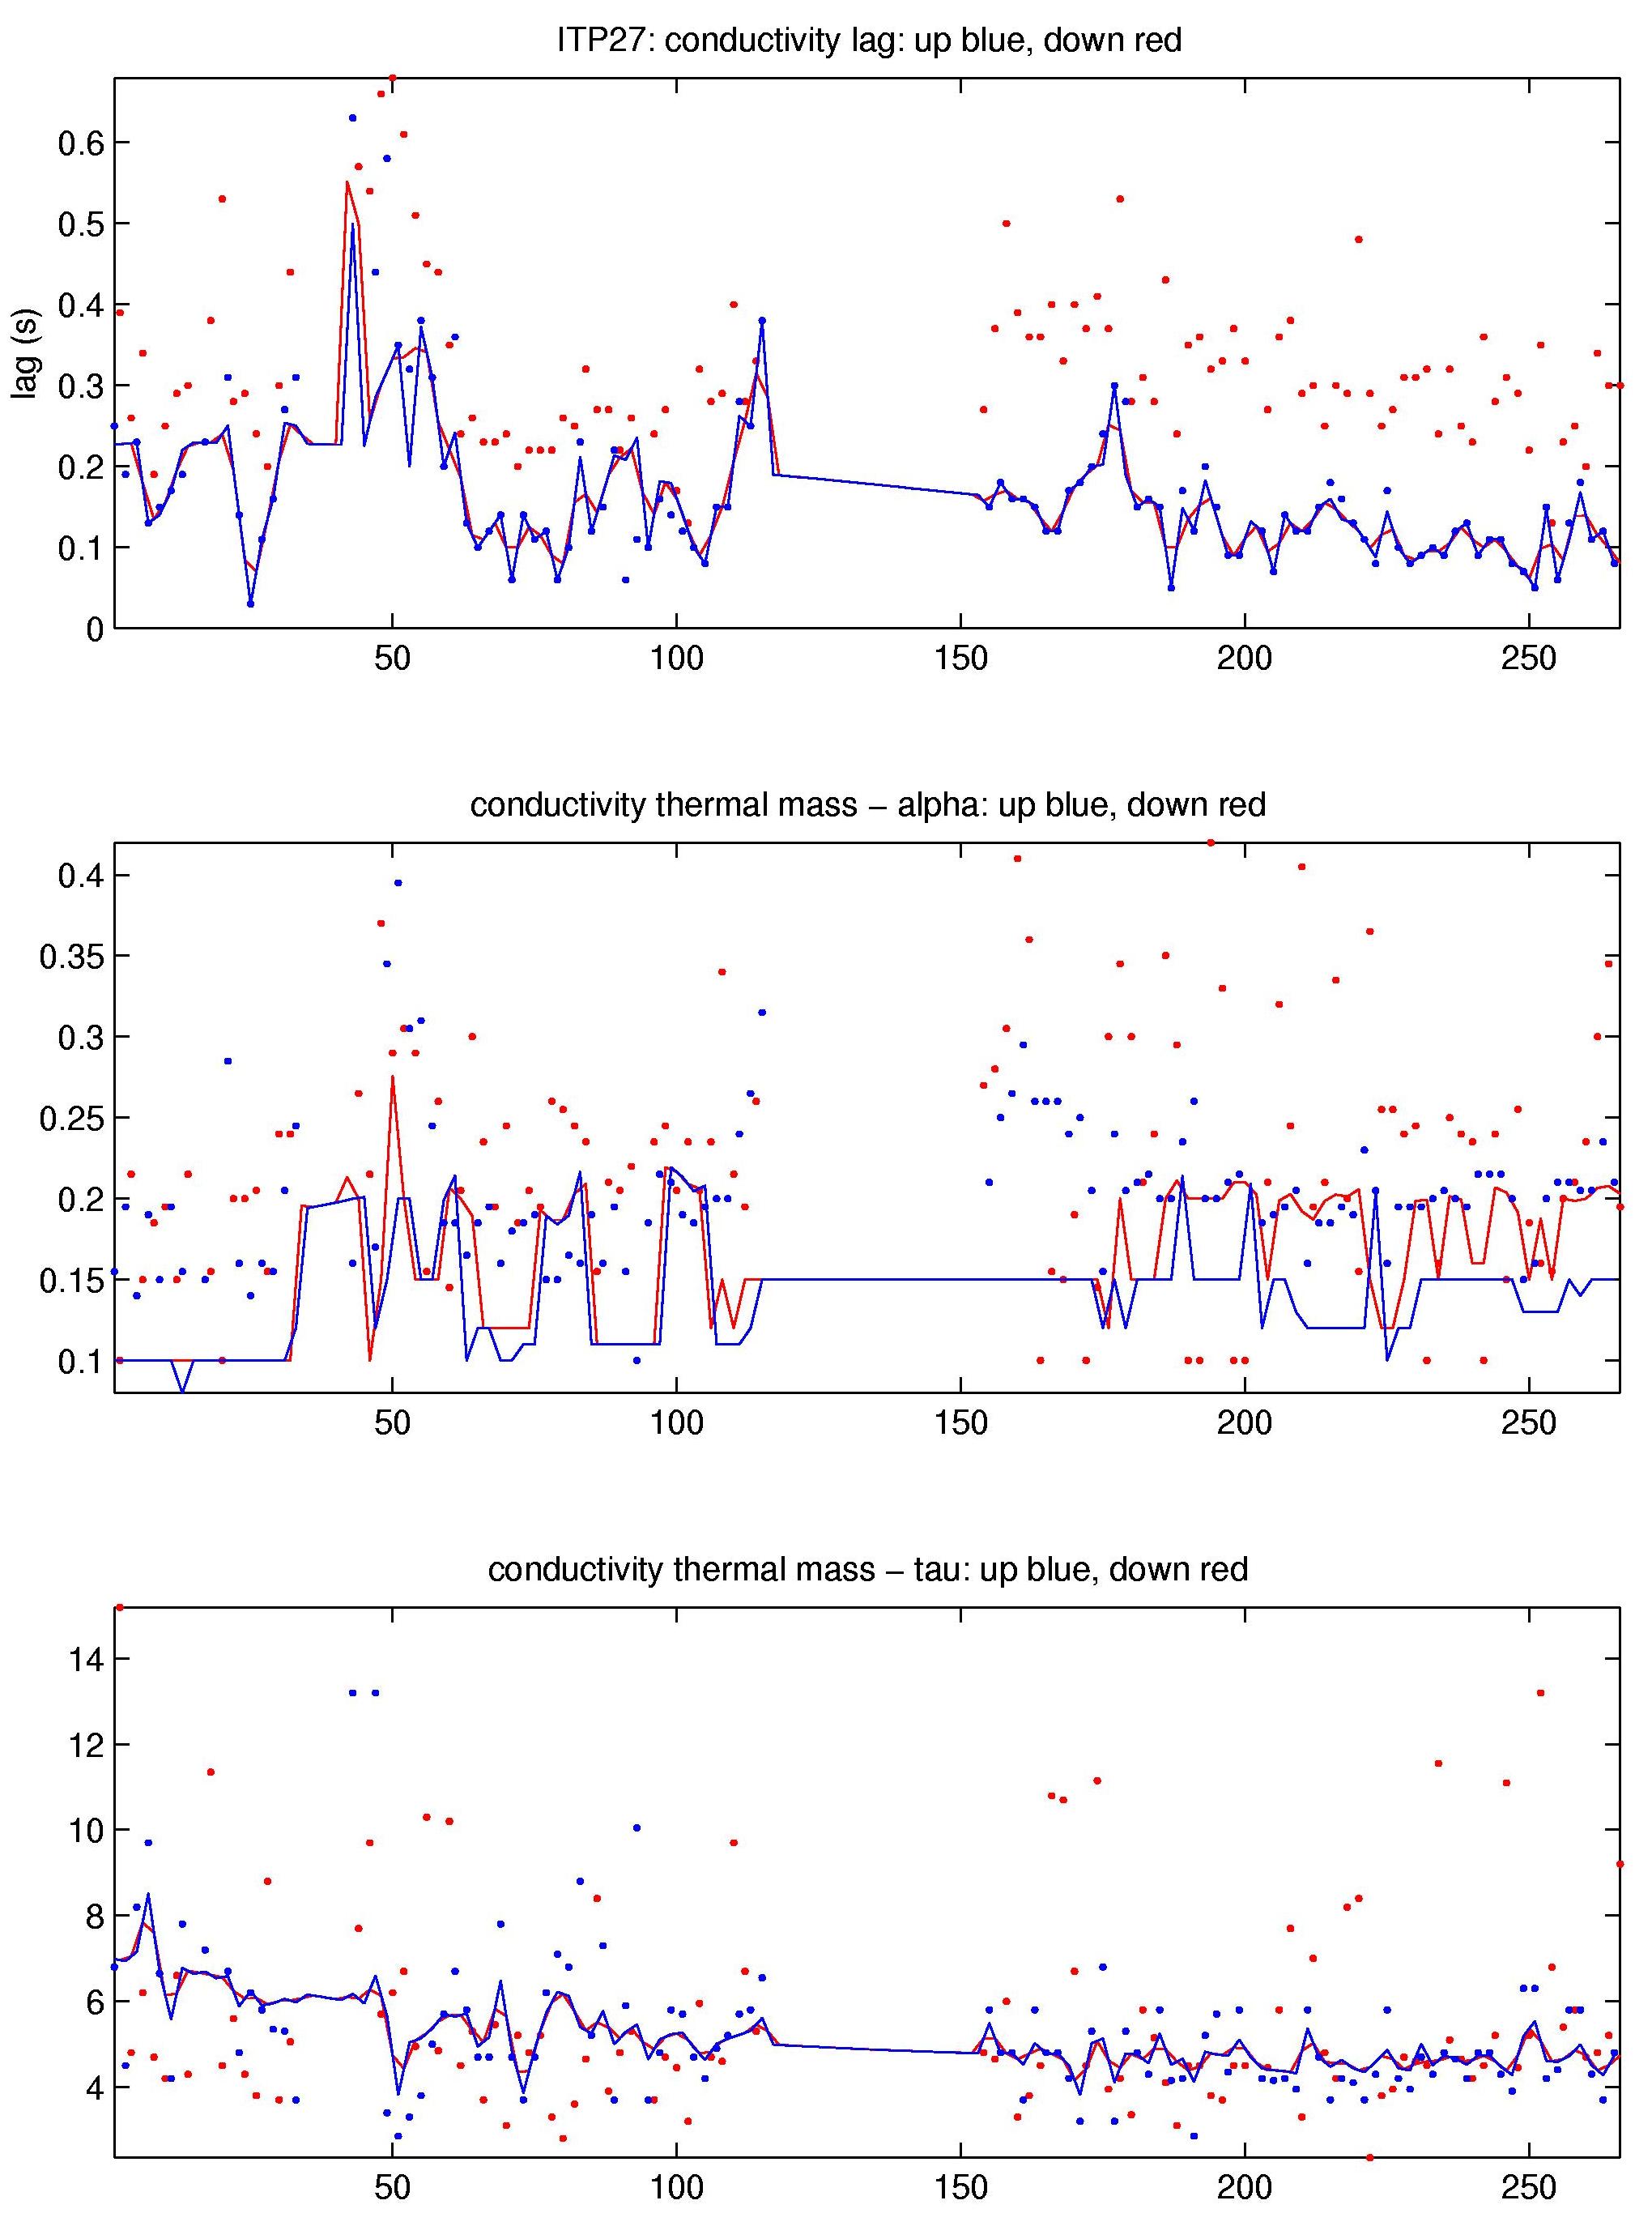
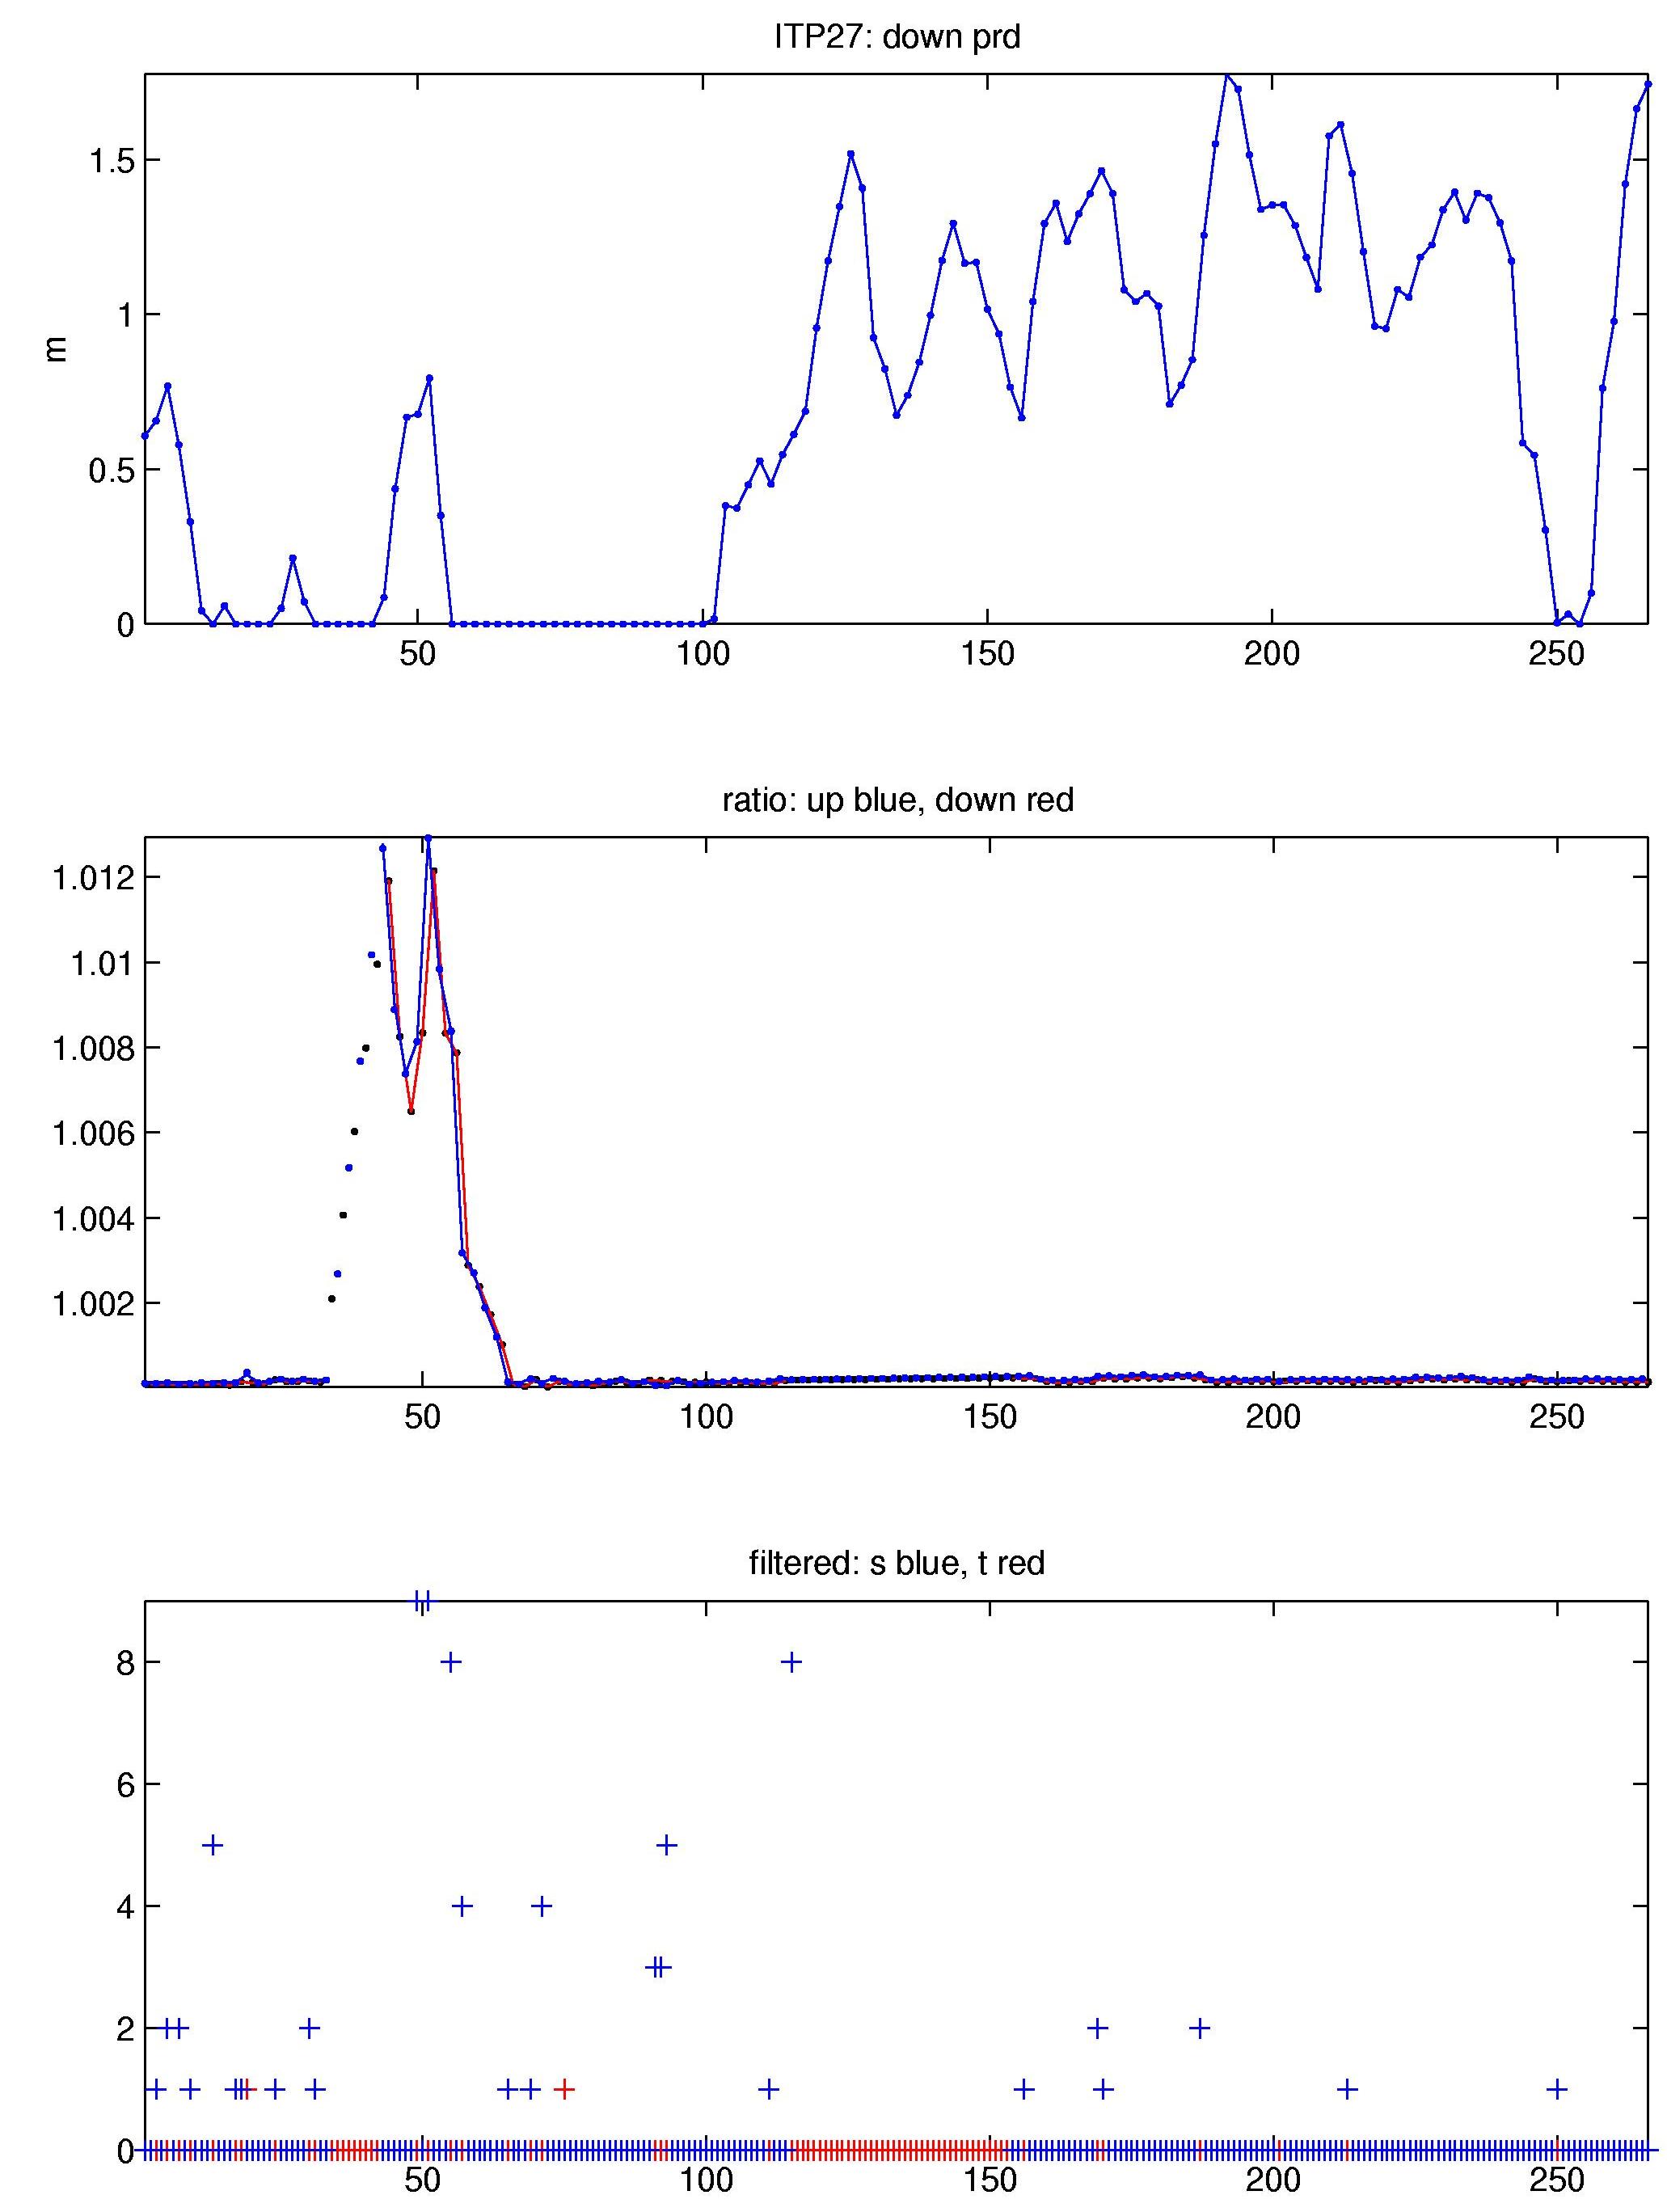
The 266 profiles that were obtained from ITP 27 were processed according to the procedures described in the ITP Updated Data Processing Procedures. The processing parameters for this ITP are shown in the figures to the right. As usual, some conductivity (salinity) data were affected by biofouling or similar glitches. This included a few instances of the typical short-term spikes that affected only one or a few vertical bins. A small number of cases occurred where larger portions of a profile were contaminated. In addition, however, there were two longer sets were whole profile were eliminated. For the first set, profiles 34 through 64, the onset of the large contaminations was very obvious, while the return to normal occurred more slowly. After differences between up- and down profiles had disappeared and the vertical salinity structure had returned to patterns observed before the onset of contaminations, a conductivity adjustment was still needed for a small number of profiles at the end of the set to align T/S over the deepest portion of the profiles. Given how well the alignment worked, however, we found the adjusted profiles fit to be included in the final record. Temperature profiles throughout the set showed no up/down differences or other obvious outliers, retained a sharp step region throughout the set, and were retained for the final data.
The second set lasted longer (profiles 116 through 154), and was characterized by very large up/down conductivity differences. The start of contaminations as well as the return to a clean cell was fairly obvious. Further, no conductivity adjustment was needed for the first acceptable conductivity profiles. In contrast to the first set, however, temperature appeared to be affected as well, in that a distinct step region that was present before and after the set was missing while conductivity was contaminated. The observed pattern seemed consistent with significant flow obstruction of the TS duct that let to a vertical smoothing of the temperature profile. However, since there was no up/down difference, and since the larger scale vertical pattern of the profiles appeared reasonable, we retained temperature for this set as well, but these data should be considered questionable.
Thermohaline staircases were present for a large portion of the time series, enabling CTD lag corrections. The lags were in the typical range found for previous systems. During manual editing, thermal lag corrections were dialed back somewhat to remove overcompensation. Other parameters such as the thermistor lag corrections ("tlag" in the code) and the conductivity-temperature time offsets ("cshift") were slightly modified for a very small number of profiles. Aside from the larger conductivity adjustment (also called calibration, "fac") mentioned above, only one further profile saw a small adjustment to better align deep TS; the new value of "fac" also corresponded more closely to its neighboring values.
See the Data Products tab to the left for descriptions of the three levels (I, II, III) of data processing and to access all data.
