ITP21 Data Processing
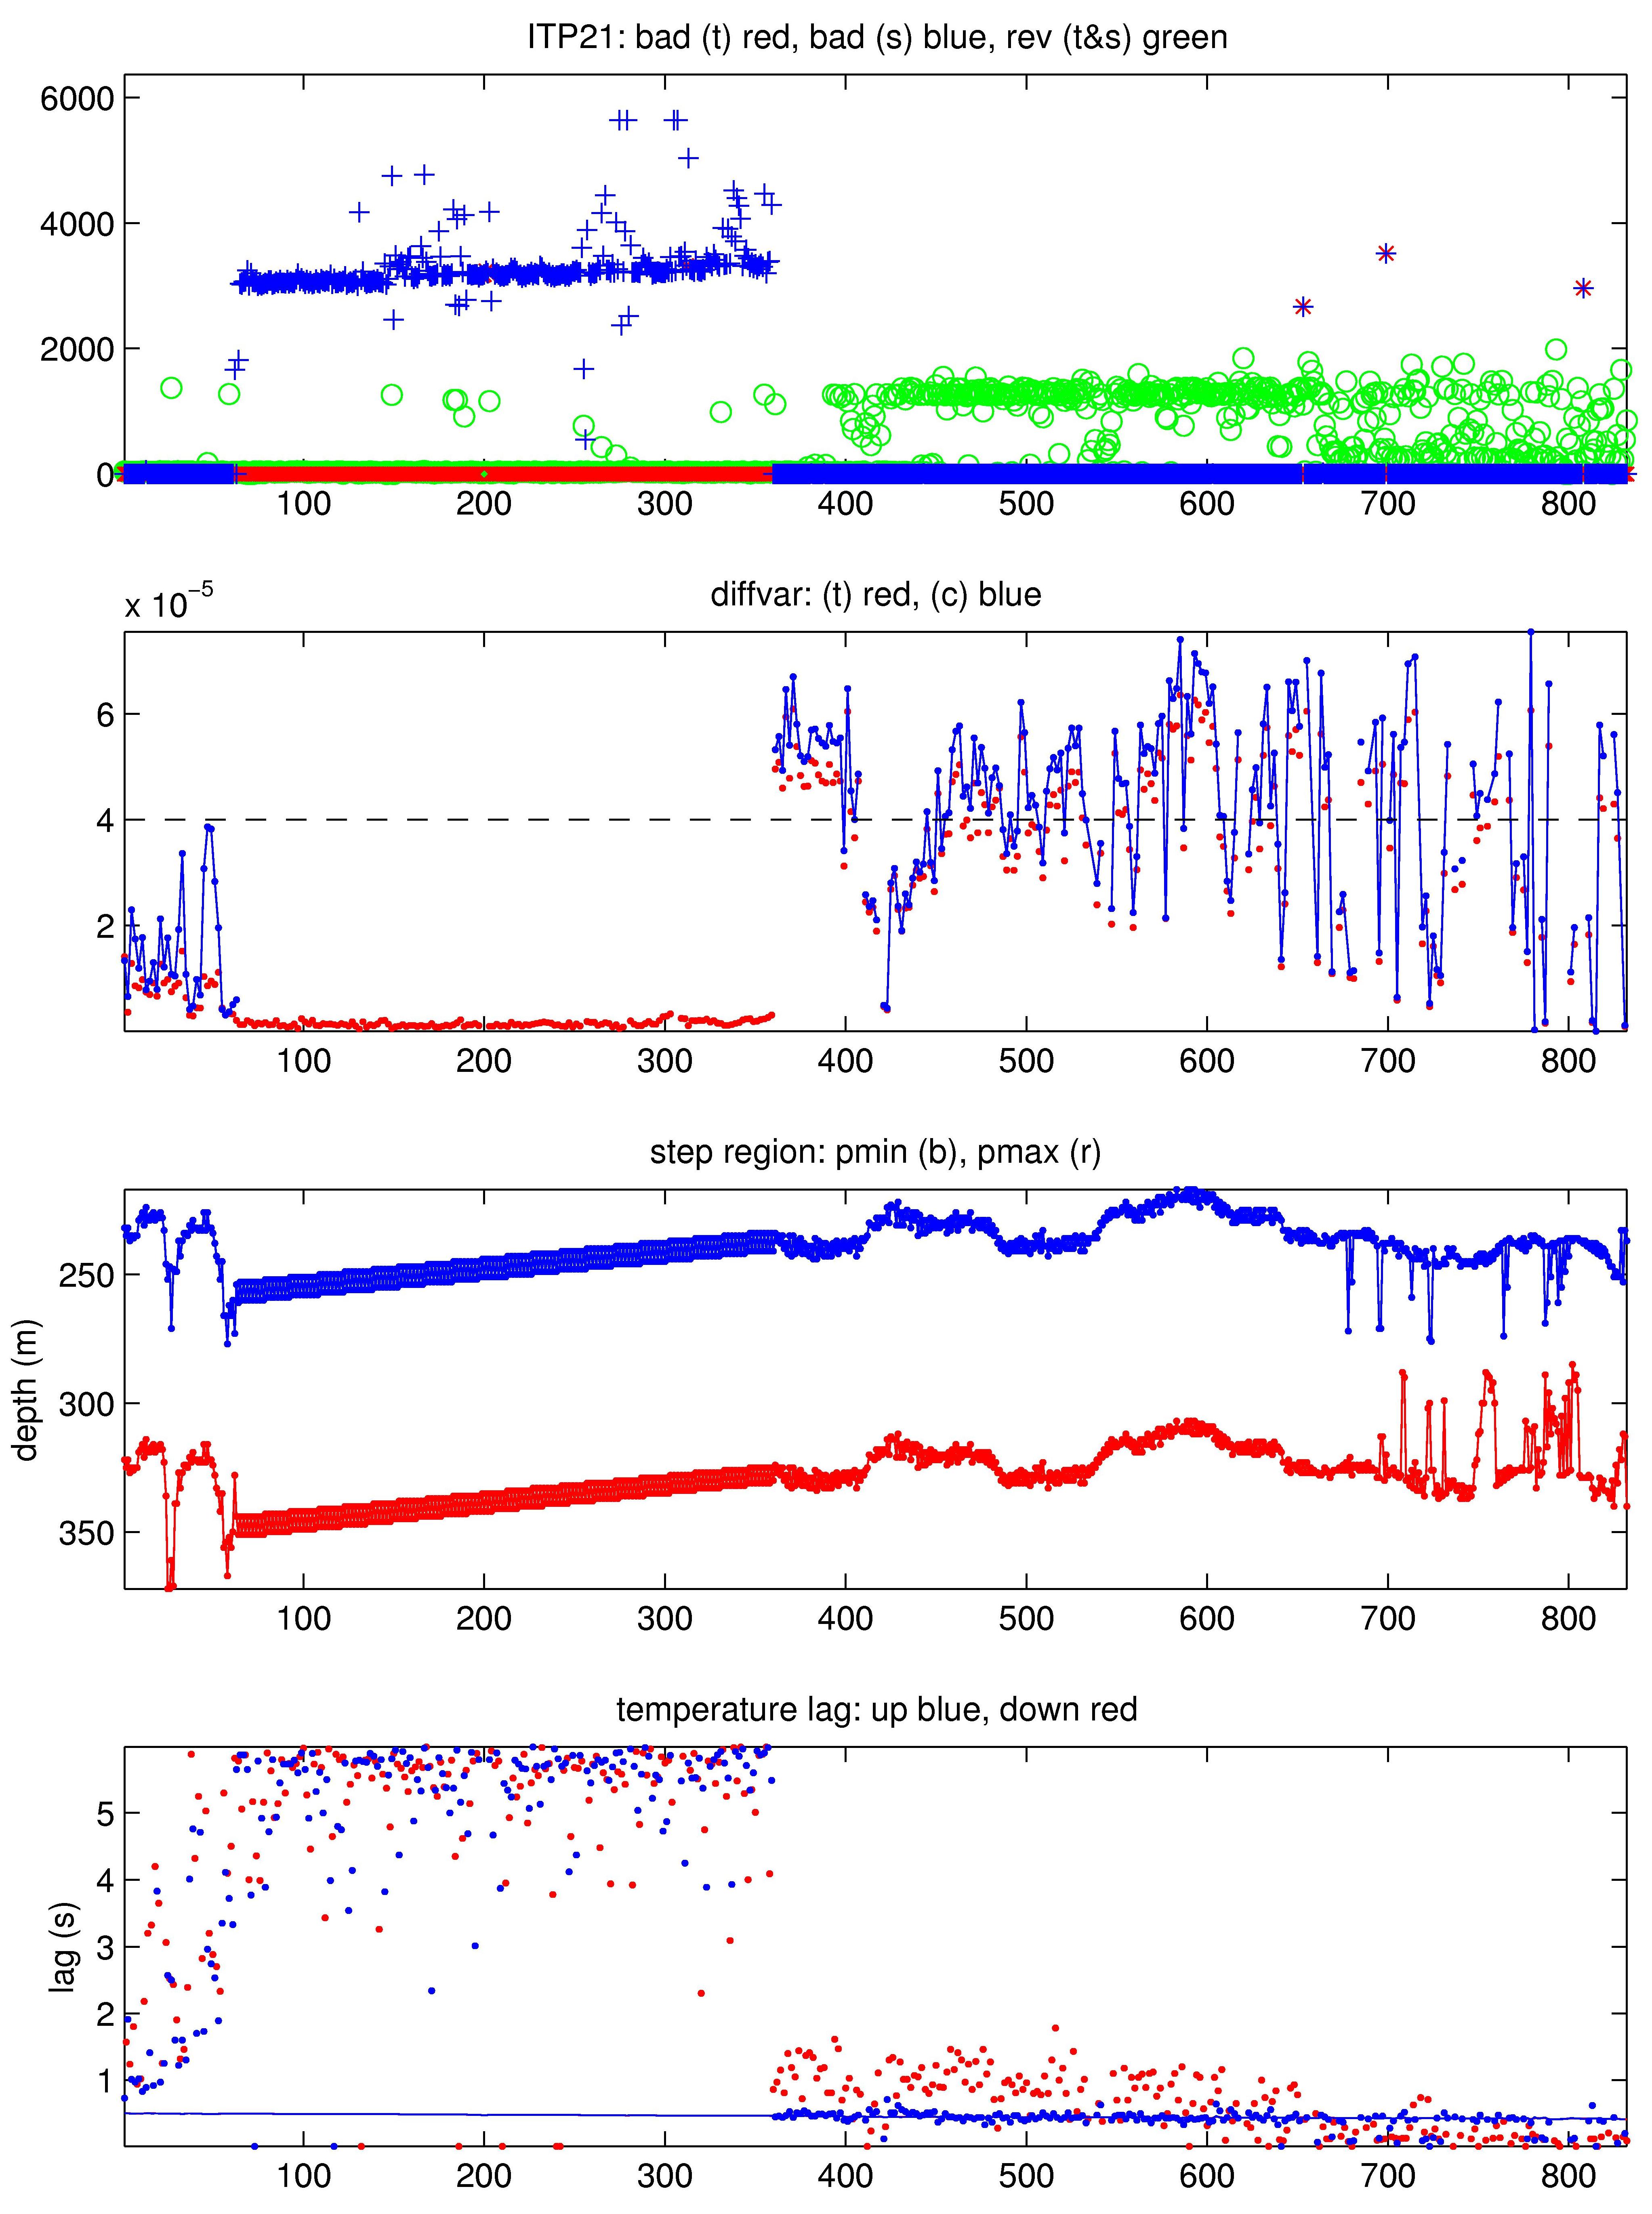
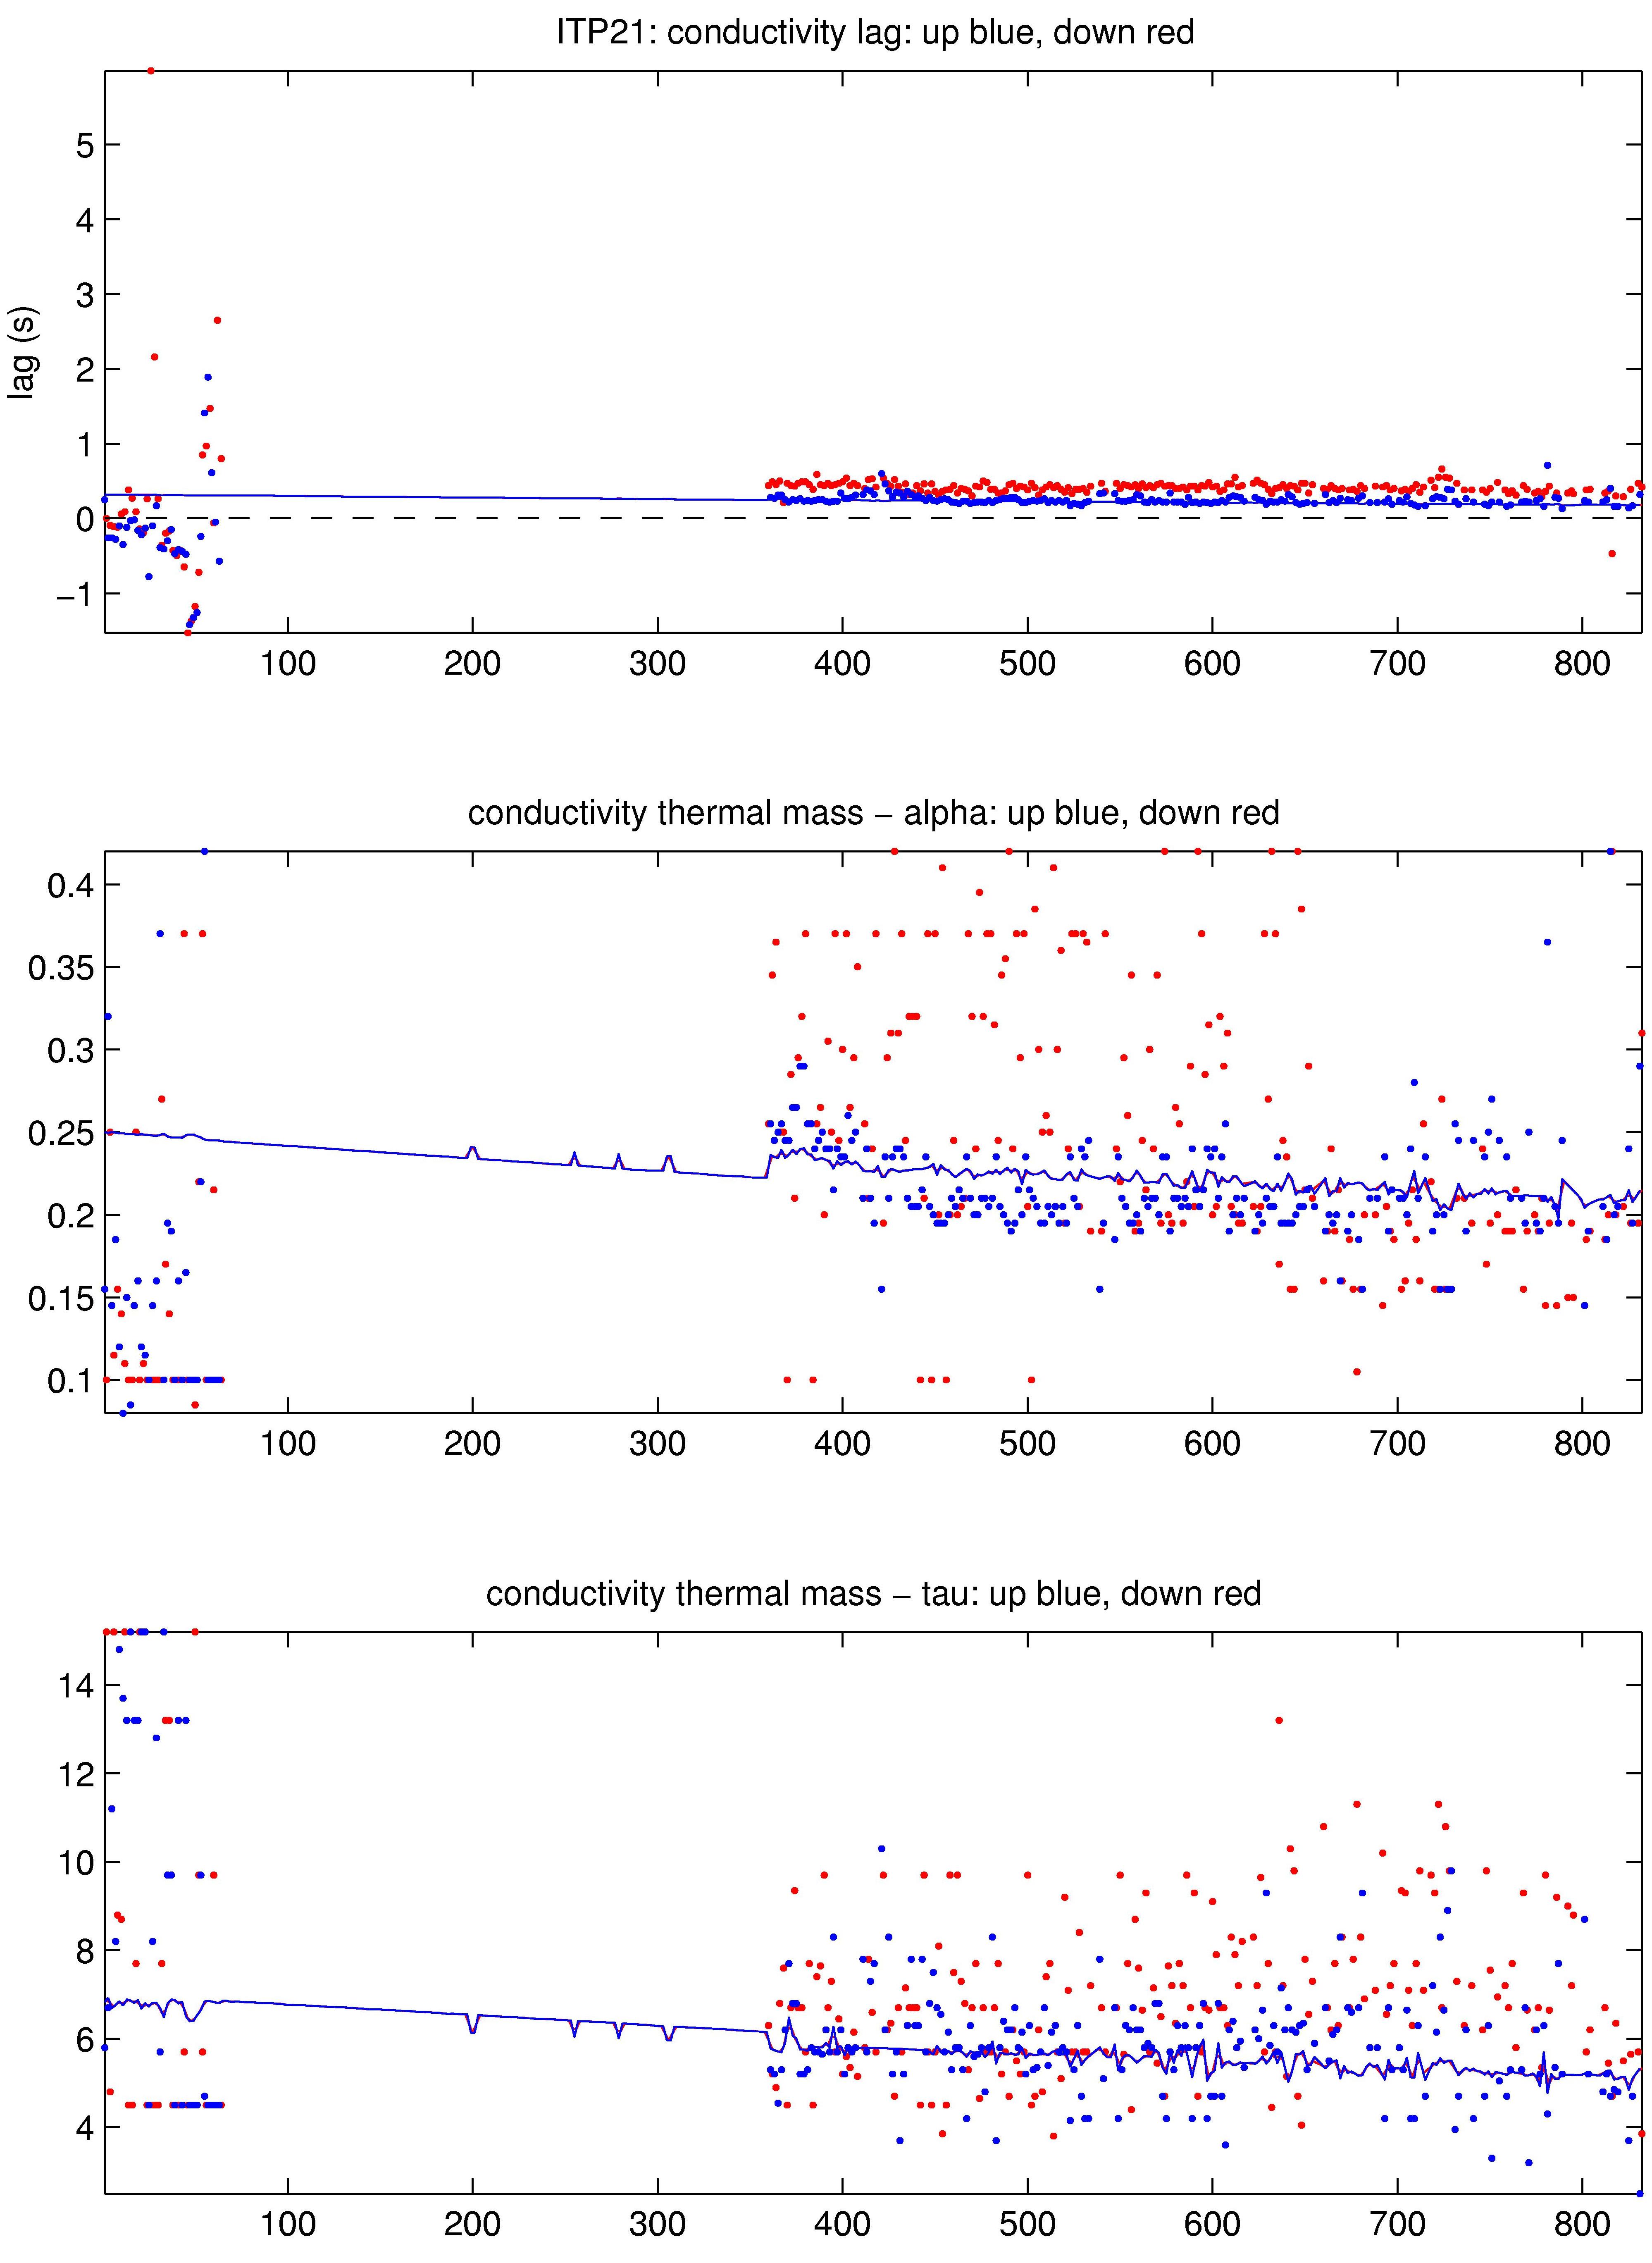
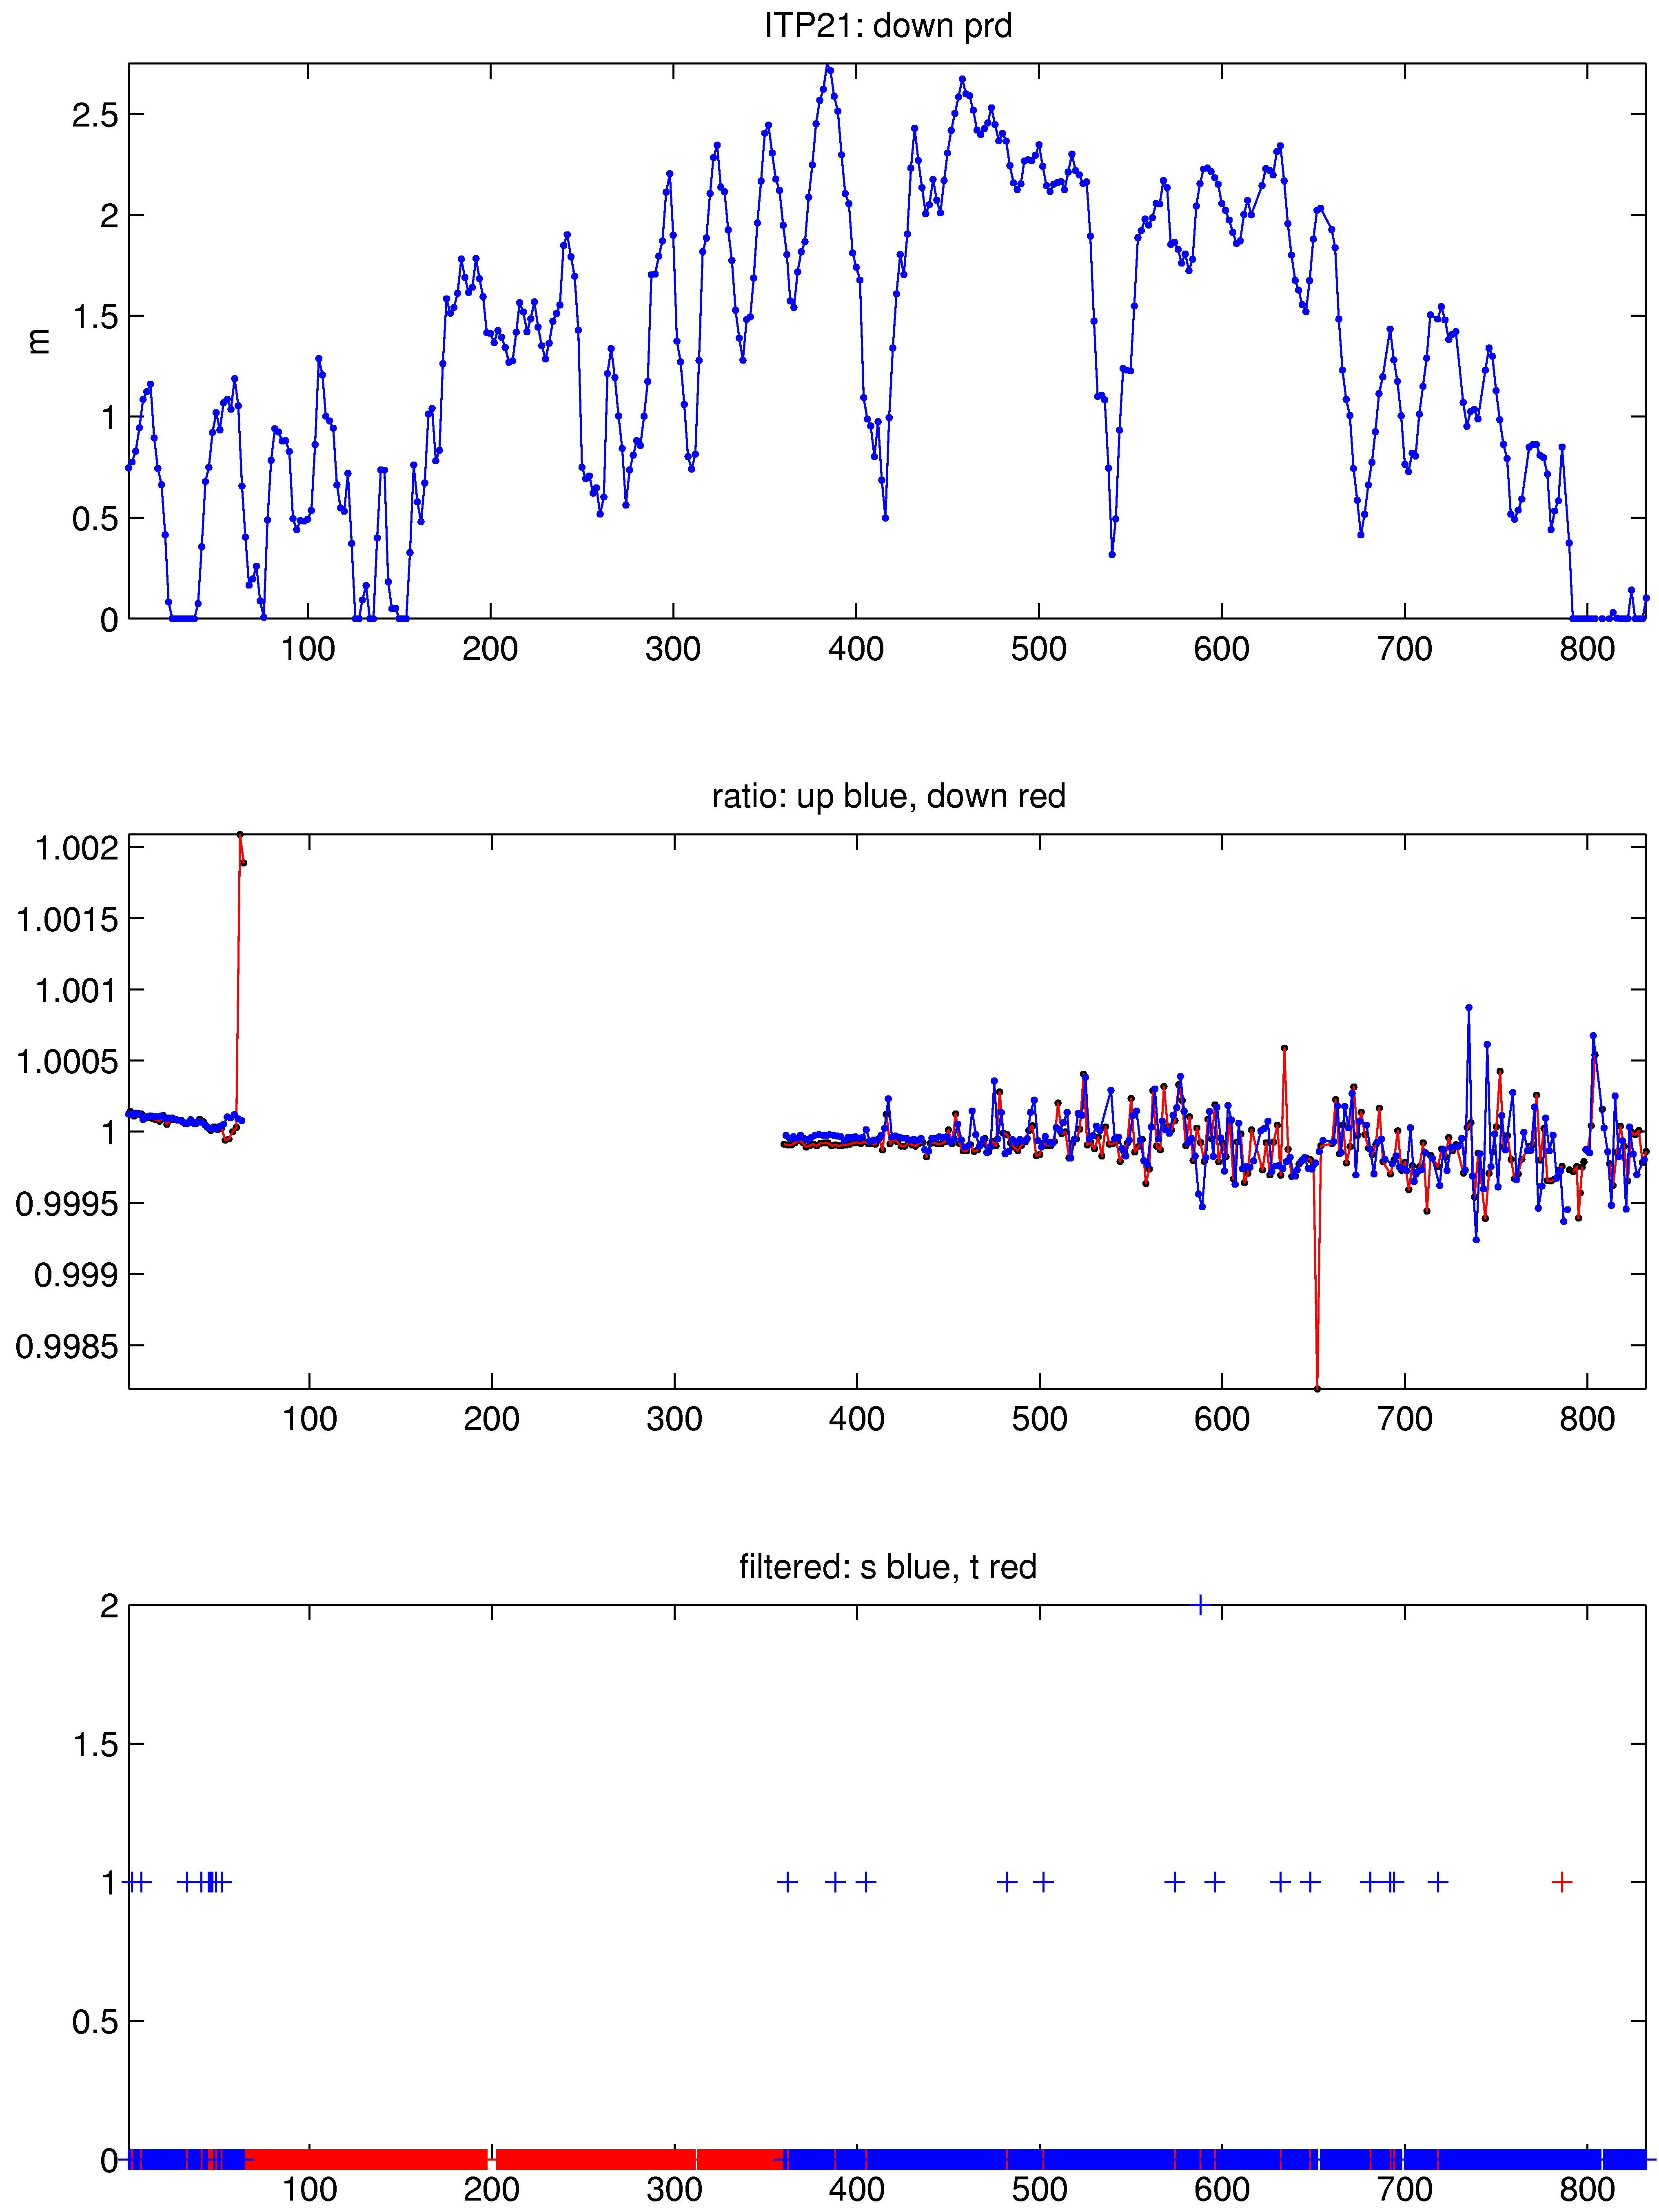
The 831 profiles that were recovered from the ITP were processed according to the procedures described in ITP Updated Data Processing Procedures. The processing parameters for ITP 21 are shown in the figures to the right. Profiles 65 to 359 had excessive sensor lags (10 to 50 s for conductivity) due to either icing or biofouling and even with correction the salinities still contained great error so were discarded. The temperature sensor was less influenced and its lags were less (~6 s), correctable, and those profiles preserved, but include greater uncertainties than the remainder of the time series. In general, ice motion was not too great, as to prevent profiling due to drag. However, shortly after the CTD cleared (around profile 400) the profiler spring must have broke, because thereafter the vertical range of the profiles became gradually less on average, and zeroed around profile 800. During this time, the instrument was effectively slipping on the wire, and as a consequence the number of points removed where the profiler reversed was large.
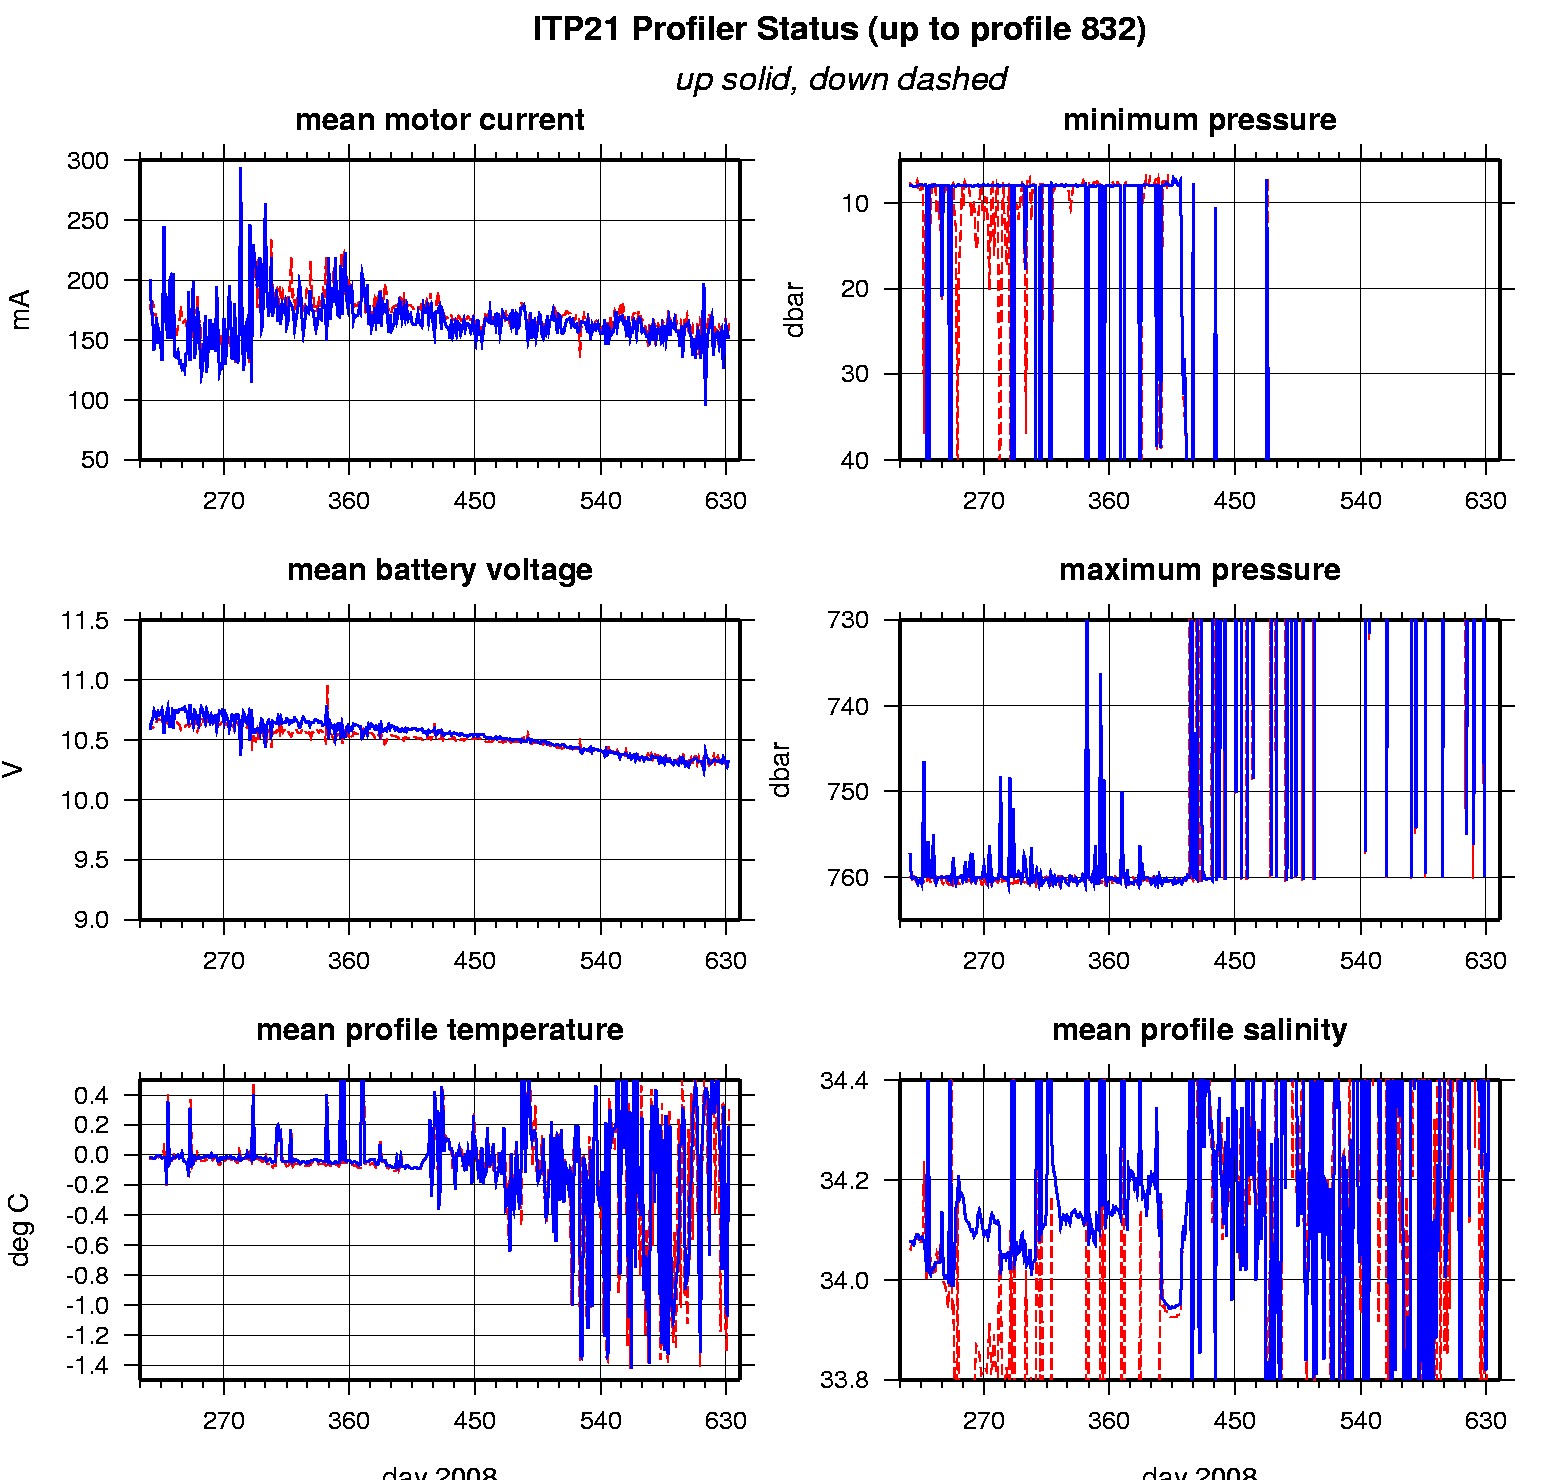
The sensors recovered very well after being fouled for 6 months. Except for the fouled period, the lags were typical and stable. In fact, recovery of the instrument allowed post calibrations to be performed on the CTD by the manufacturer. The temperature and conductivity sensors were within 0.001 of the pre-deployment calibrations. Also noteworthy, no profiler data files were missing in the record due to the reset software error which was corrected in the 2008 version of the profiler software.
See the Data Products tab to the left for descriptions of the three levels (I, II, III) of data processing and to access all data.
