Skip to content

ITP59 Data Processing

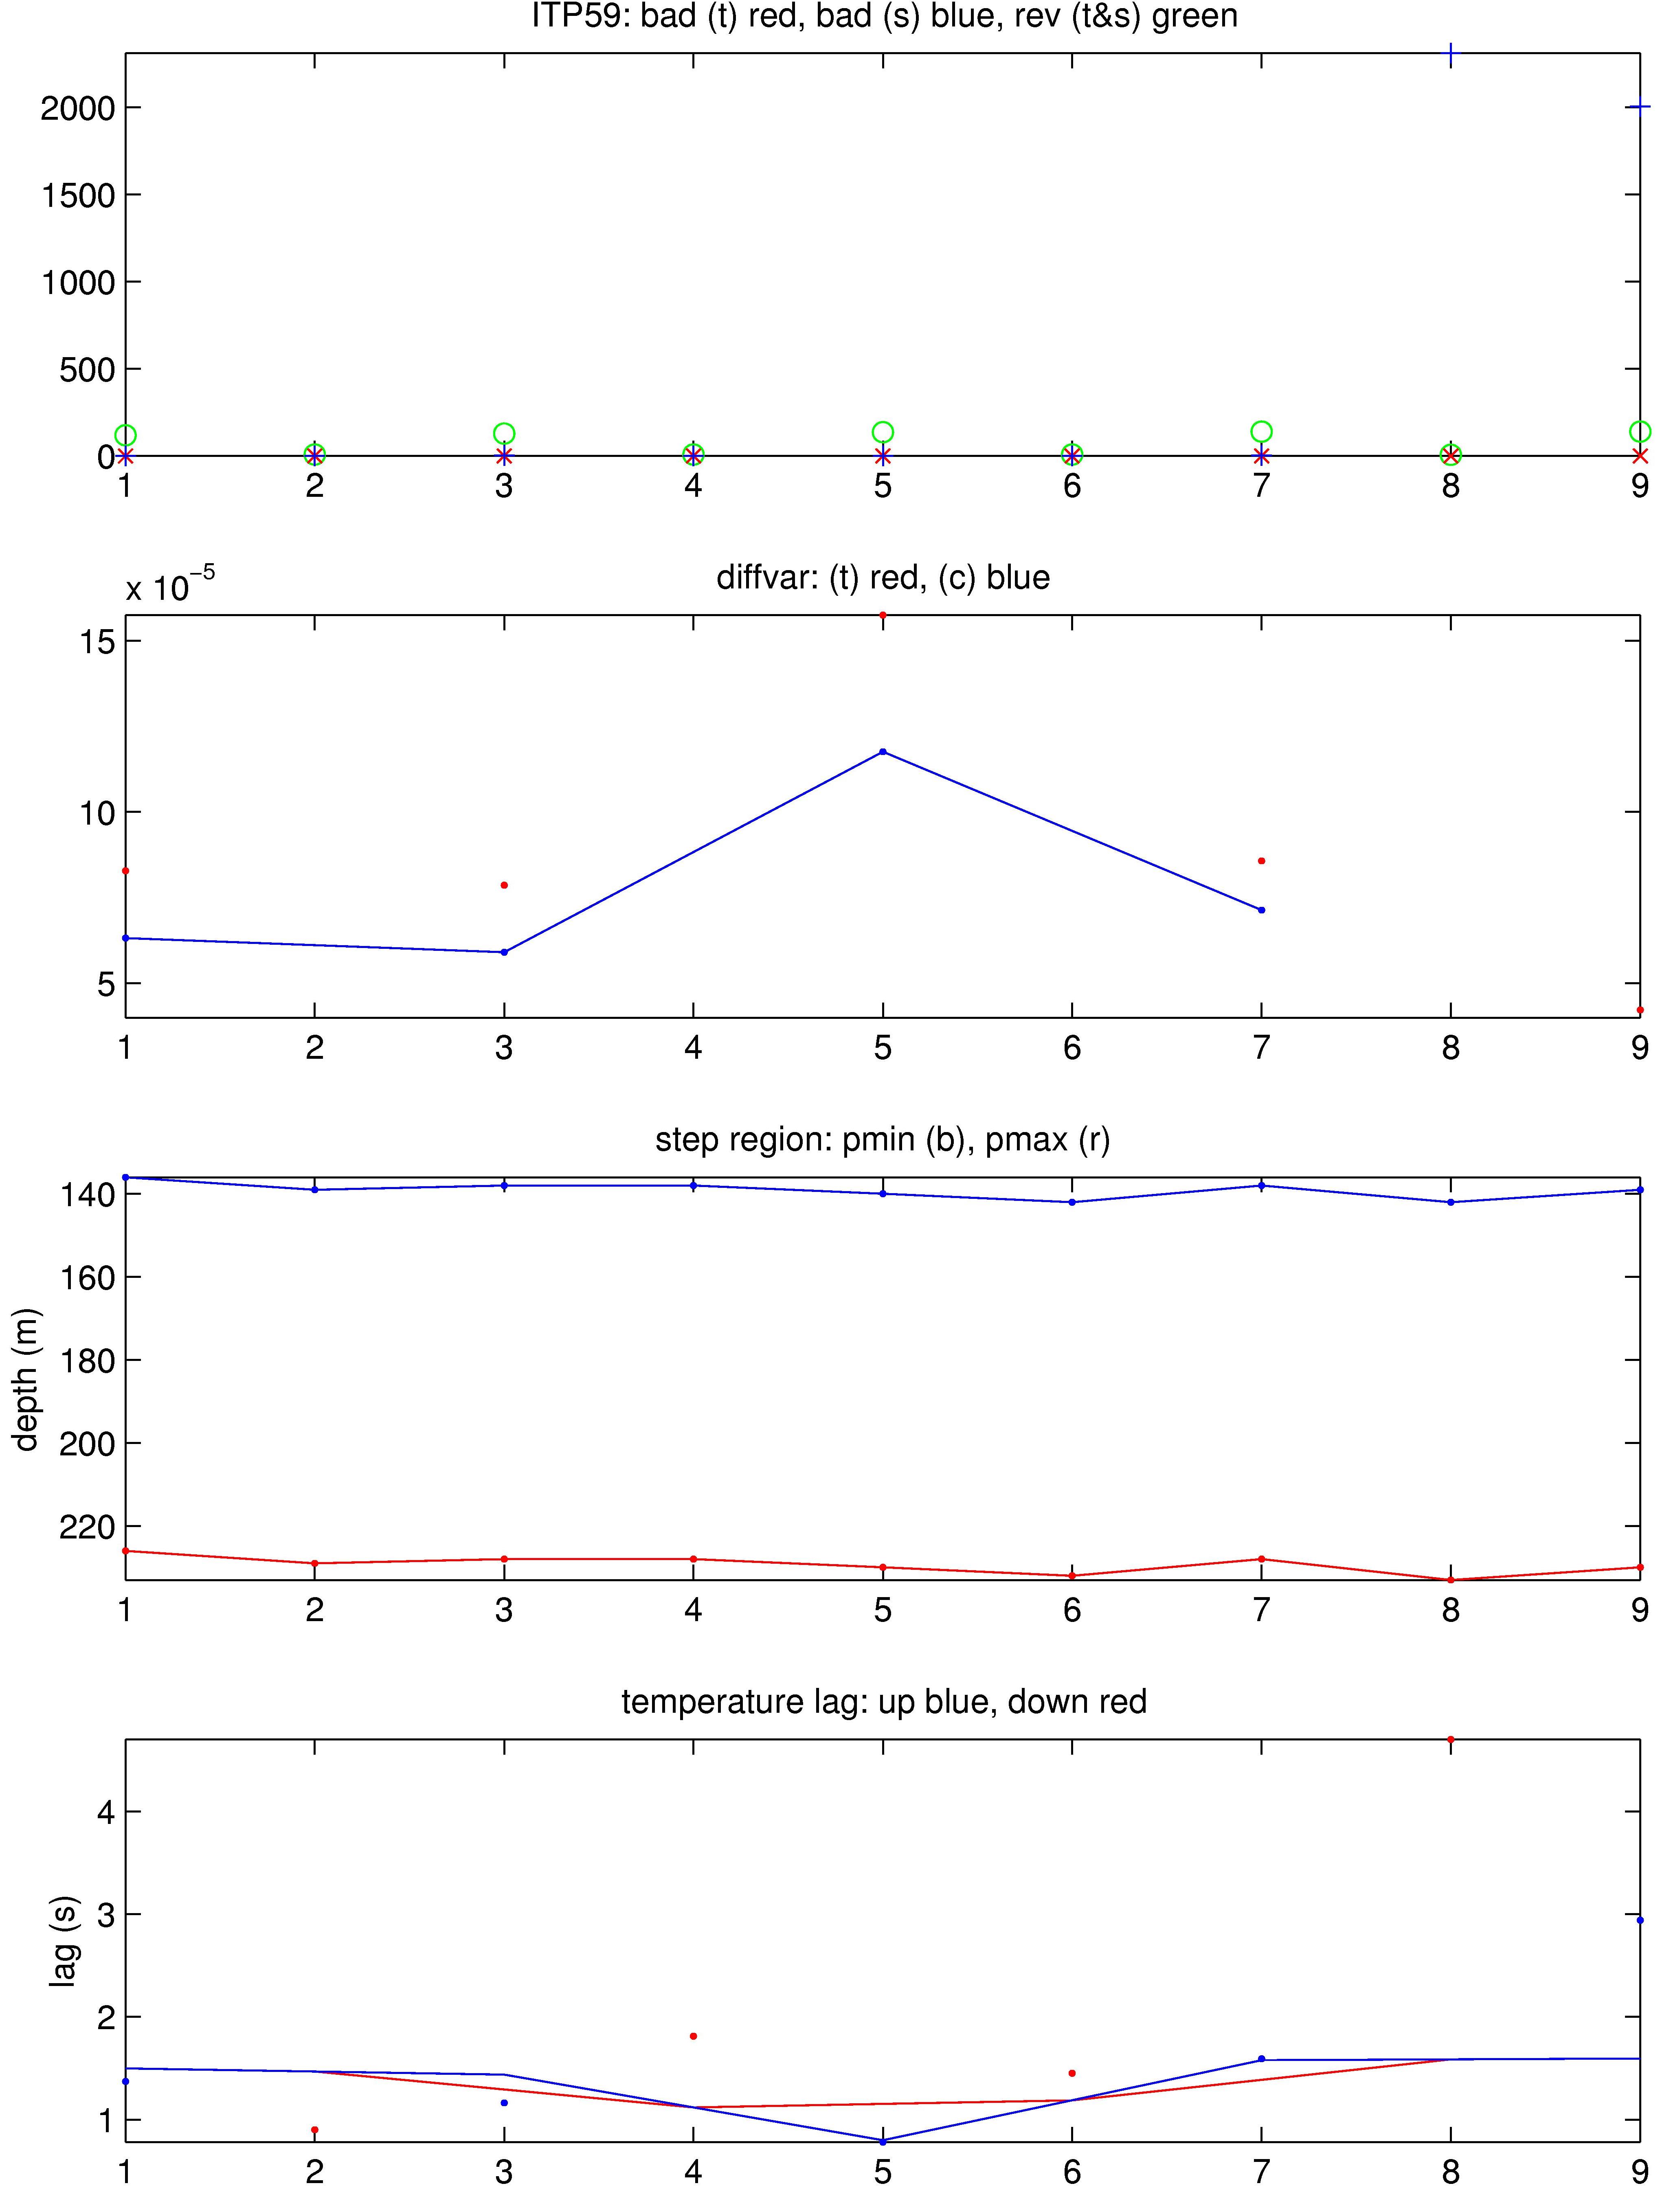
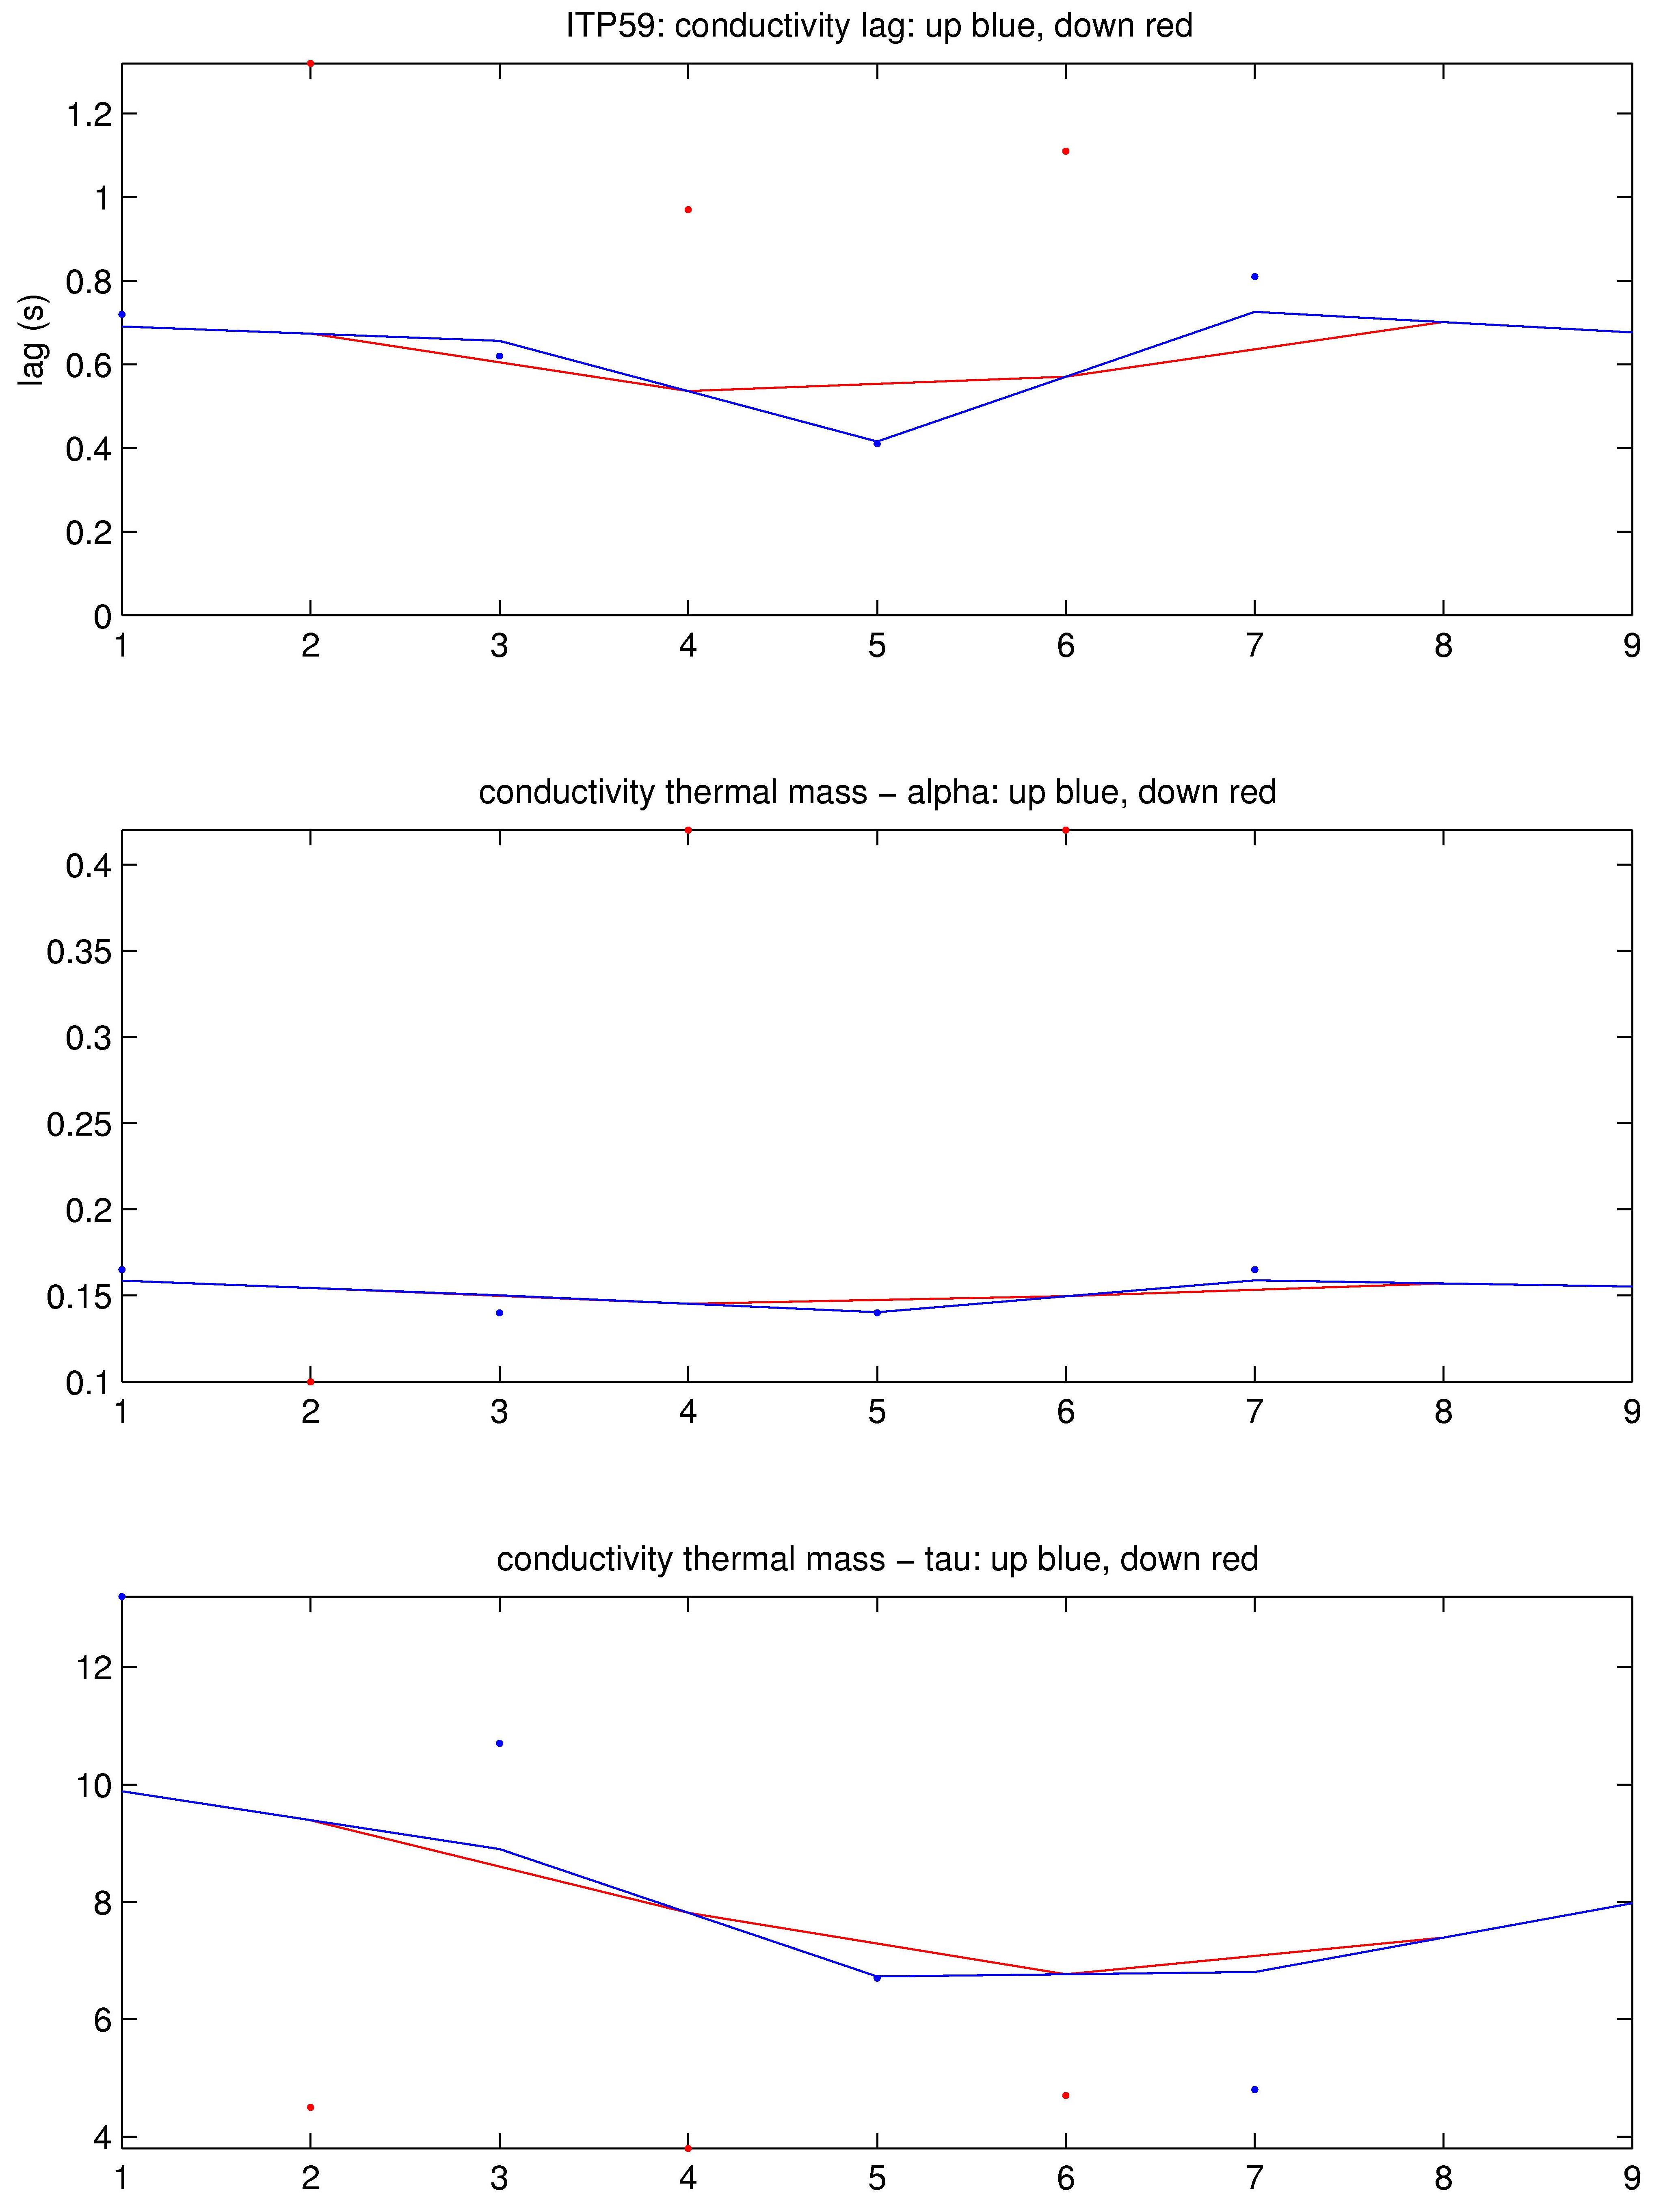
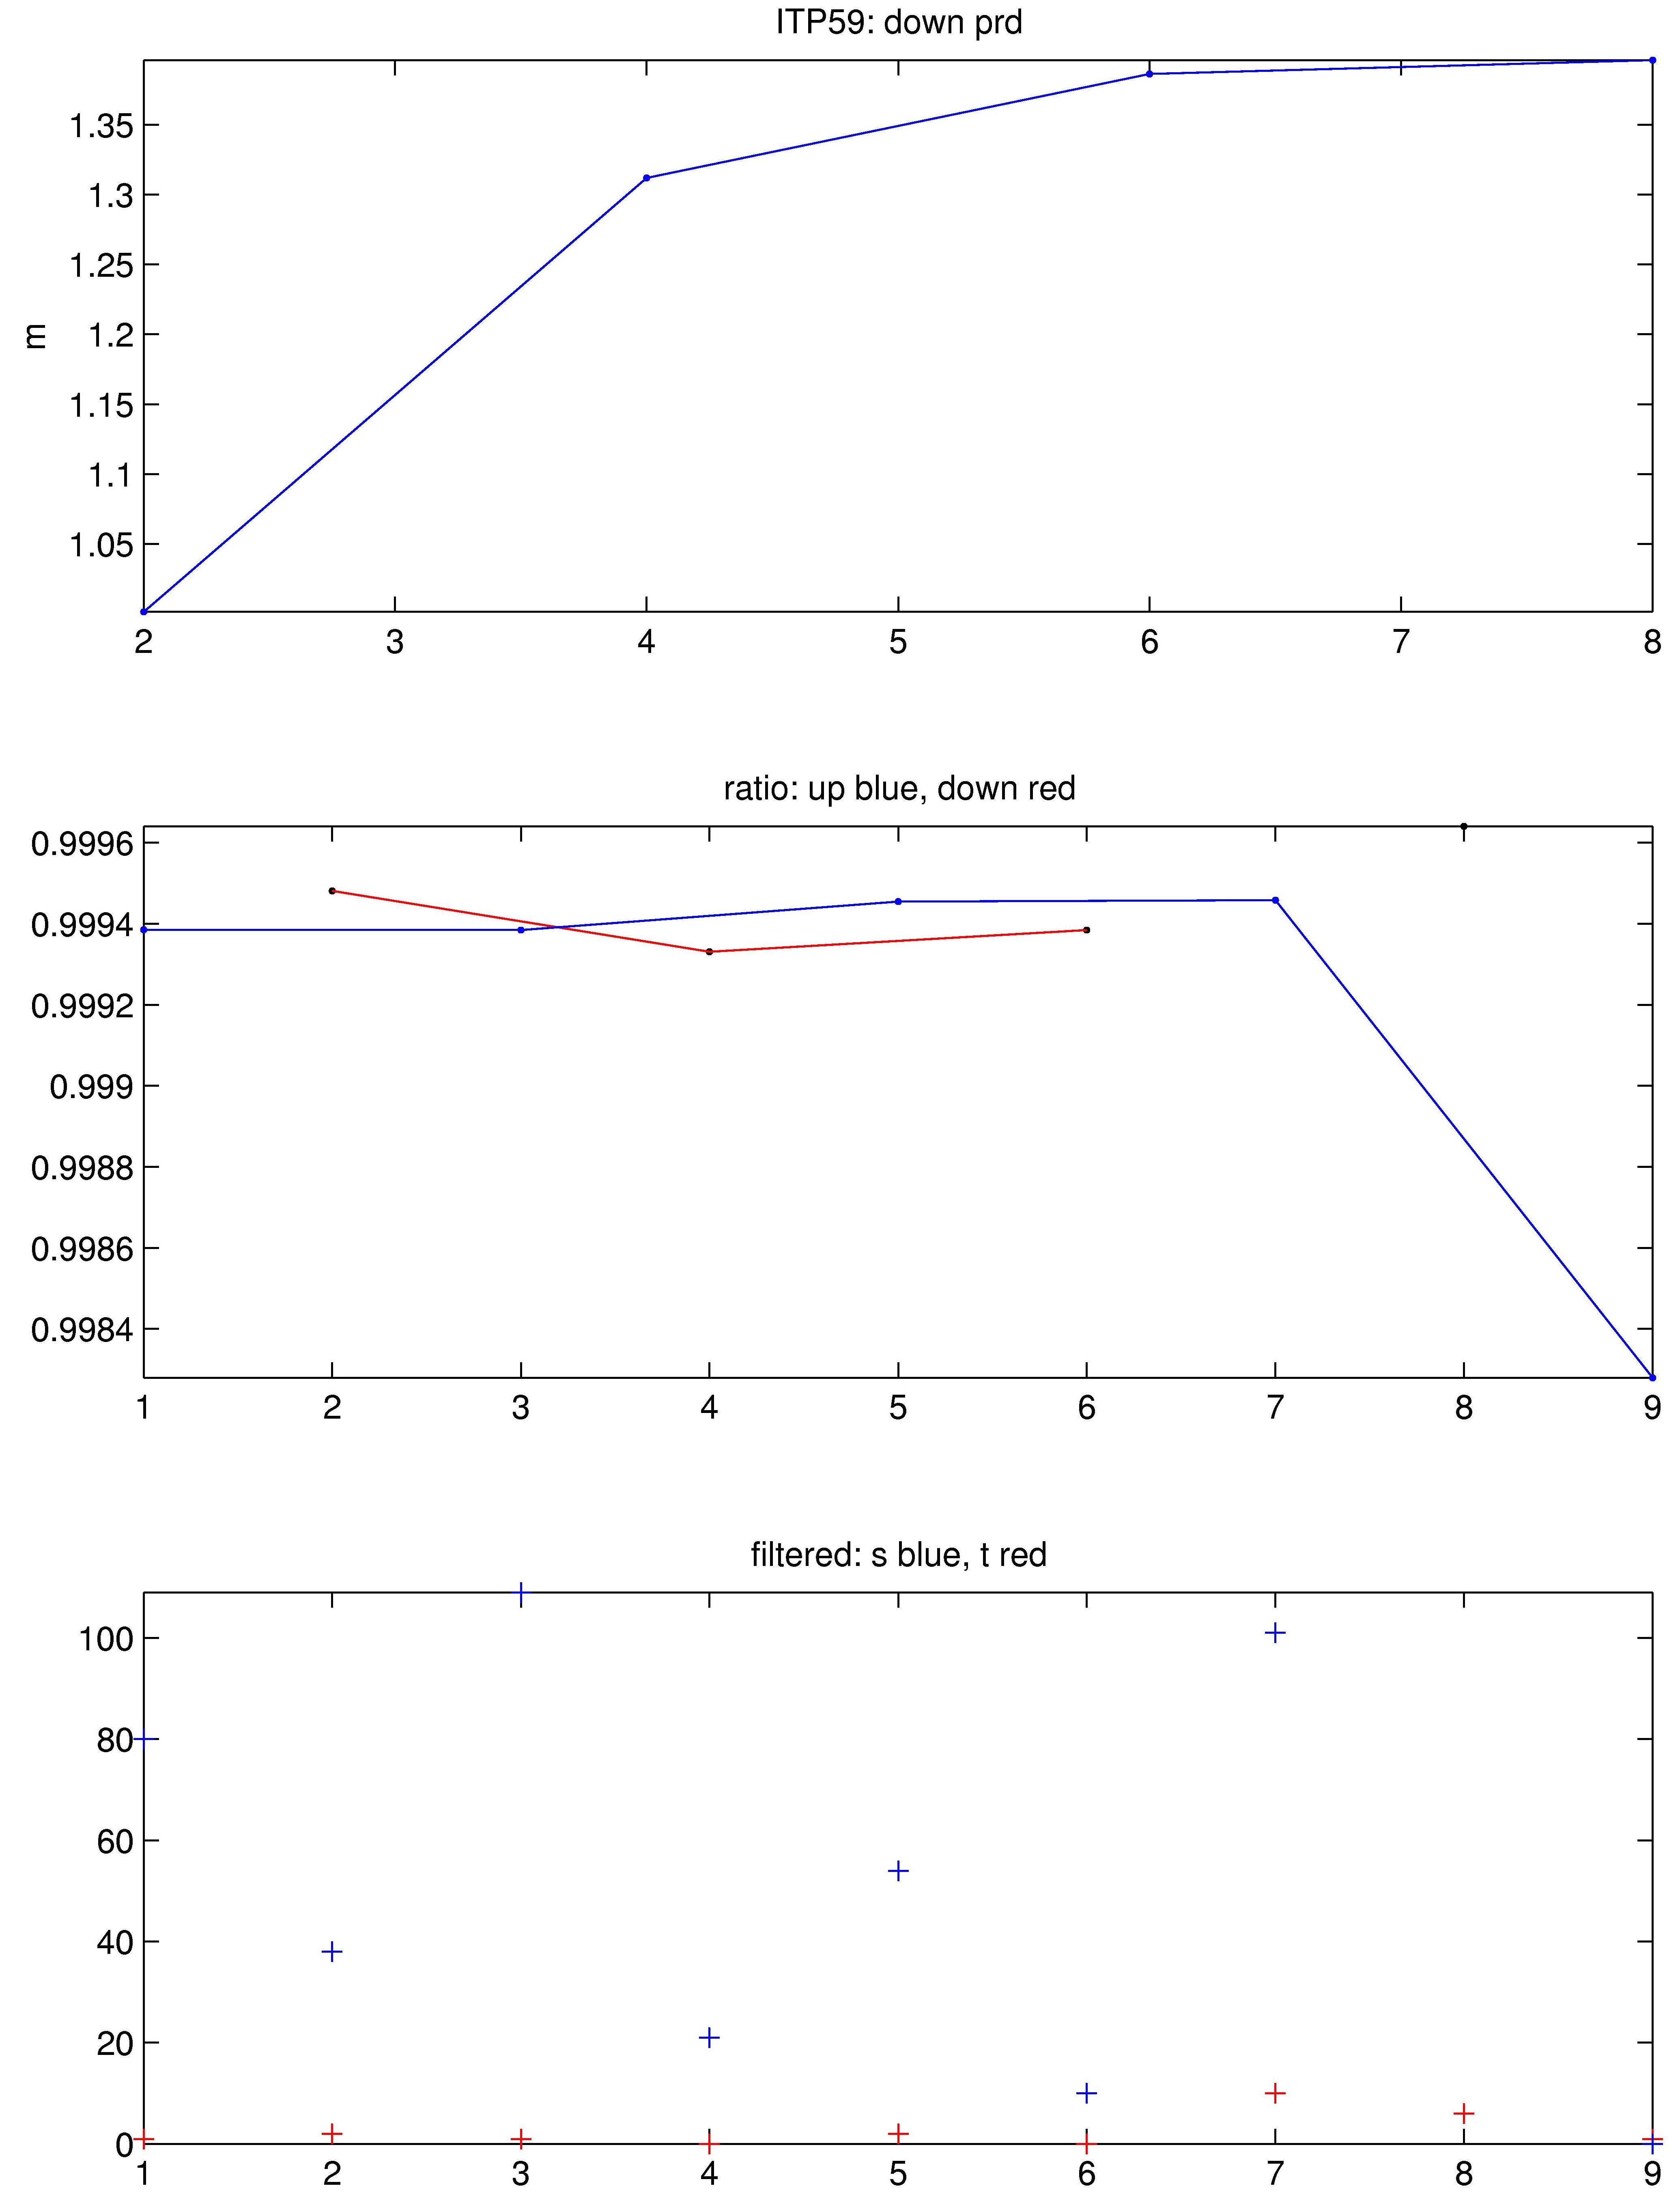
The 9 profiles that were transmitted from the ITP were processed according to the procedures described in the ITP Updated Data Processing Procedures.  The processing parameters for this ITP are shown in the figures to the right.

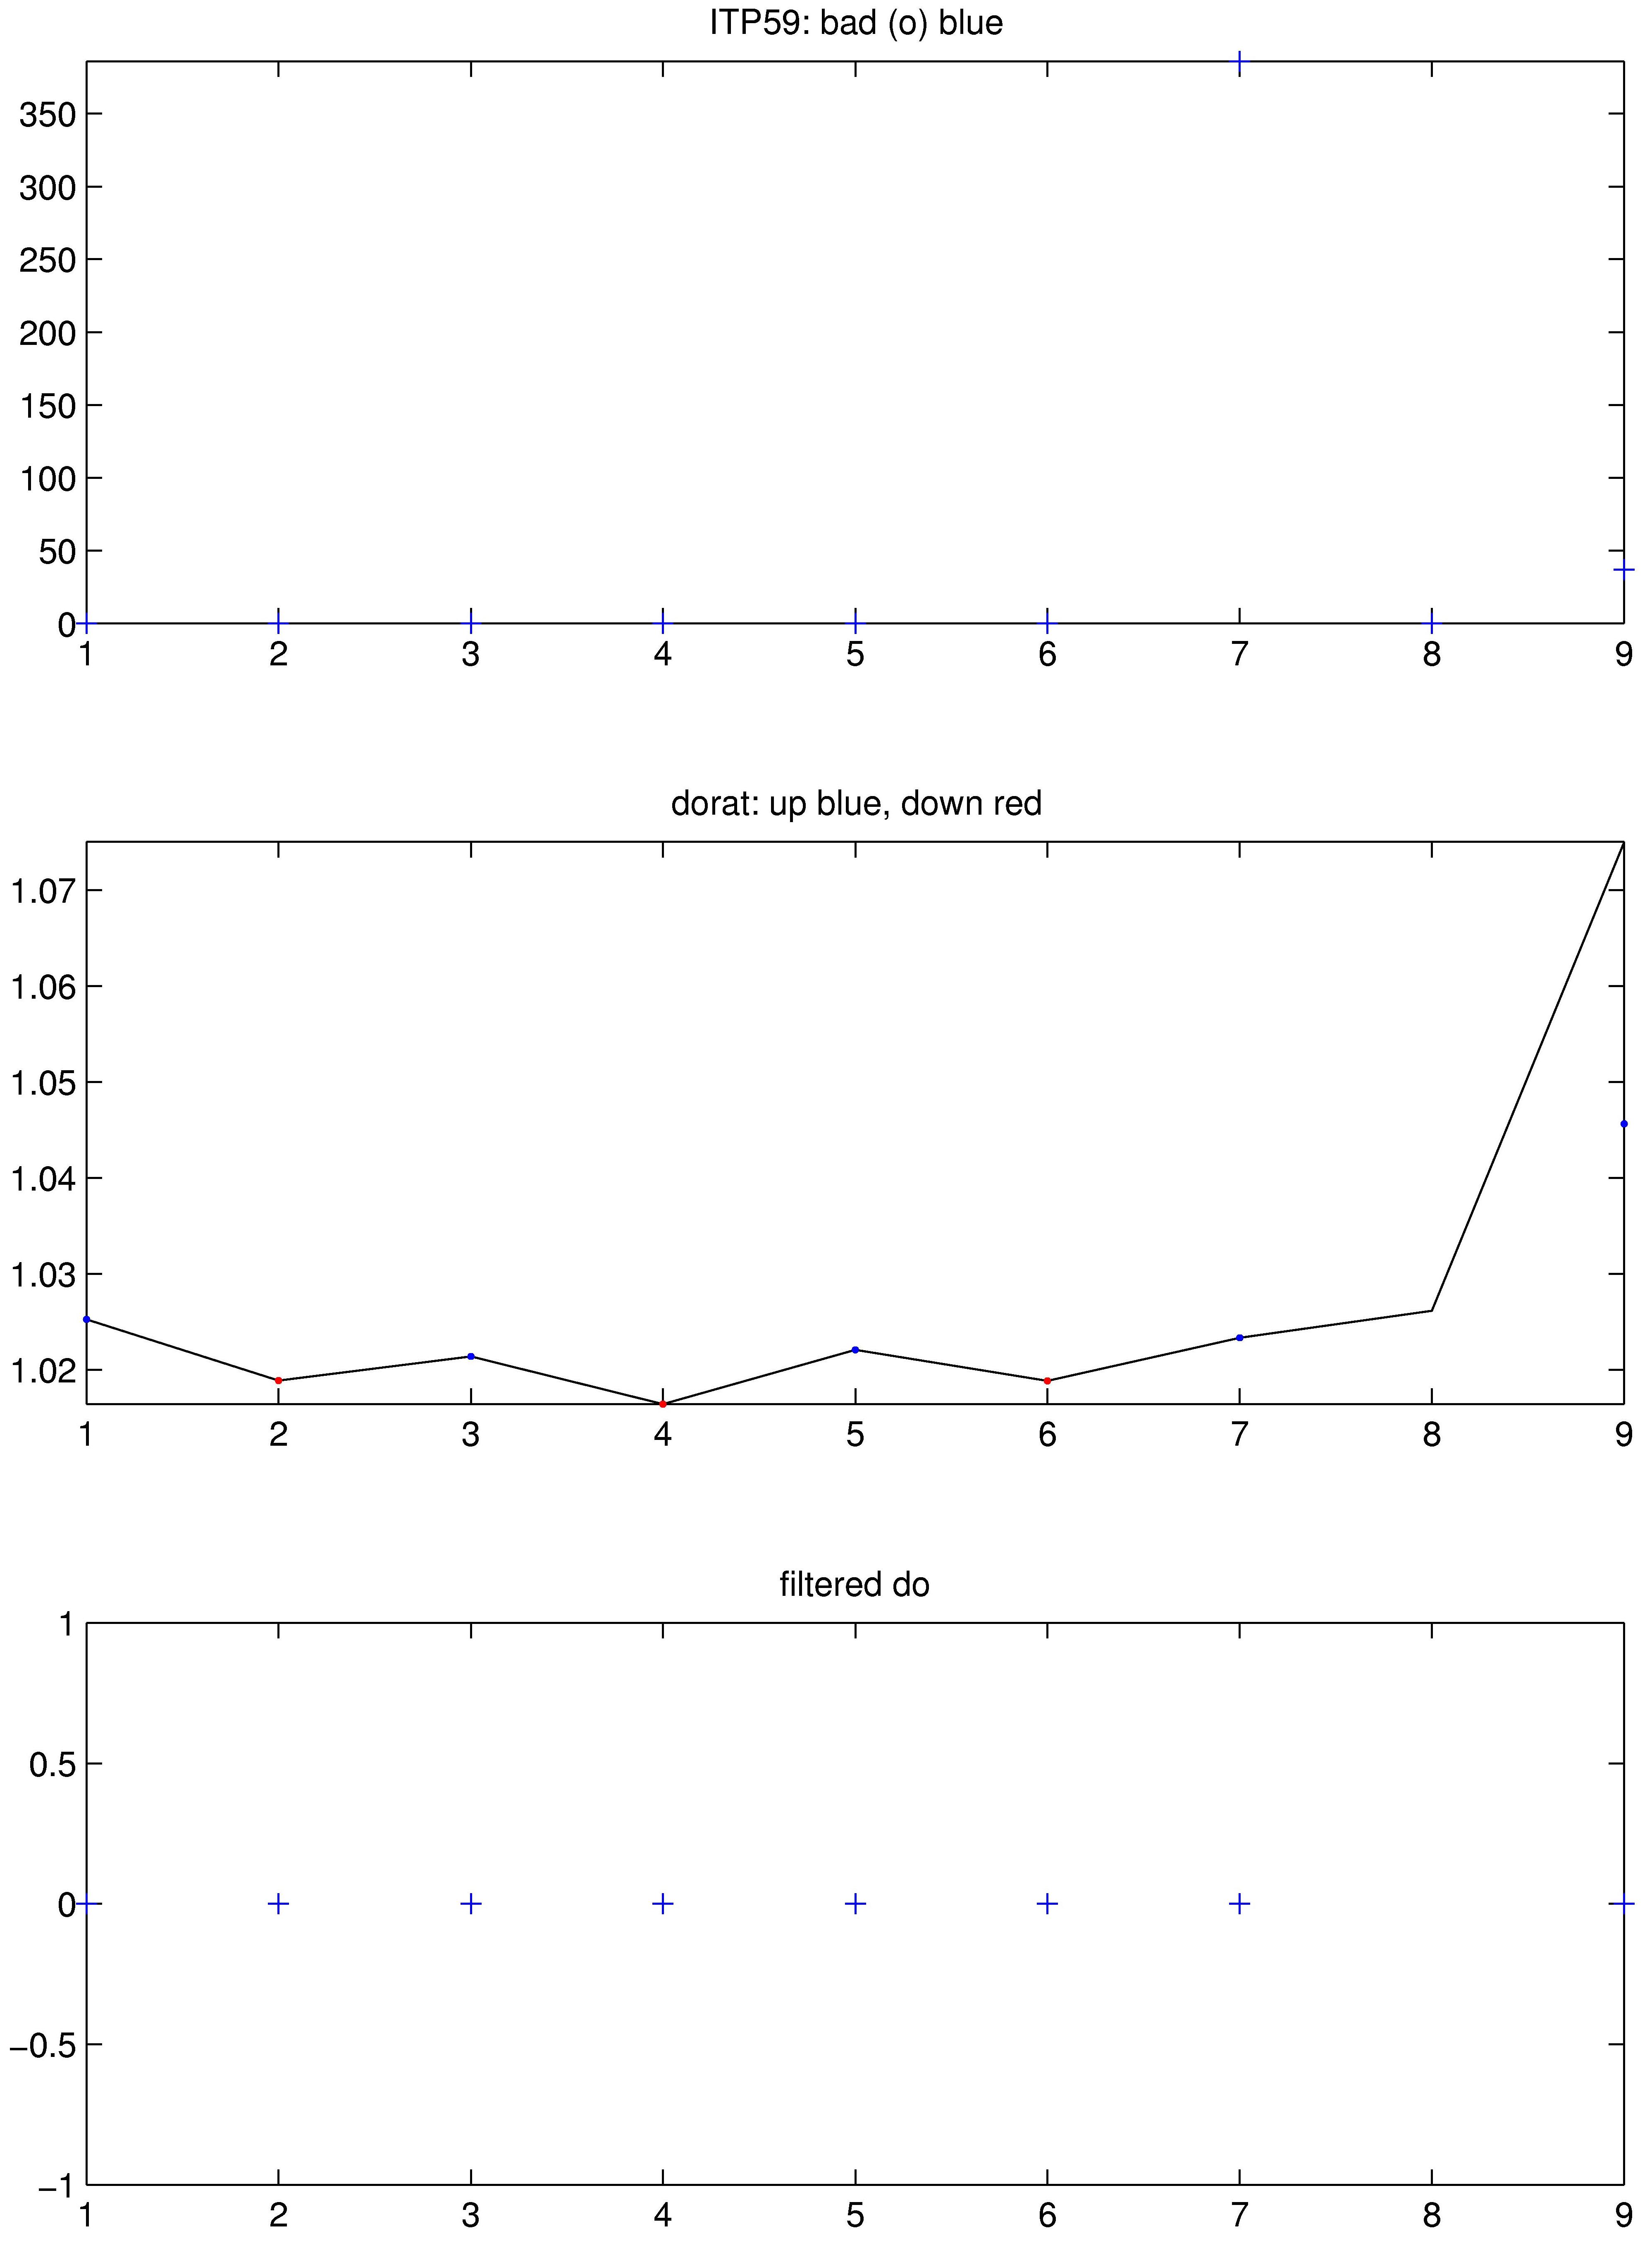
CTD lag corrections determined from the profile data were somewhat larger than typical, and did not vary too greatly over the short time period.  Bad salinity and dissolved oxygen data was removed from the last 3 profiles.

See the Data Products tab to the left for descriptions of the three levels (I, II, III) of data processing and to access all data.
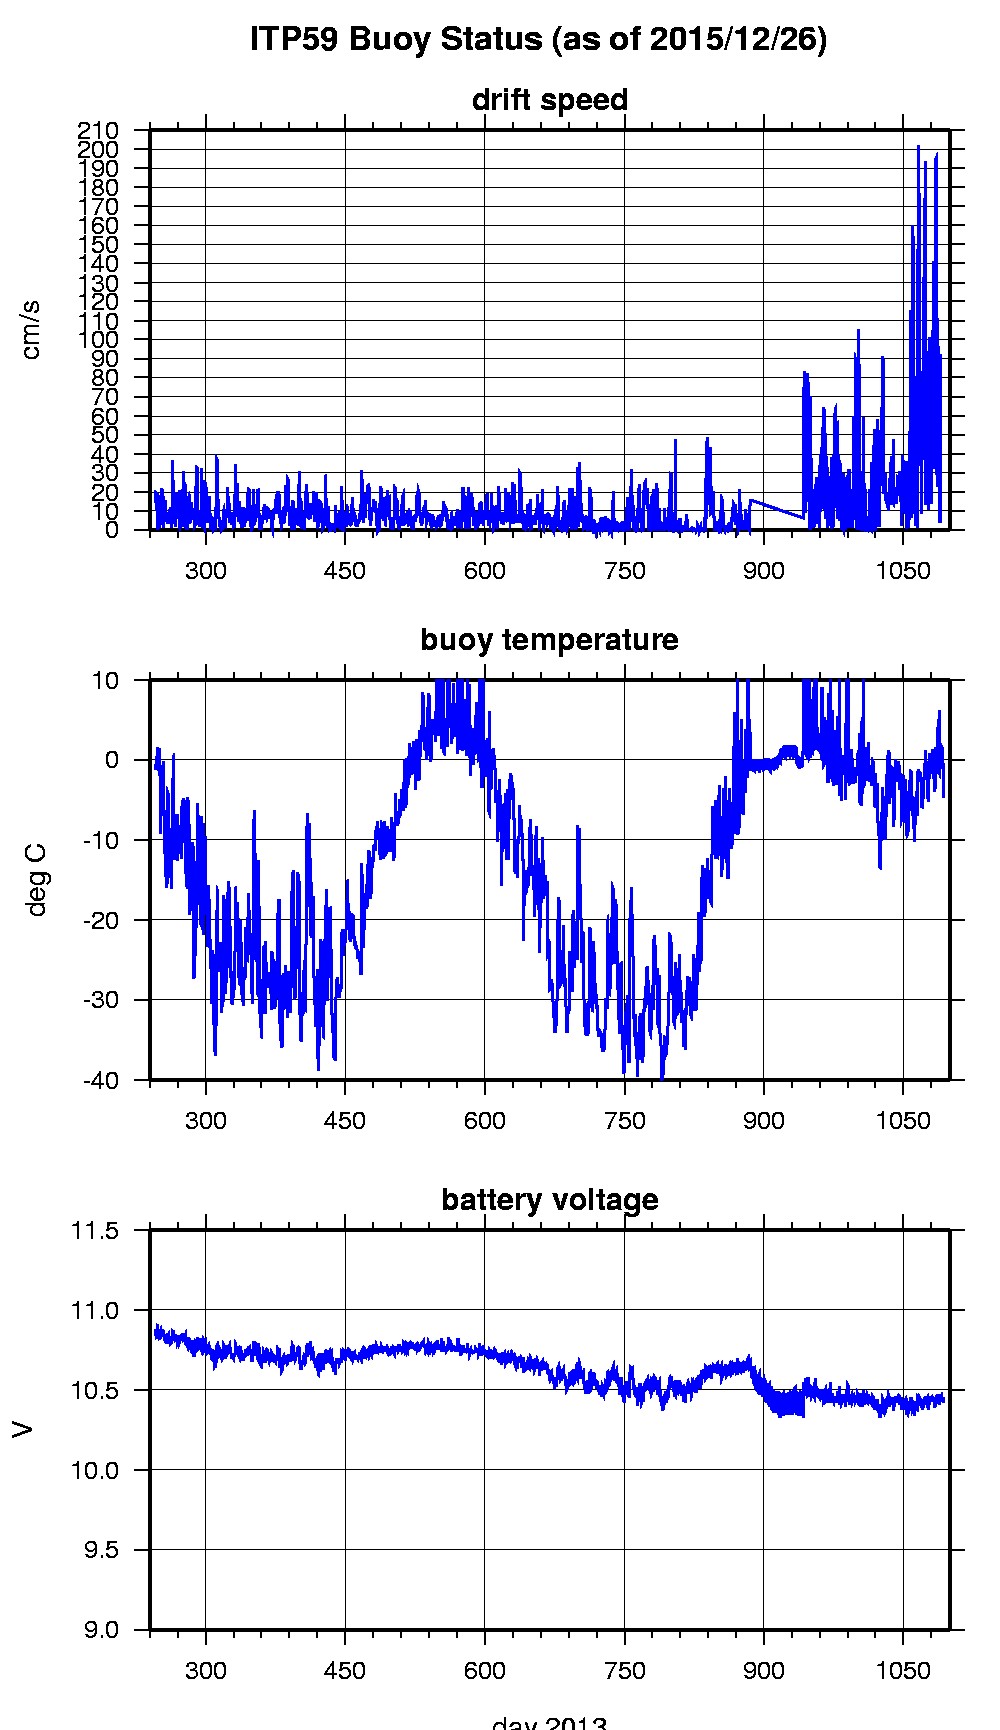
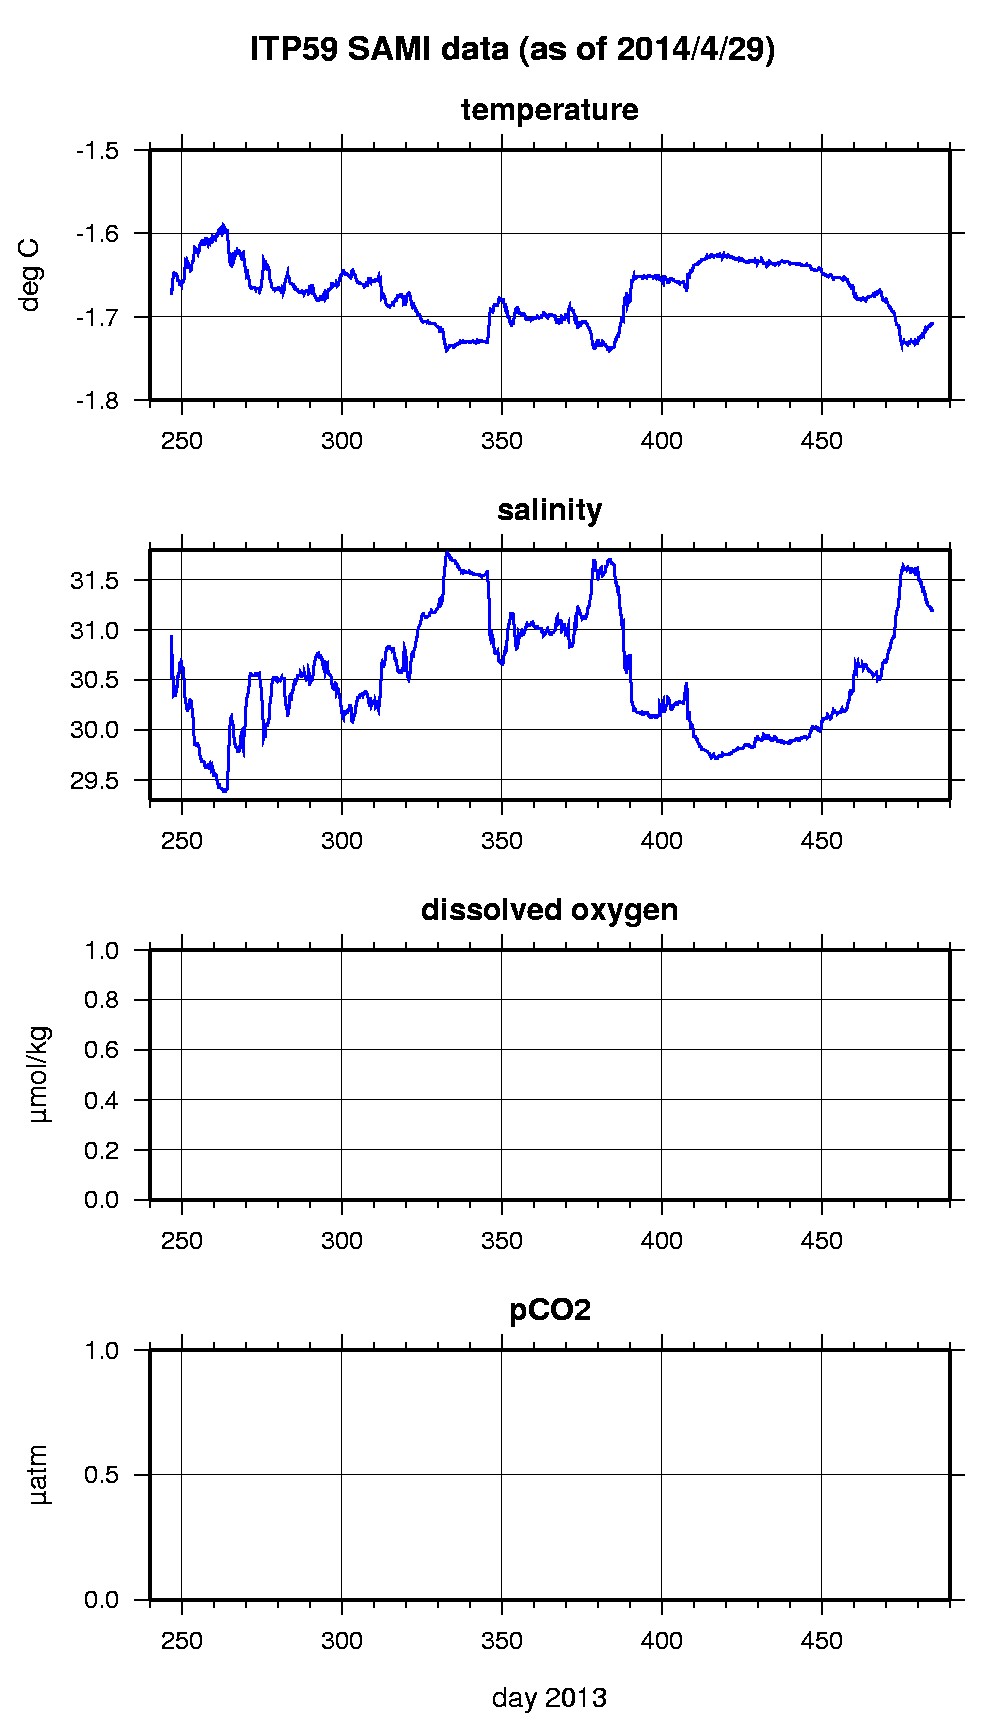
ITP Surface Buoy Status.
ITP profiler engineering data.
Top: number of bad points removed, Middle: variance of verticle difference of temperature and salinity in step region for up-going profiles, Bottom: temperature lag.
Top: conductivity lag, Middle: conductivity thermal mass amplitude correction, Bottom: conductivity thermal mass lag correction.
Top: down pressure deviation correction, Middle: salinity ratio adjustment, Bottom: Number of filtered spikes.
Top: number of bad dissolved oxygen points removed, Middle: dissolved oxygen ratio adjustment, Bottom: number of filtered spikes.
Scroll To Top