ITP25 Data Processing
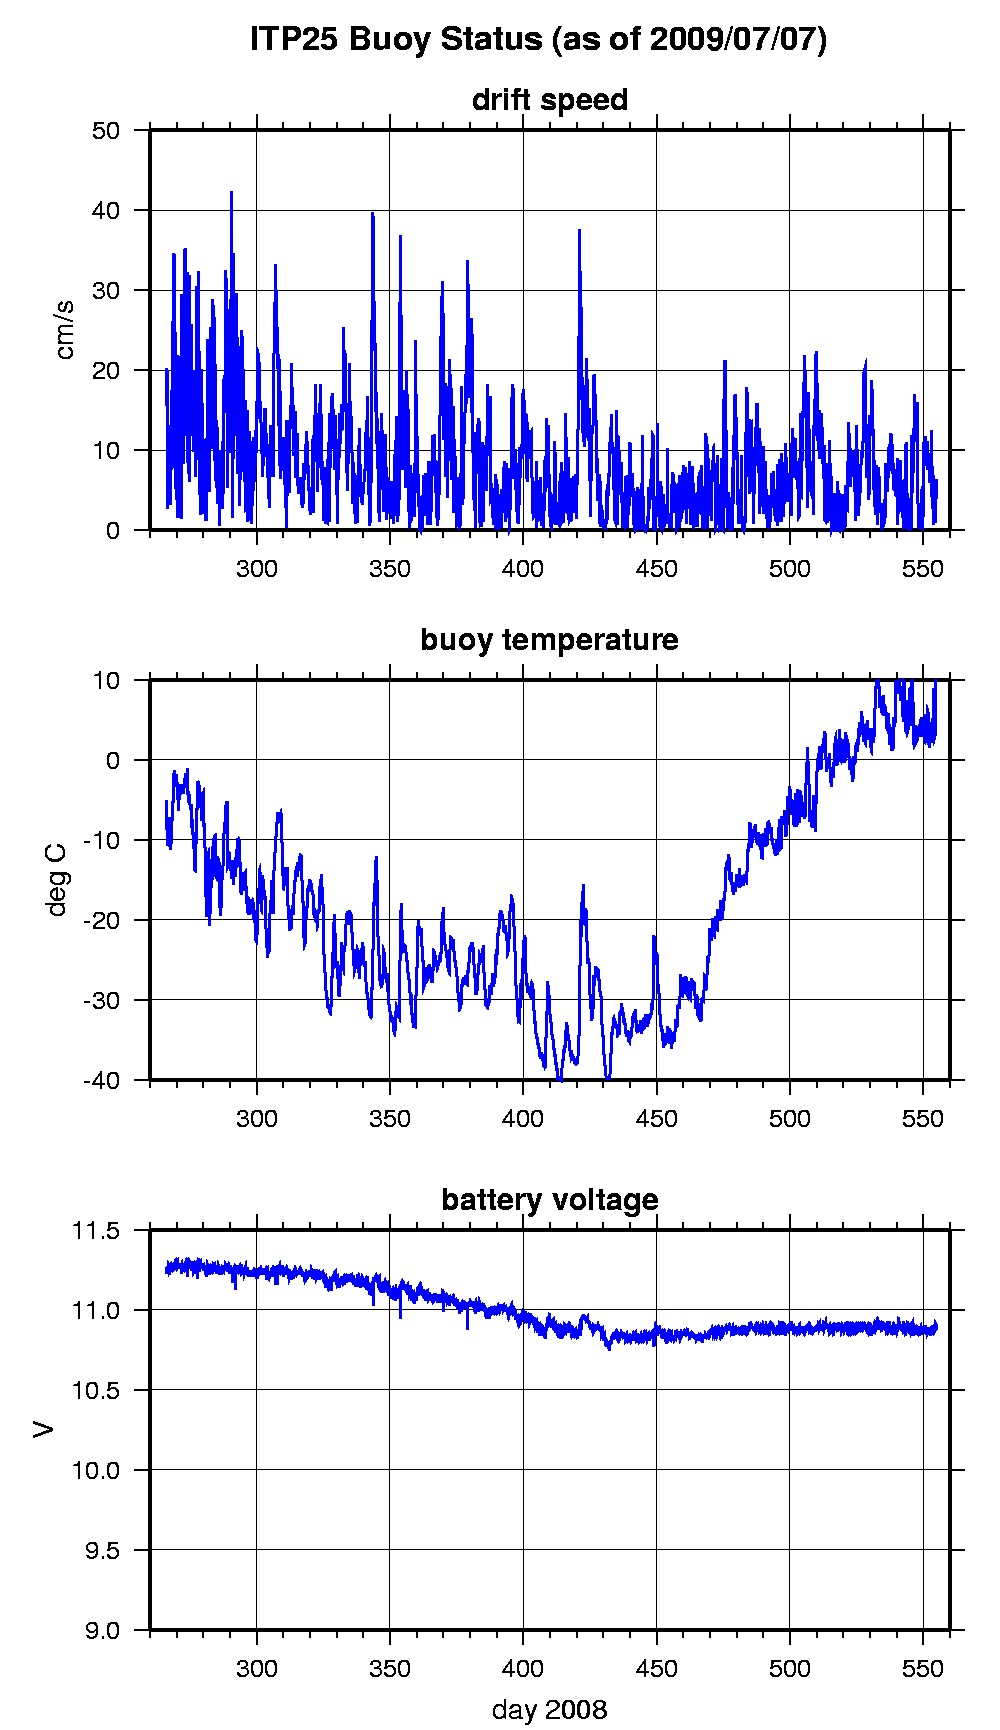
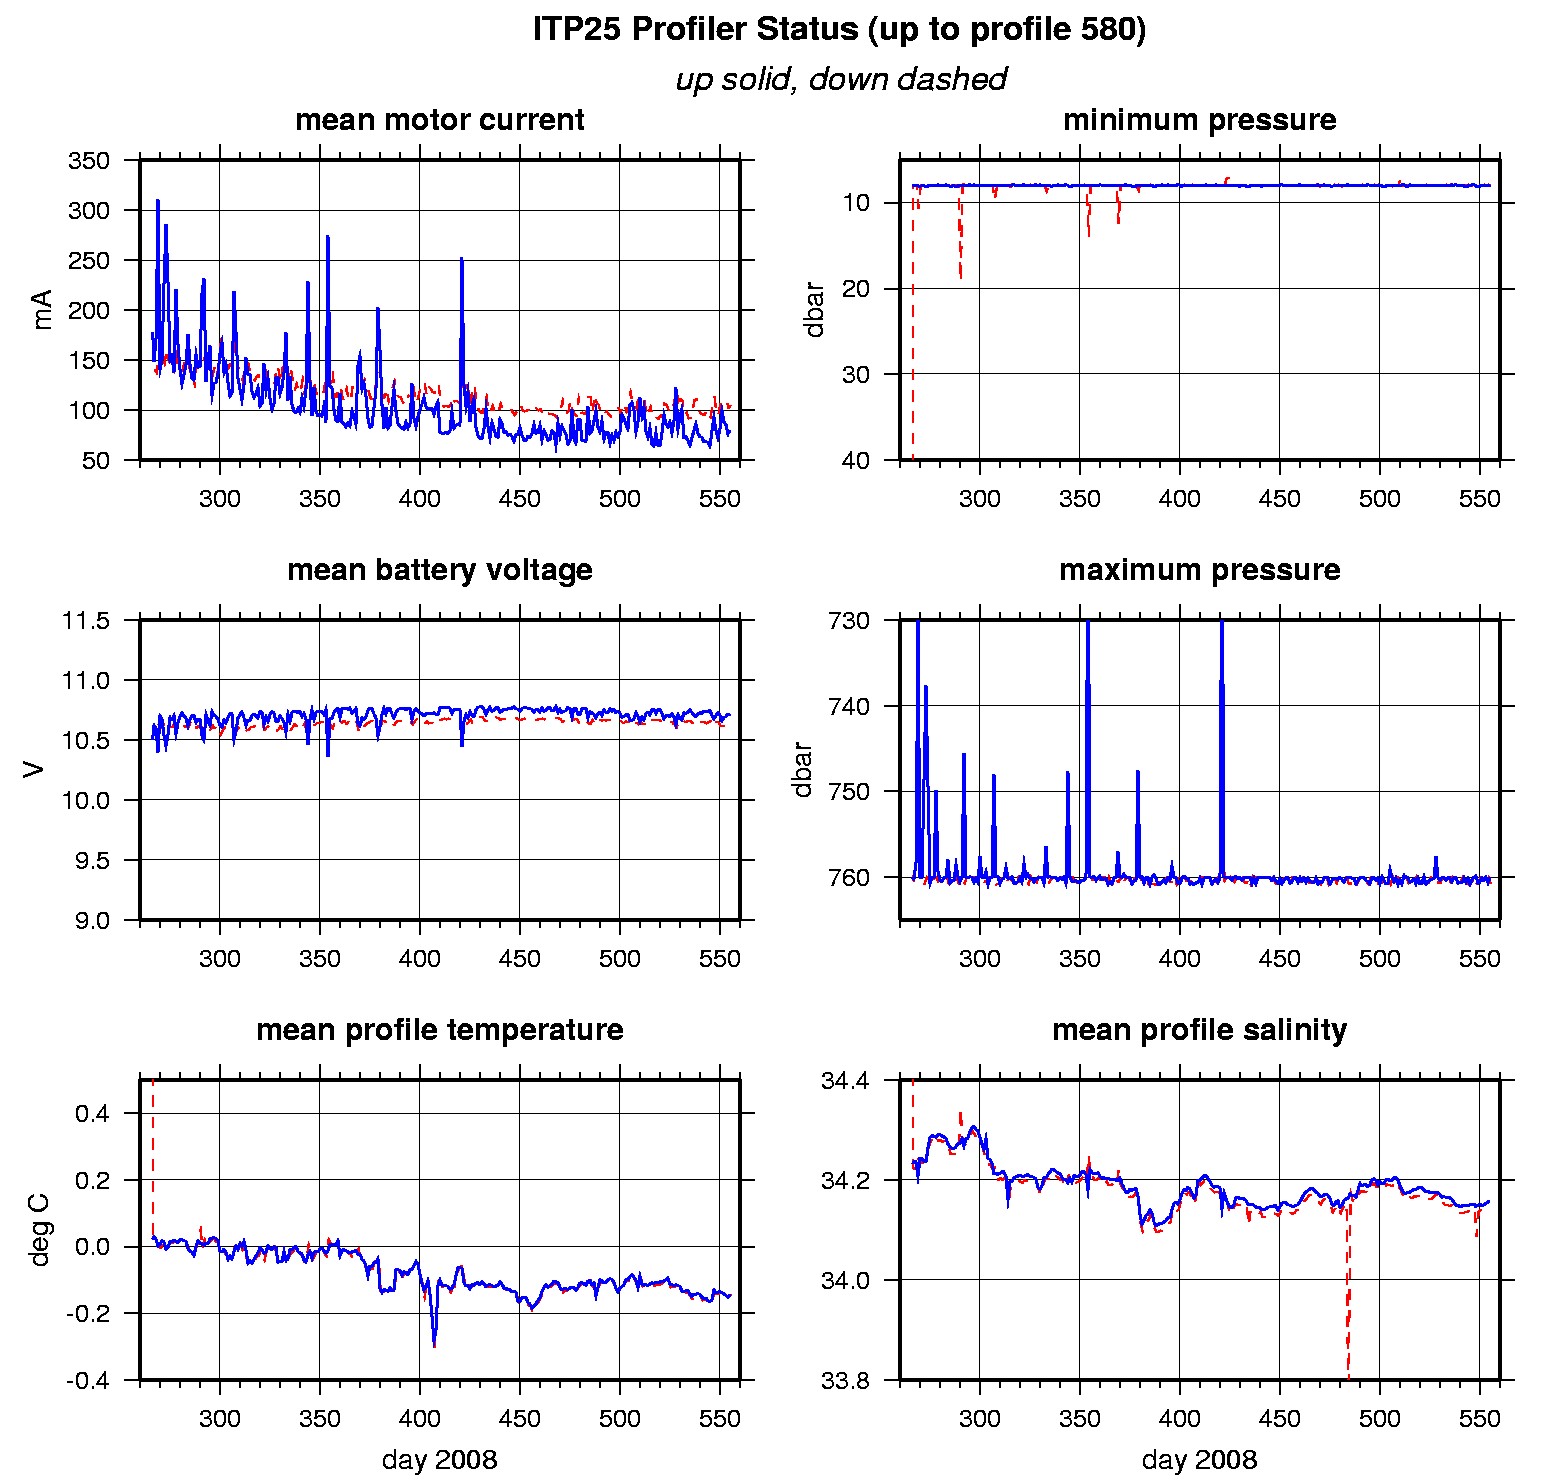
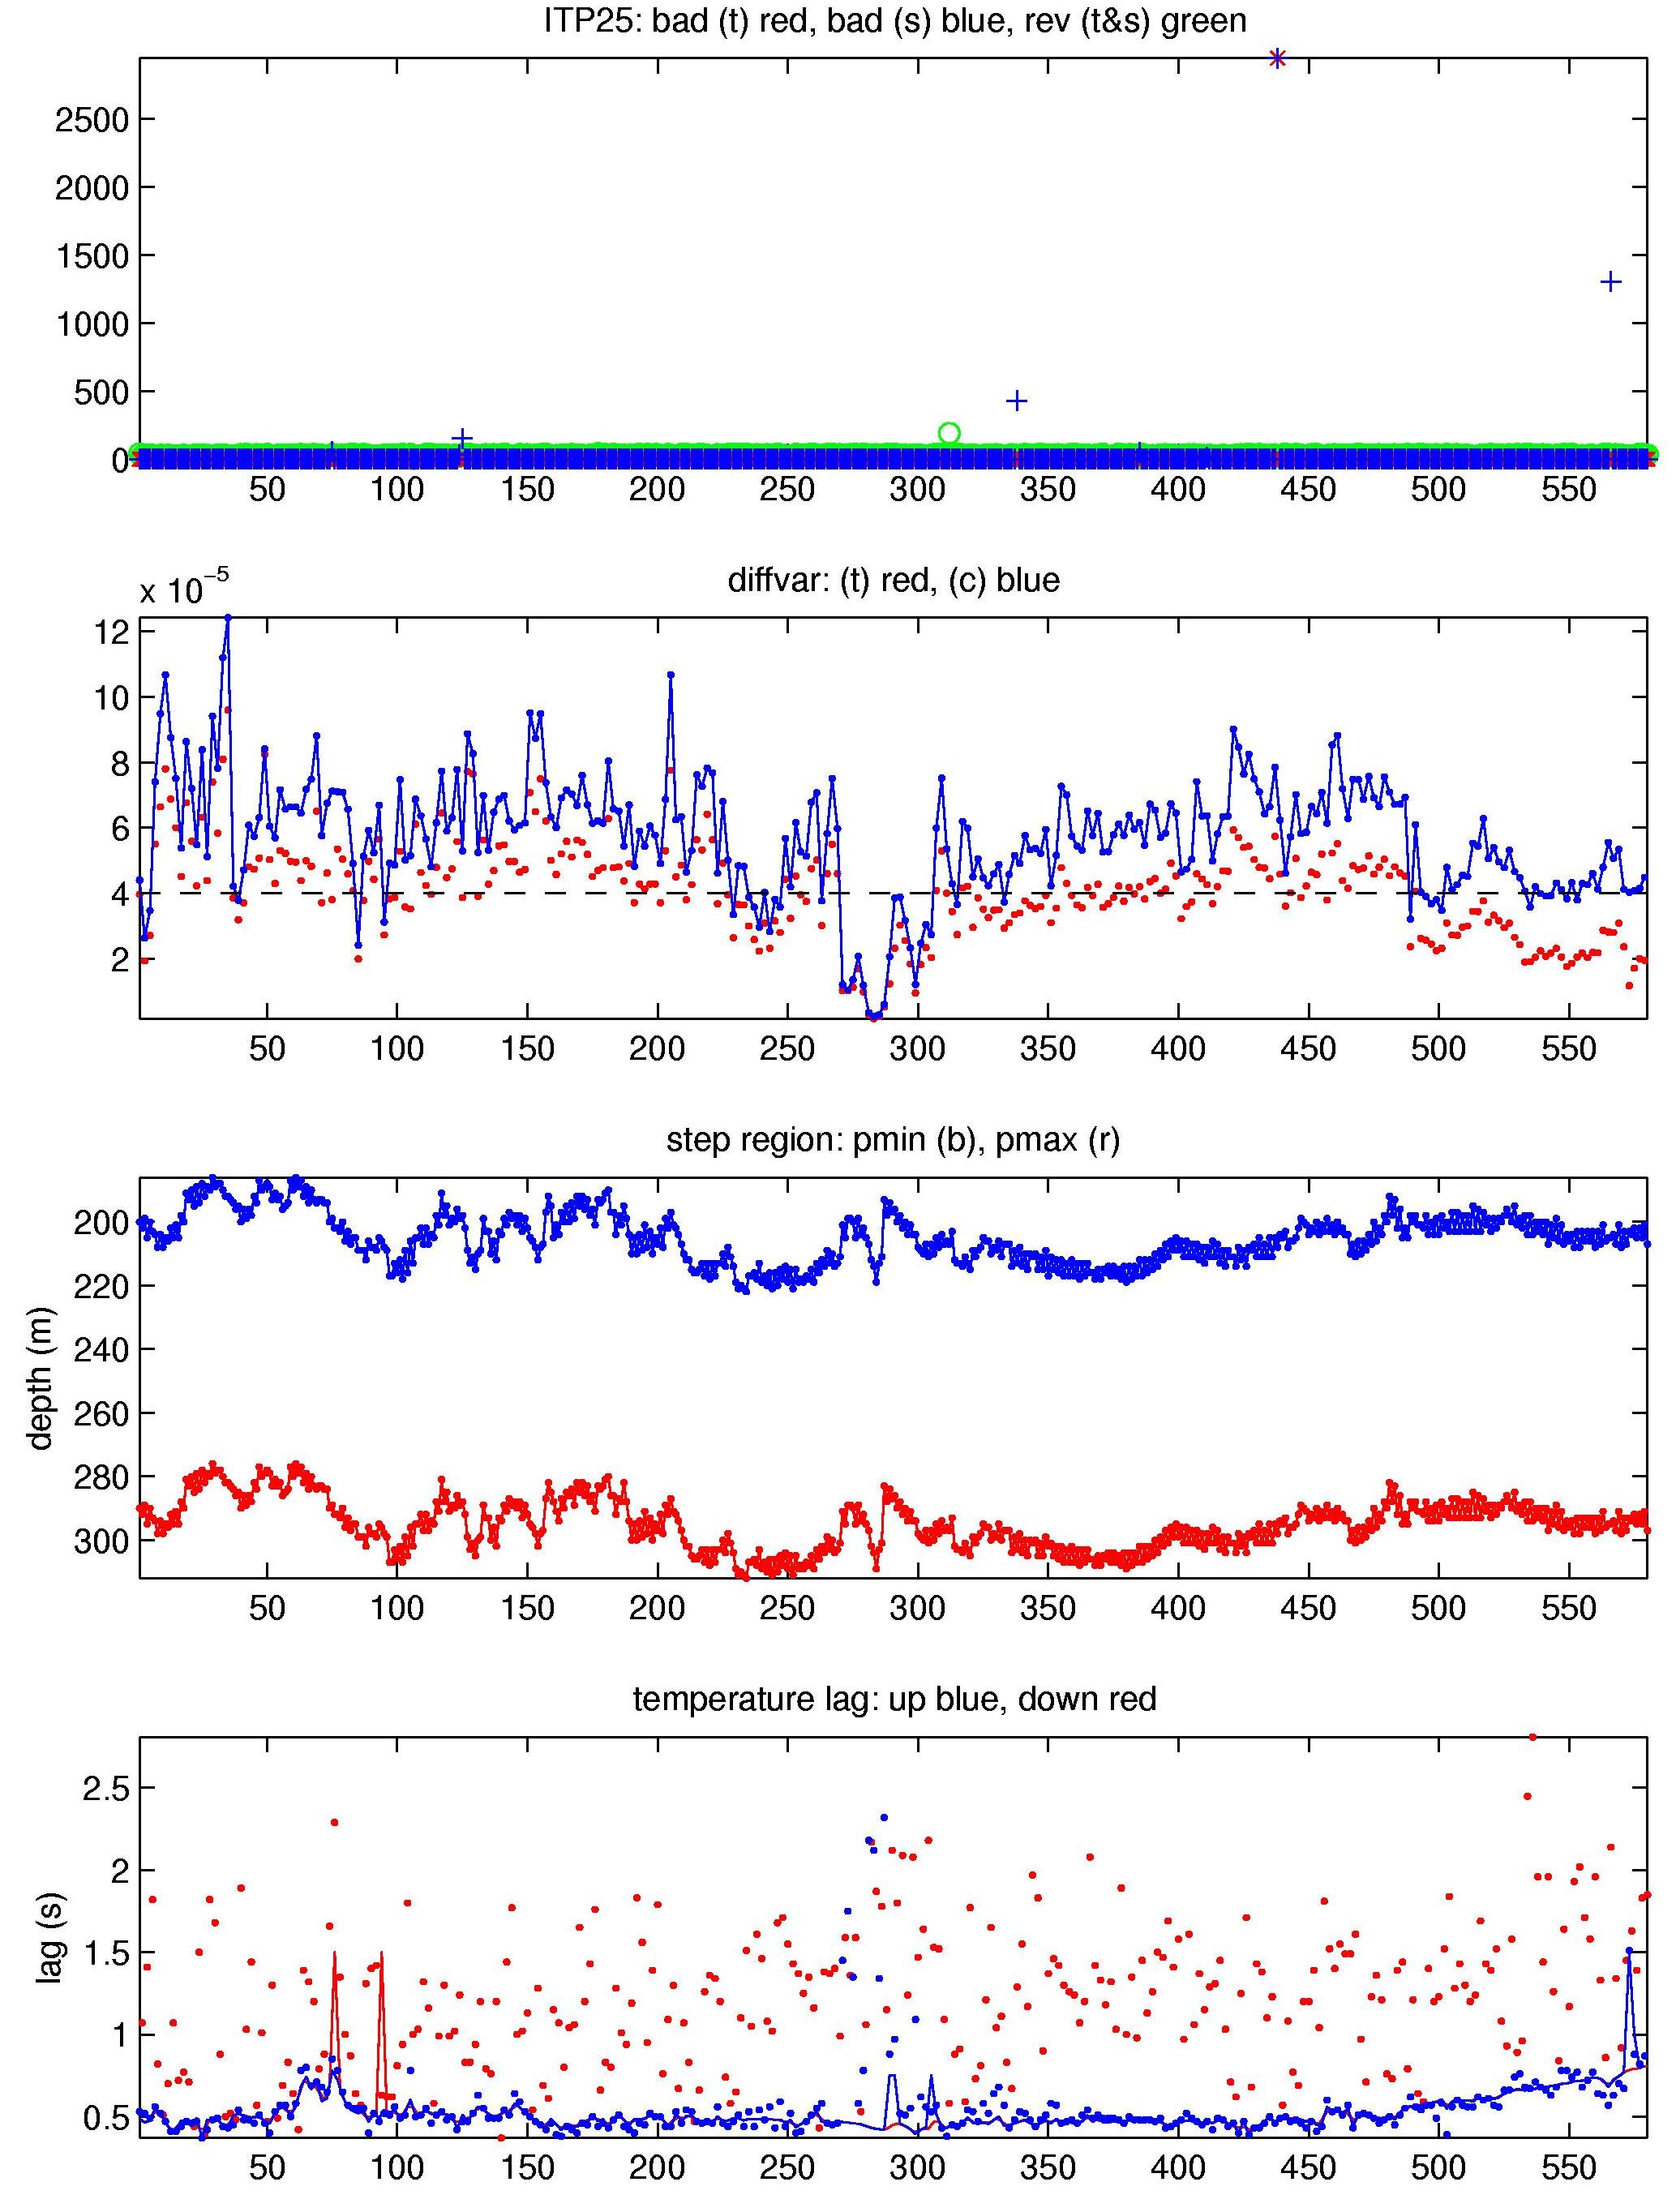
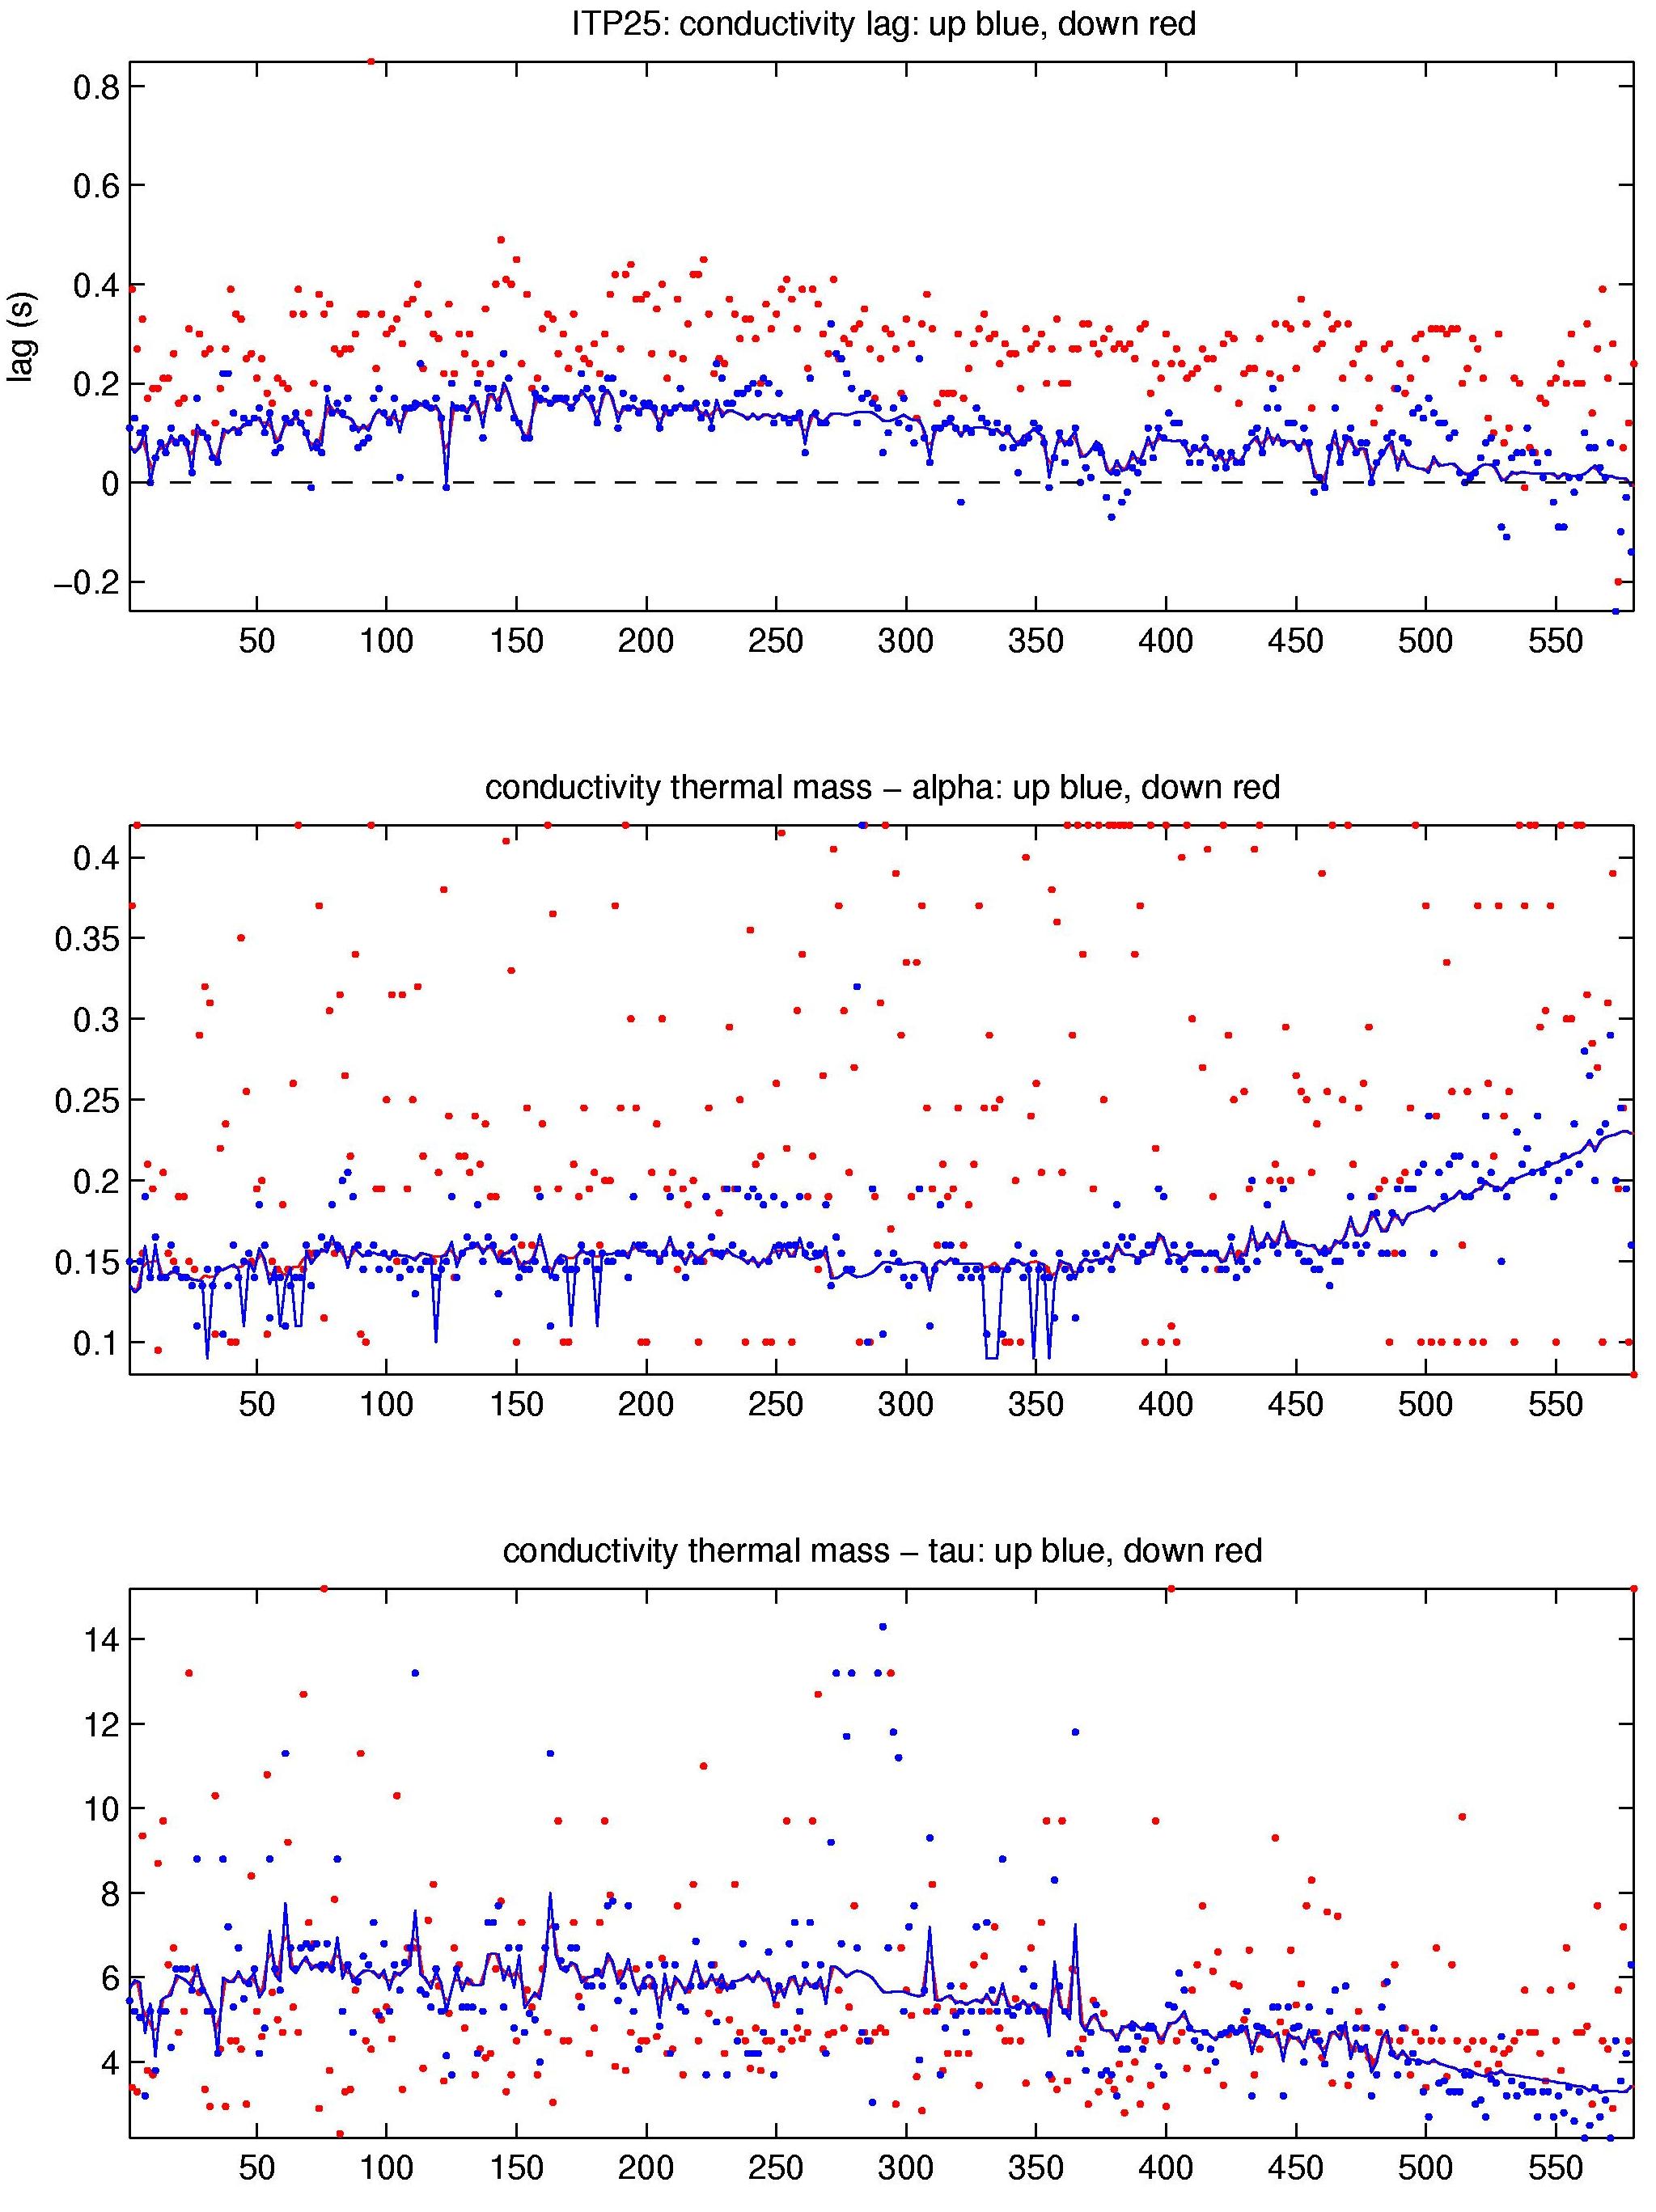
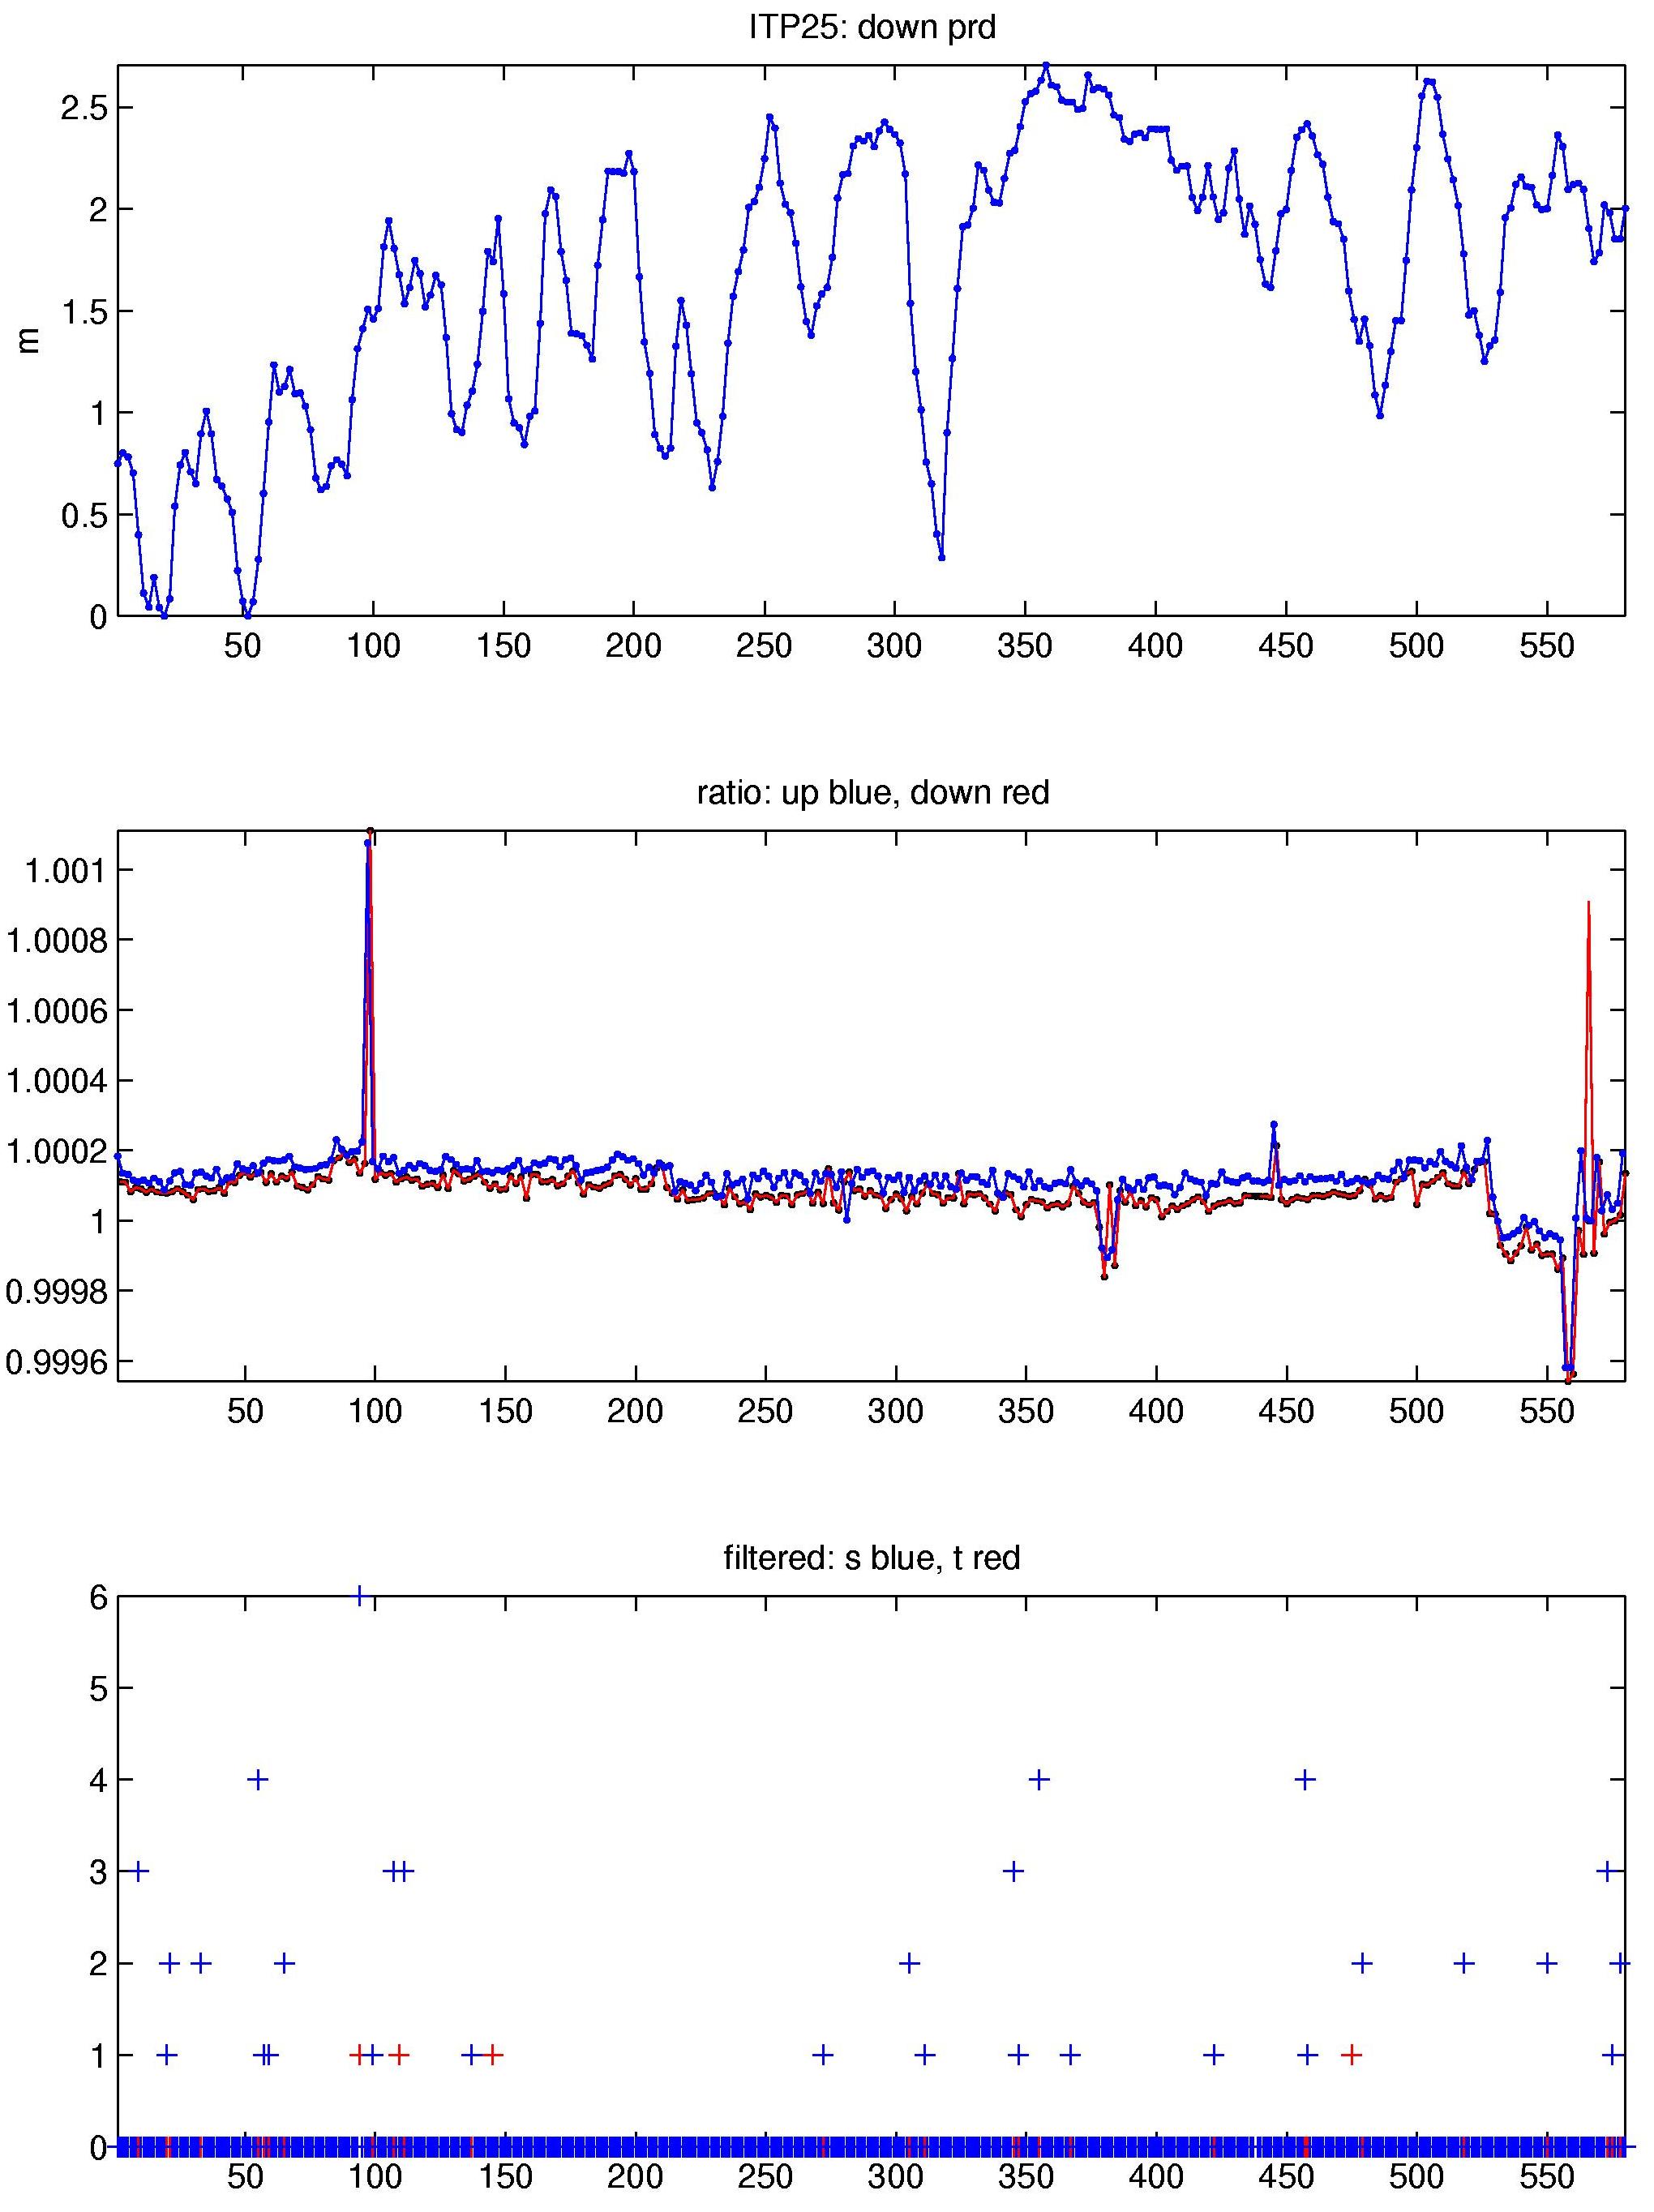
The 580 profiles that were recovered from the ITP were processed according to the procedures described in the ITP Updated Data Processing Procedures. The processing parameters for ITP 25 are shown in the figures to the right. Buoy drift speeds were almost always less than 30 cm/s throughout the entire time series so the profiler covered the full extent of every profile.
The CTD data required little editing for biofouling or similar glitches. One complete profile (438) was eliminated due to unrealistic conductivity (C), while only two profiles had significant portions removed for similar reasons. Single point C spikes were removed from roughly 15 profiles. Based on these edits, ITP25 had a 99.5% good data return.
Thermohaline staircases were present throughout most of the time series, enabling CTD lag corrections (the variance criterion for their detection dropped briefly below the 0.0004 threshold for profiles 275 through 310). All of the lags were in the typical range found for previous systems. During manual editing, a small set of lags (order 20) were modified to remove small "spikes" at the base of T/S steps (T lag), or to adjust a slight salinity tilt (S reducing with depth within a step, leading to slight density inversions; adjust thermal lag).
Potential conductivity was mostly constant and close to unity. The record included four spikes, which were investigated by inter-comparison of S, T, and density profiles as well as TS diagrams within a group of neighboring profiles. In one instance (profile 438) the conductivity adjustment was reset to neighboring values: as mentioned above, 438 had been significantly edited, and the remaining profile was "short", i.e., had little overlag with our historical conductivity fields. This might have "fooled" the calibration routines. In all other cases, the determined conductivity adjustment was confirmed.
See the Data Products tab to the left for descriptions of the three levels (I, II, III) of data processing and to access all data.
