ITP 15 Data Processing
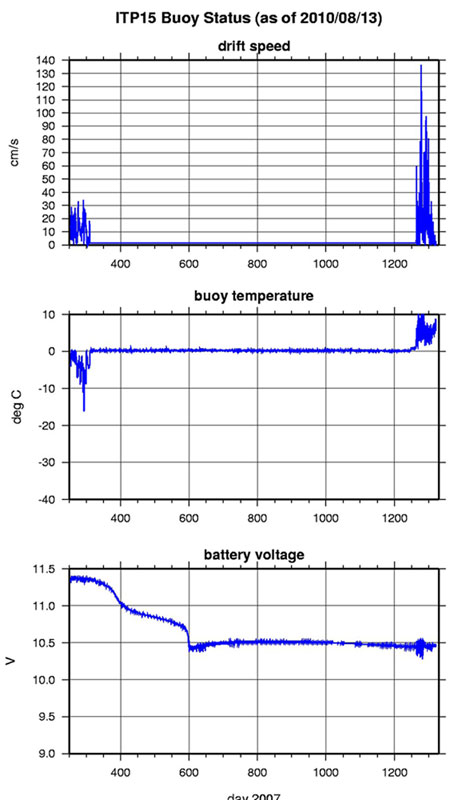
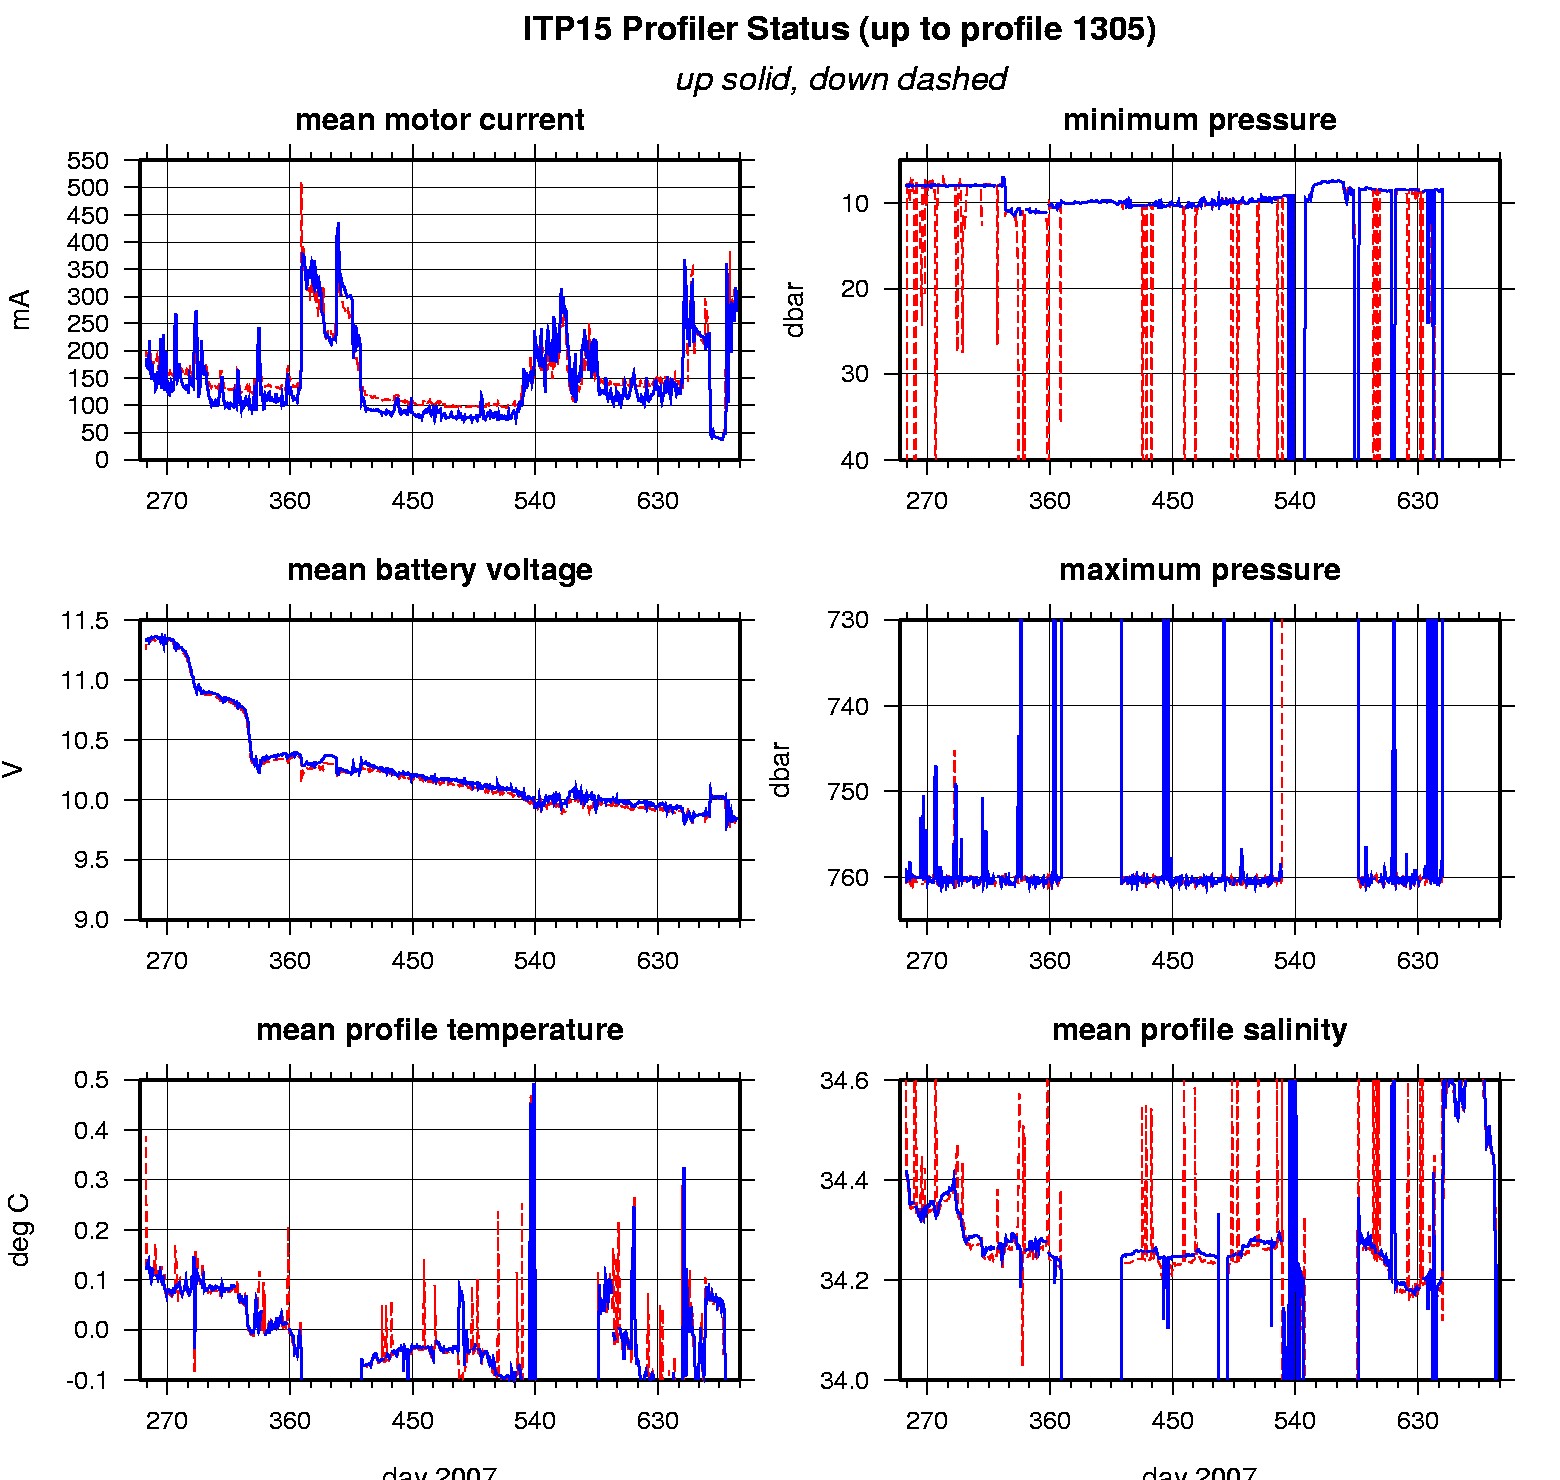
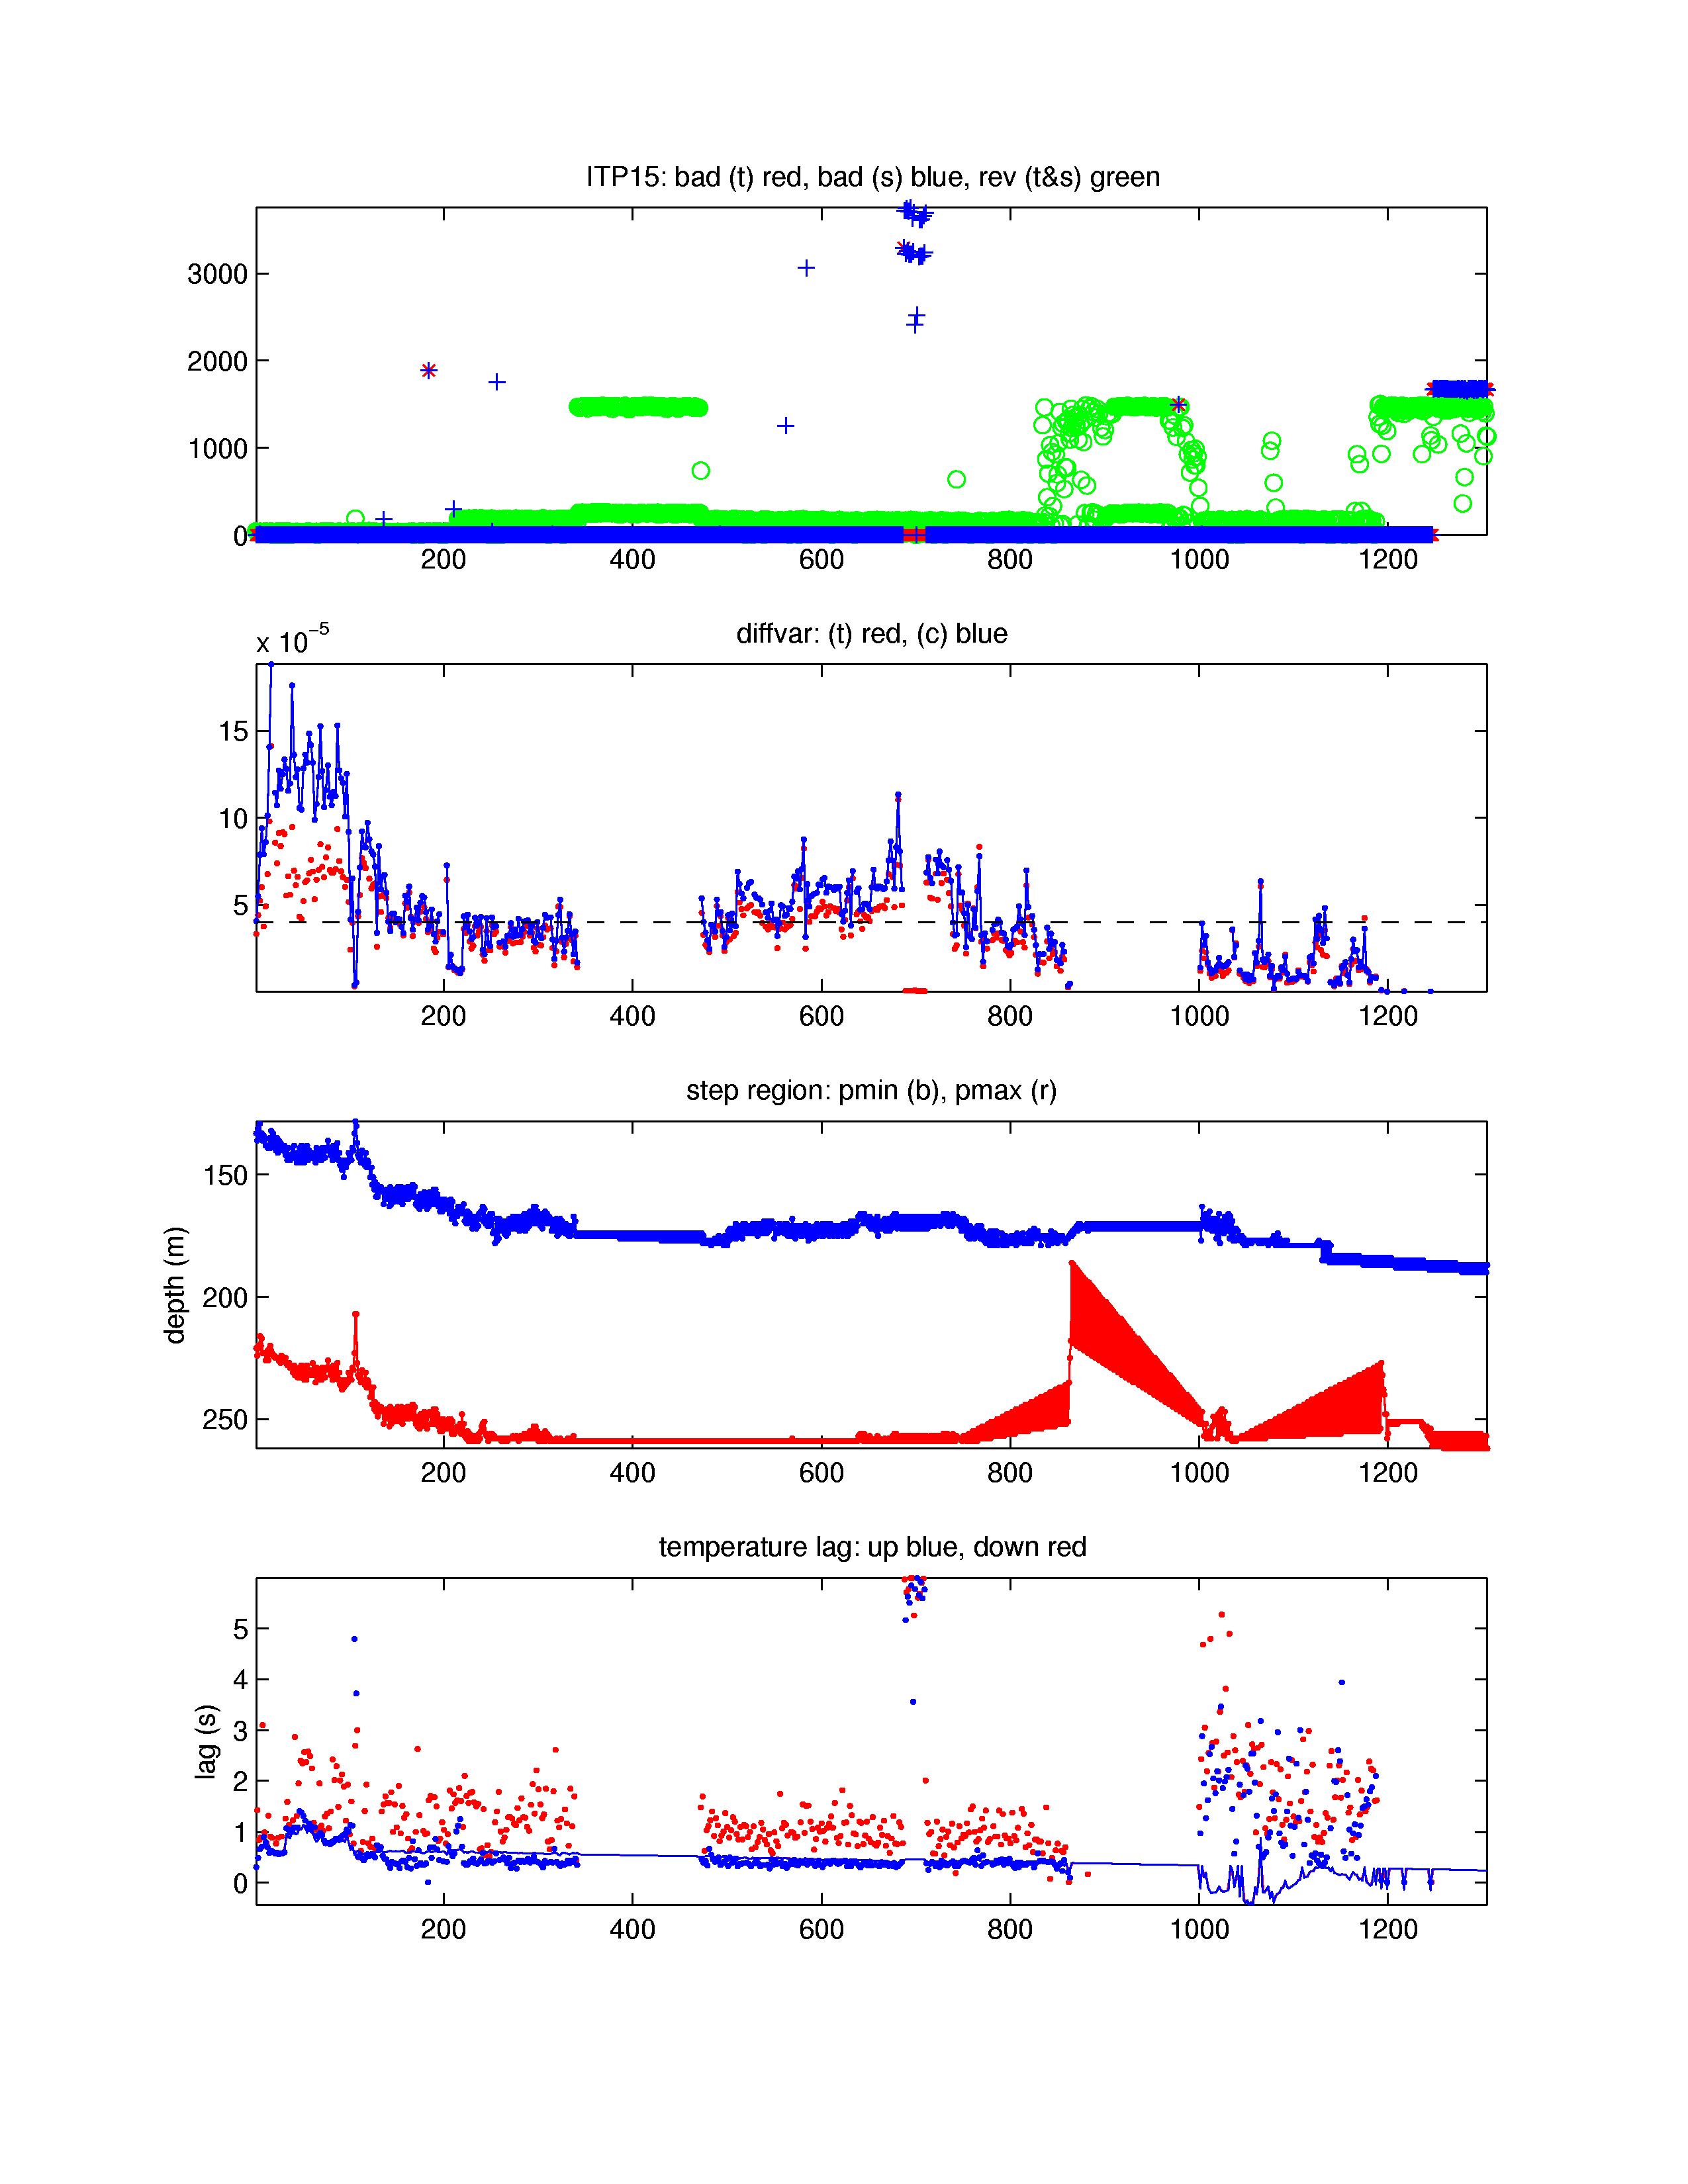
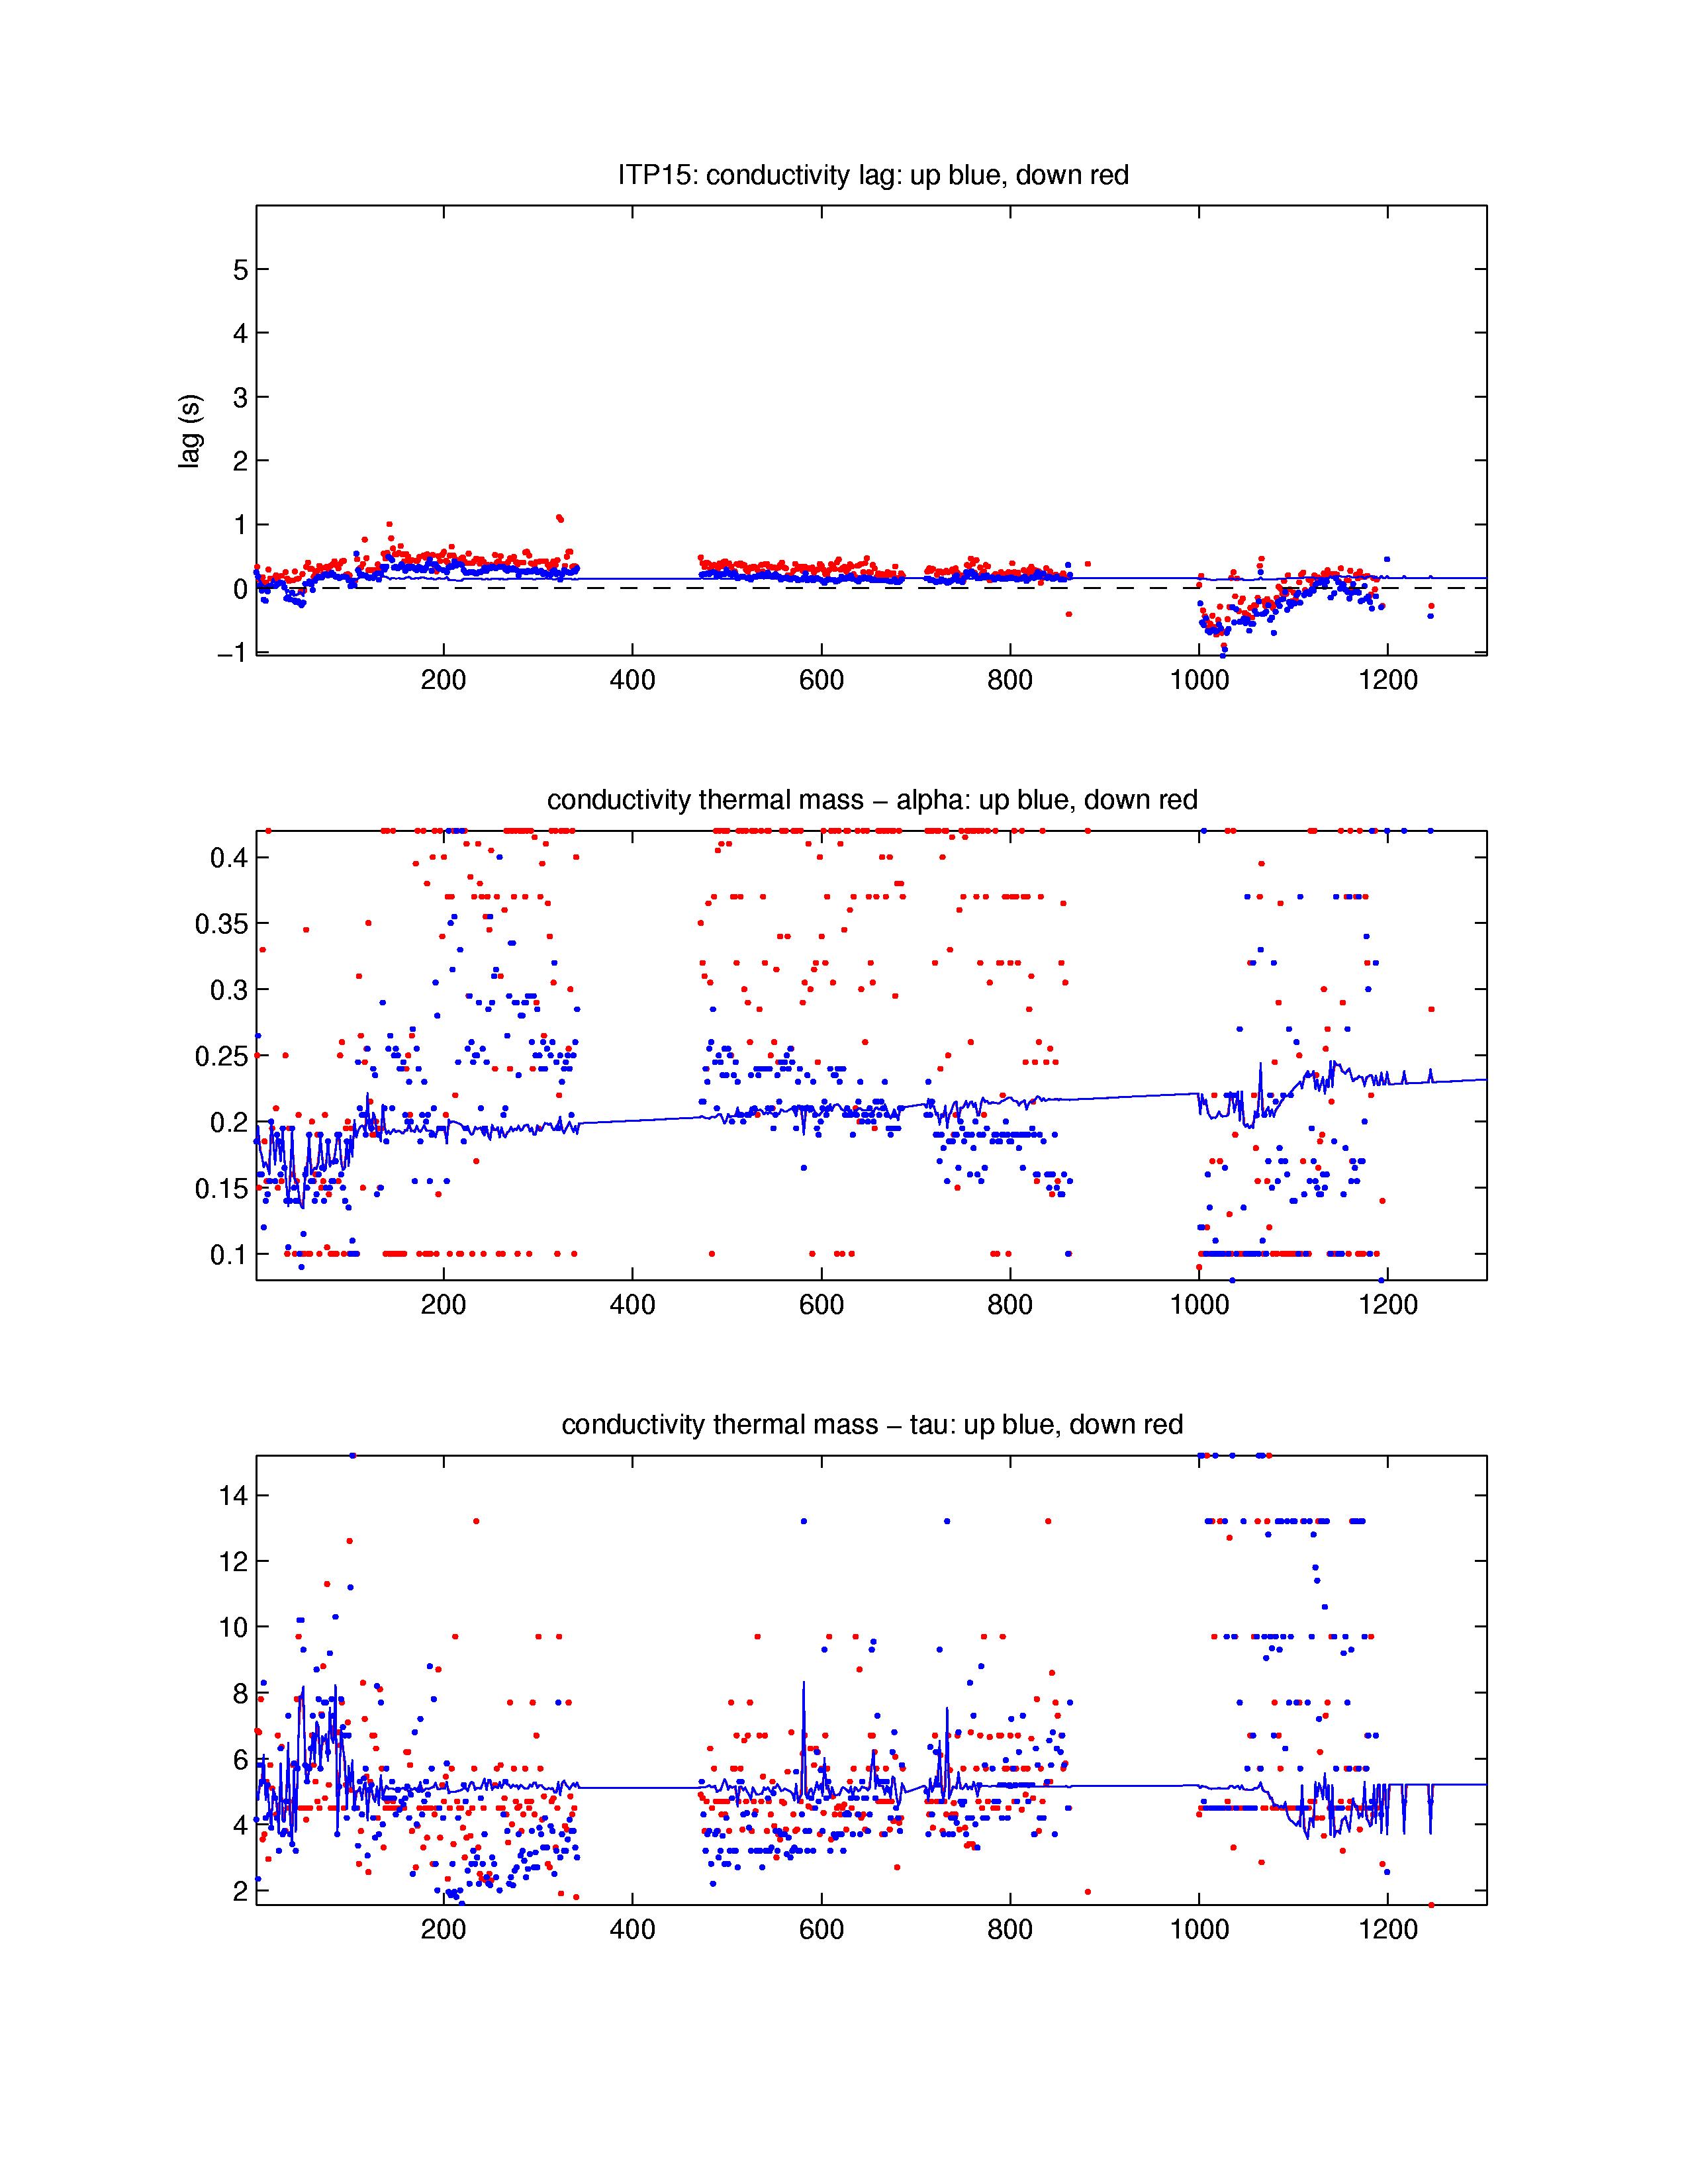
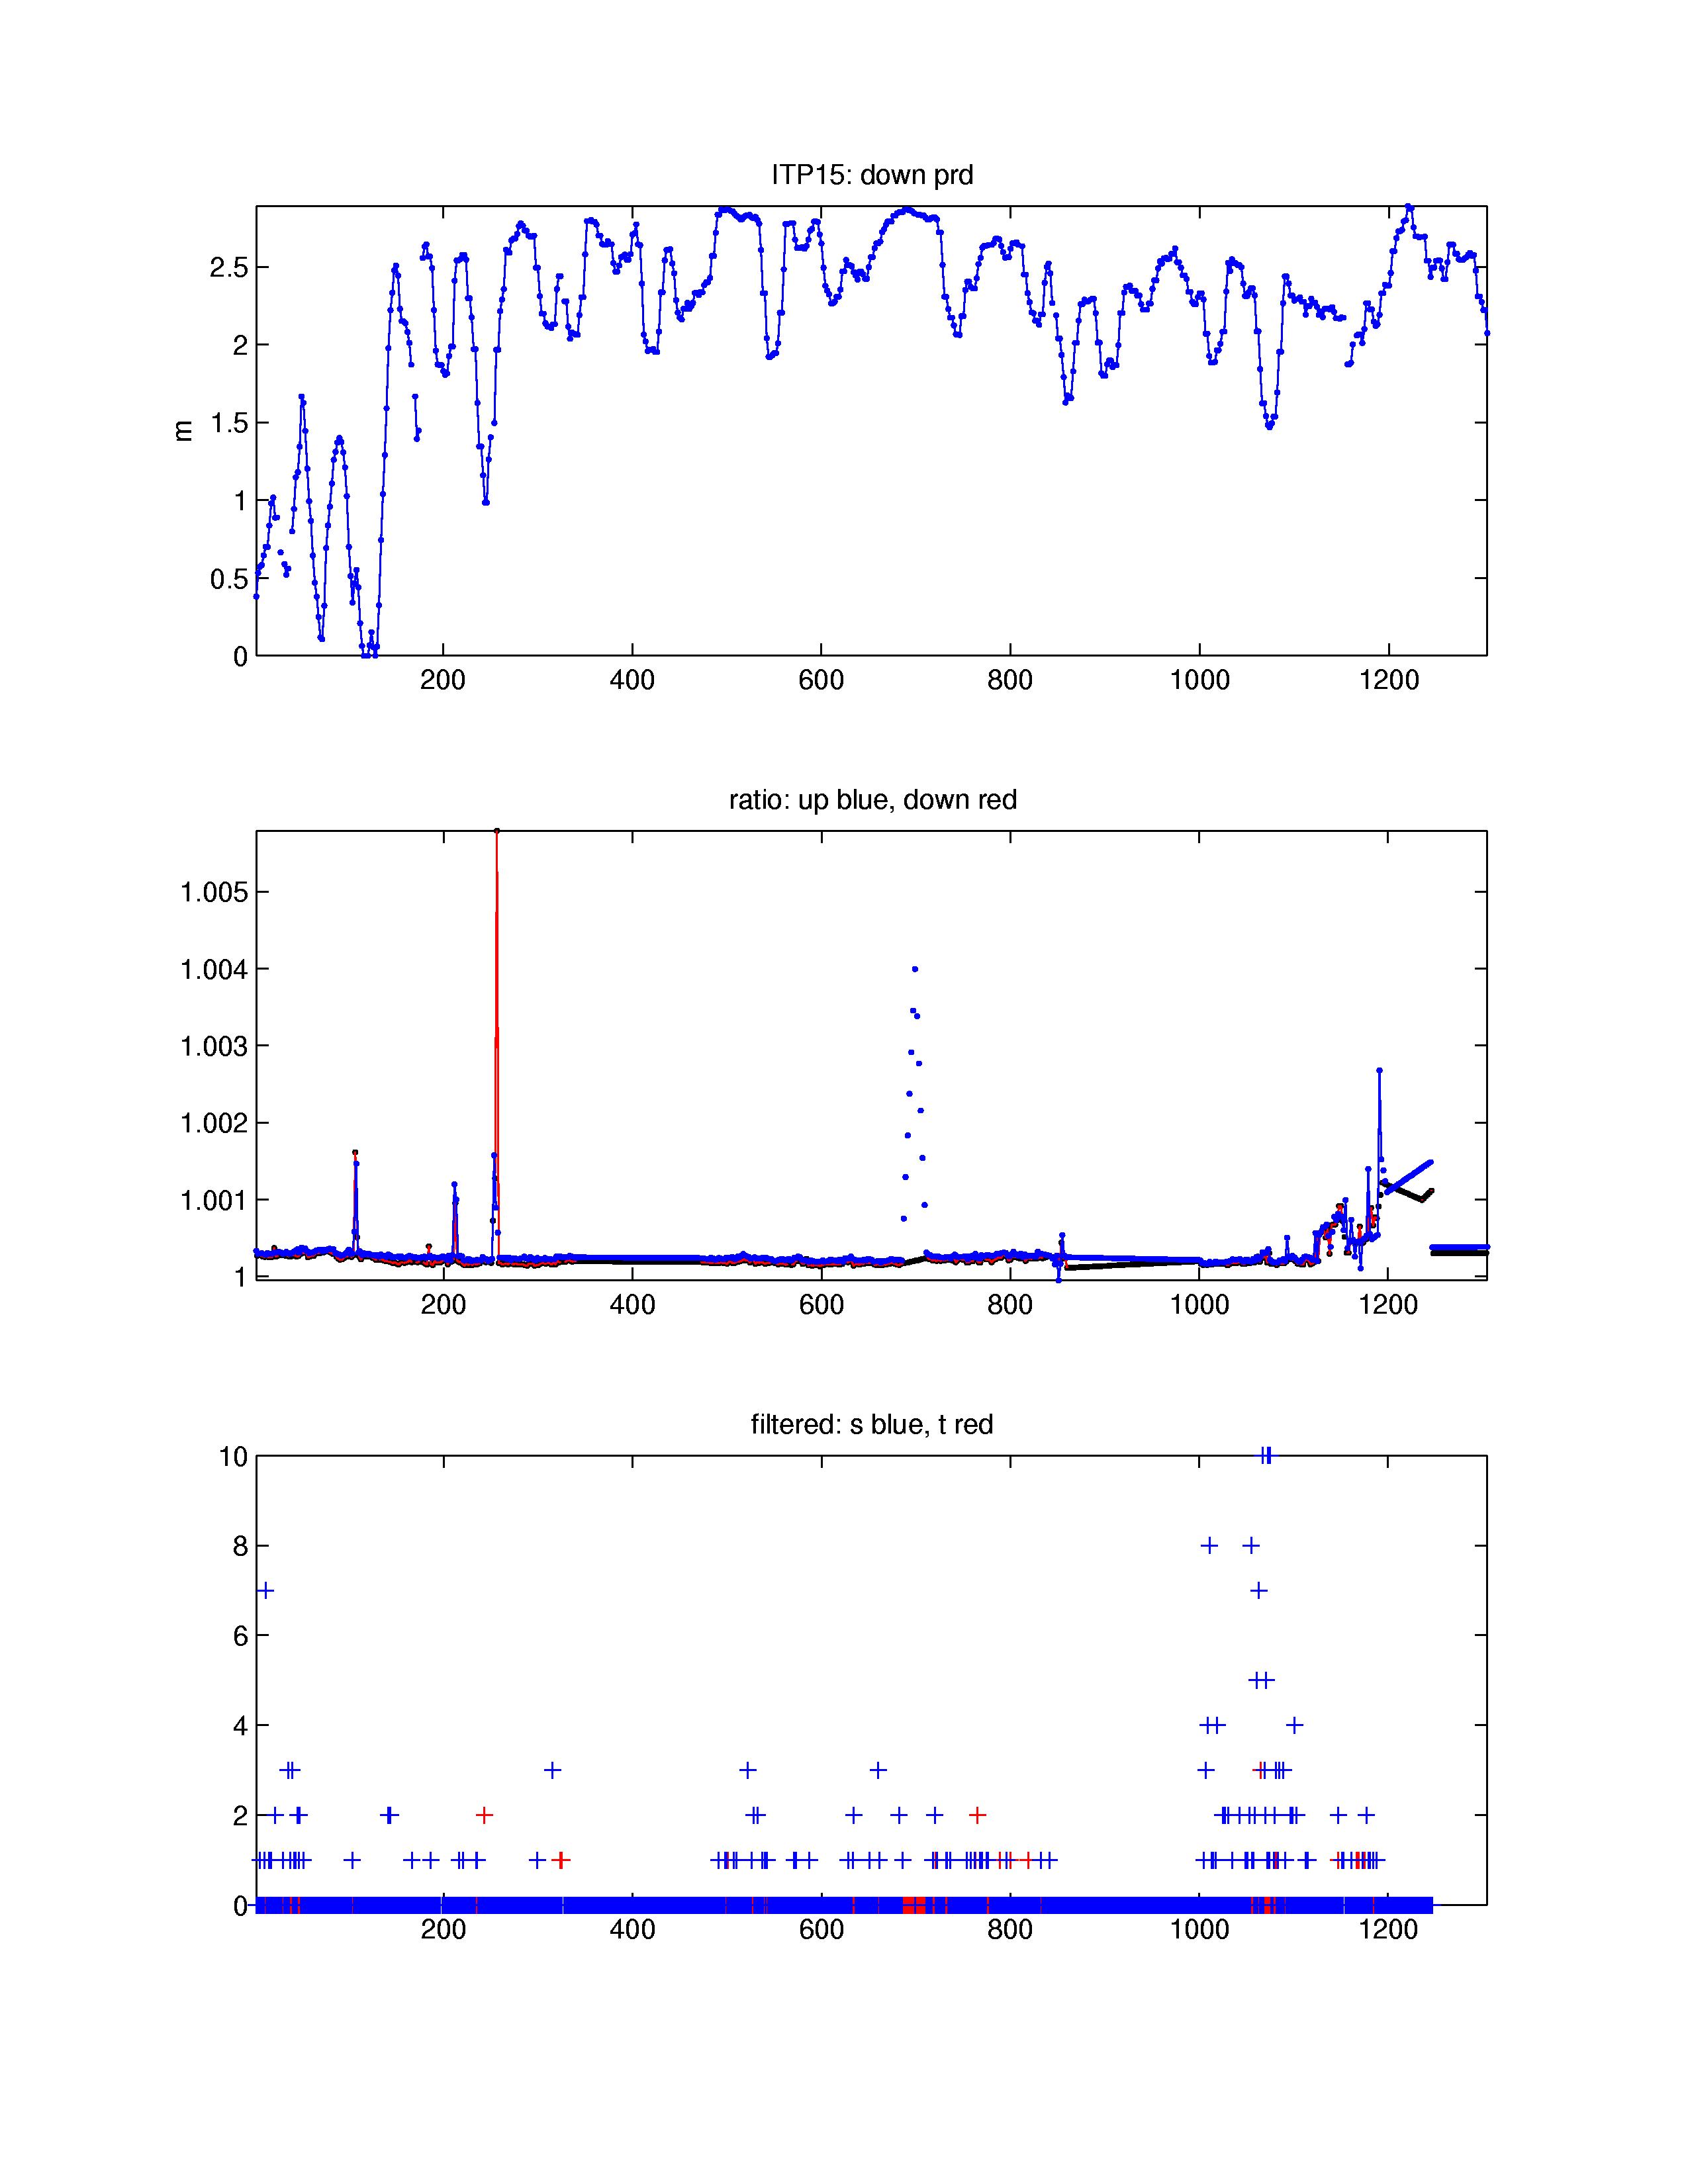
The 1305 profiles that were recovered from the ITP were processed according to the procedures described in the ITP Updated Data Processing Procedures. The processing parameters are shown in the figures to the right. However, only 820 profiles traversed vertically more than 700 m, while 424 less than 50 m (including 38 resets due to software error). In particular, large segments of profiles 342 through 471, 860 through 999, and all after 1189 did not traverse vertically, but the instrument was stuck at a single depth or hovered over a narrow depth range while motor currents exceeded typical values. During the first period, the profiler may have become trapped in the ice when the surface package was submerged. For the latter two periods, this behavior could be due to slackening of the mooring tether when the anchor dragged over shallow bathymetry, although the precise position of ITP 15 after November 5, 2007 is not exactly known while the surface package GPS antenna was beneath the ice. Consequently, the locations of all profiles after 165 were reconstructed using Fowler (2003) daily ice motion vectors. Note that location errors could influence the pressure correction for down profiles which depends on drift speed and the profile-to-profile conductivity adjustment which depends on location.
Profiles 106 and 107 stand out from the rest due to colder and fresher anomalies below the Atlantic Layer. These data appear to be real, as opposed to other profiles which were removed due to suspected sensor fouling or icing (particularly between profiles 687 and 710). Clear thermohaline staircases appear only at the beginning and middle of the time series for the determination of sensor lags which are interpolated or extrapolated for the other profiles. In the final product, only about 60% of the profiles are free of any corrupted temperature and salinity points.
See the Data Products tab to the left for descriptions of the three levels (I, II, III) of data processing and to access all data.
Fowler, C. 2003, updated. Polar Pathfinder Daily 25 km EASE-Grid Sea Ice Motion Vectors. Boulder, Colorado USA: National Snow and Ice Data Center. Digital media. https://nsidc.org/data/nsidc-0116.html
