ITP 13 Data Processing
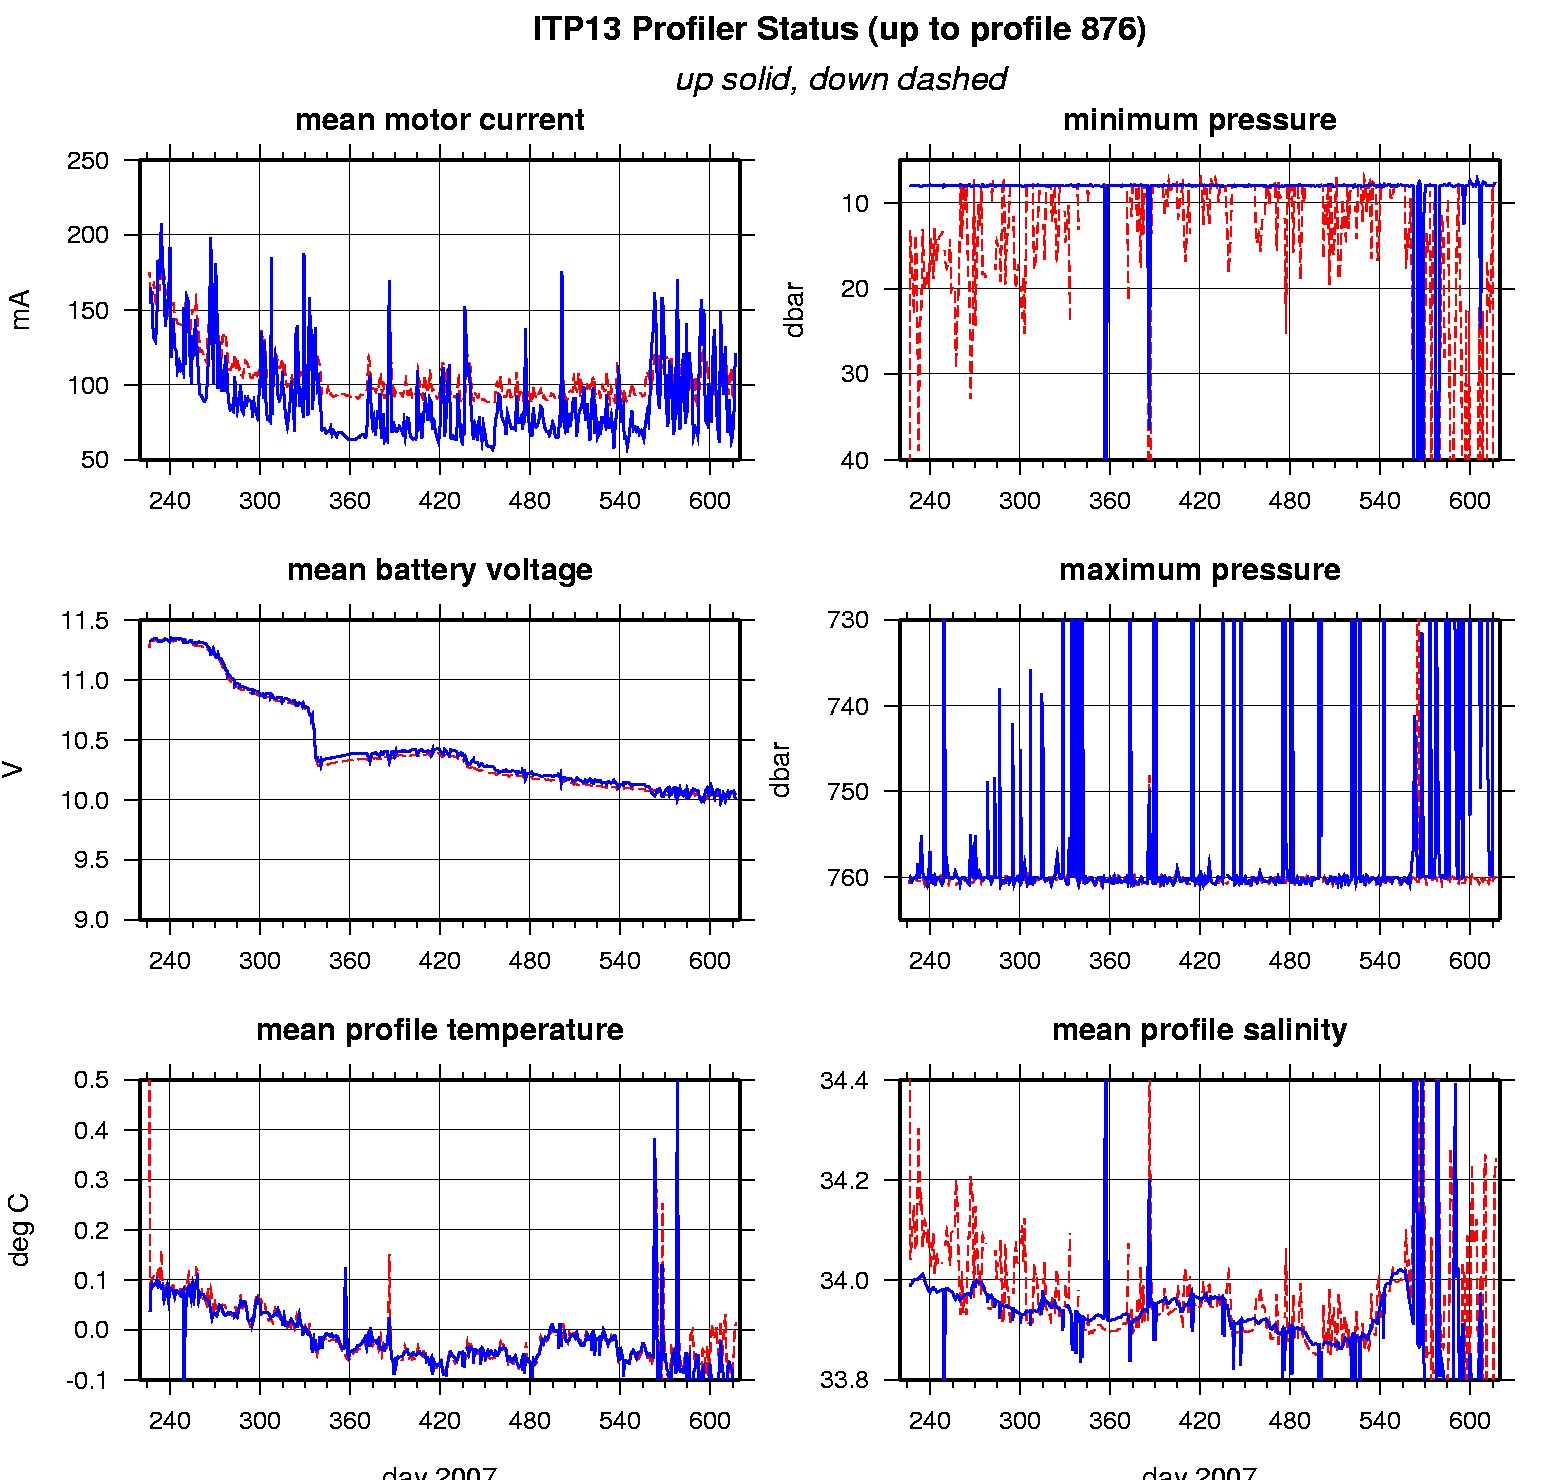
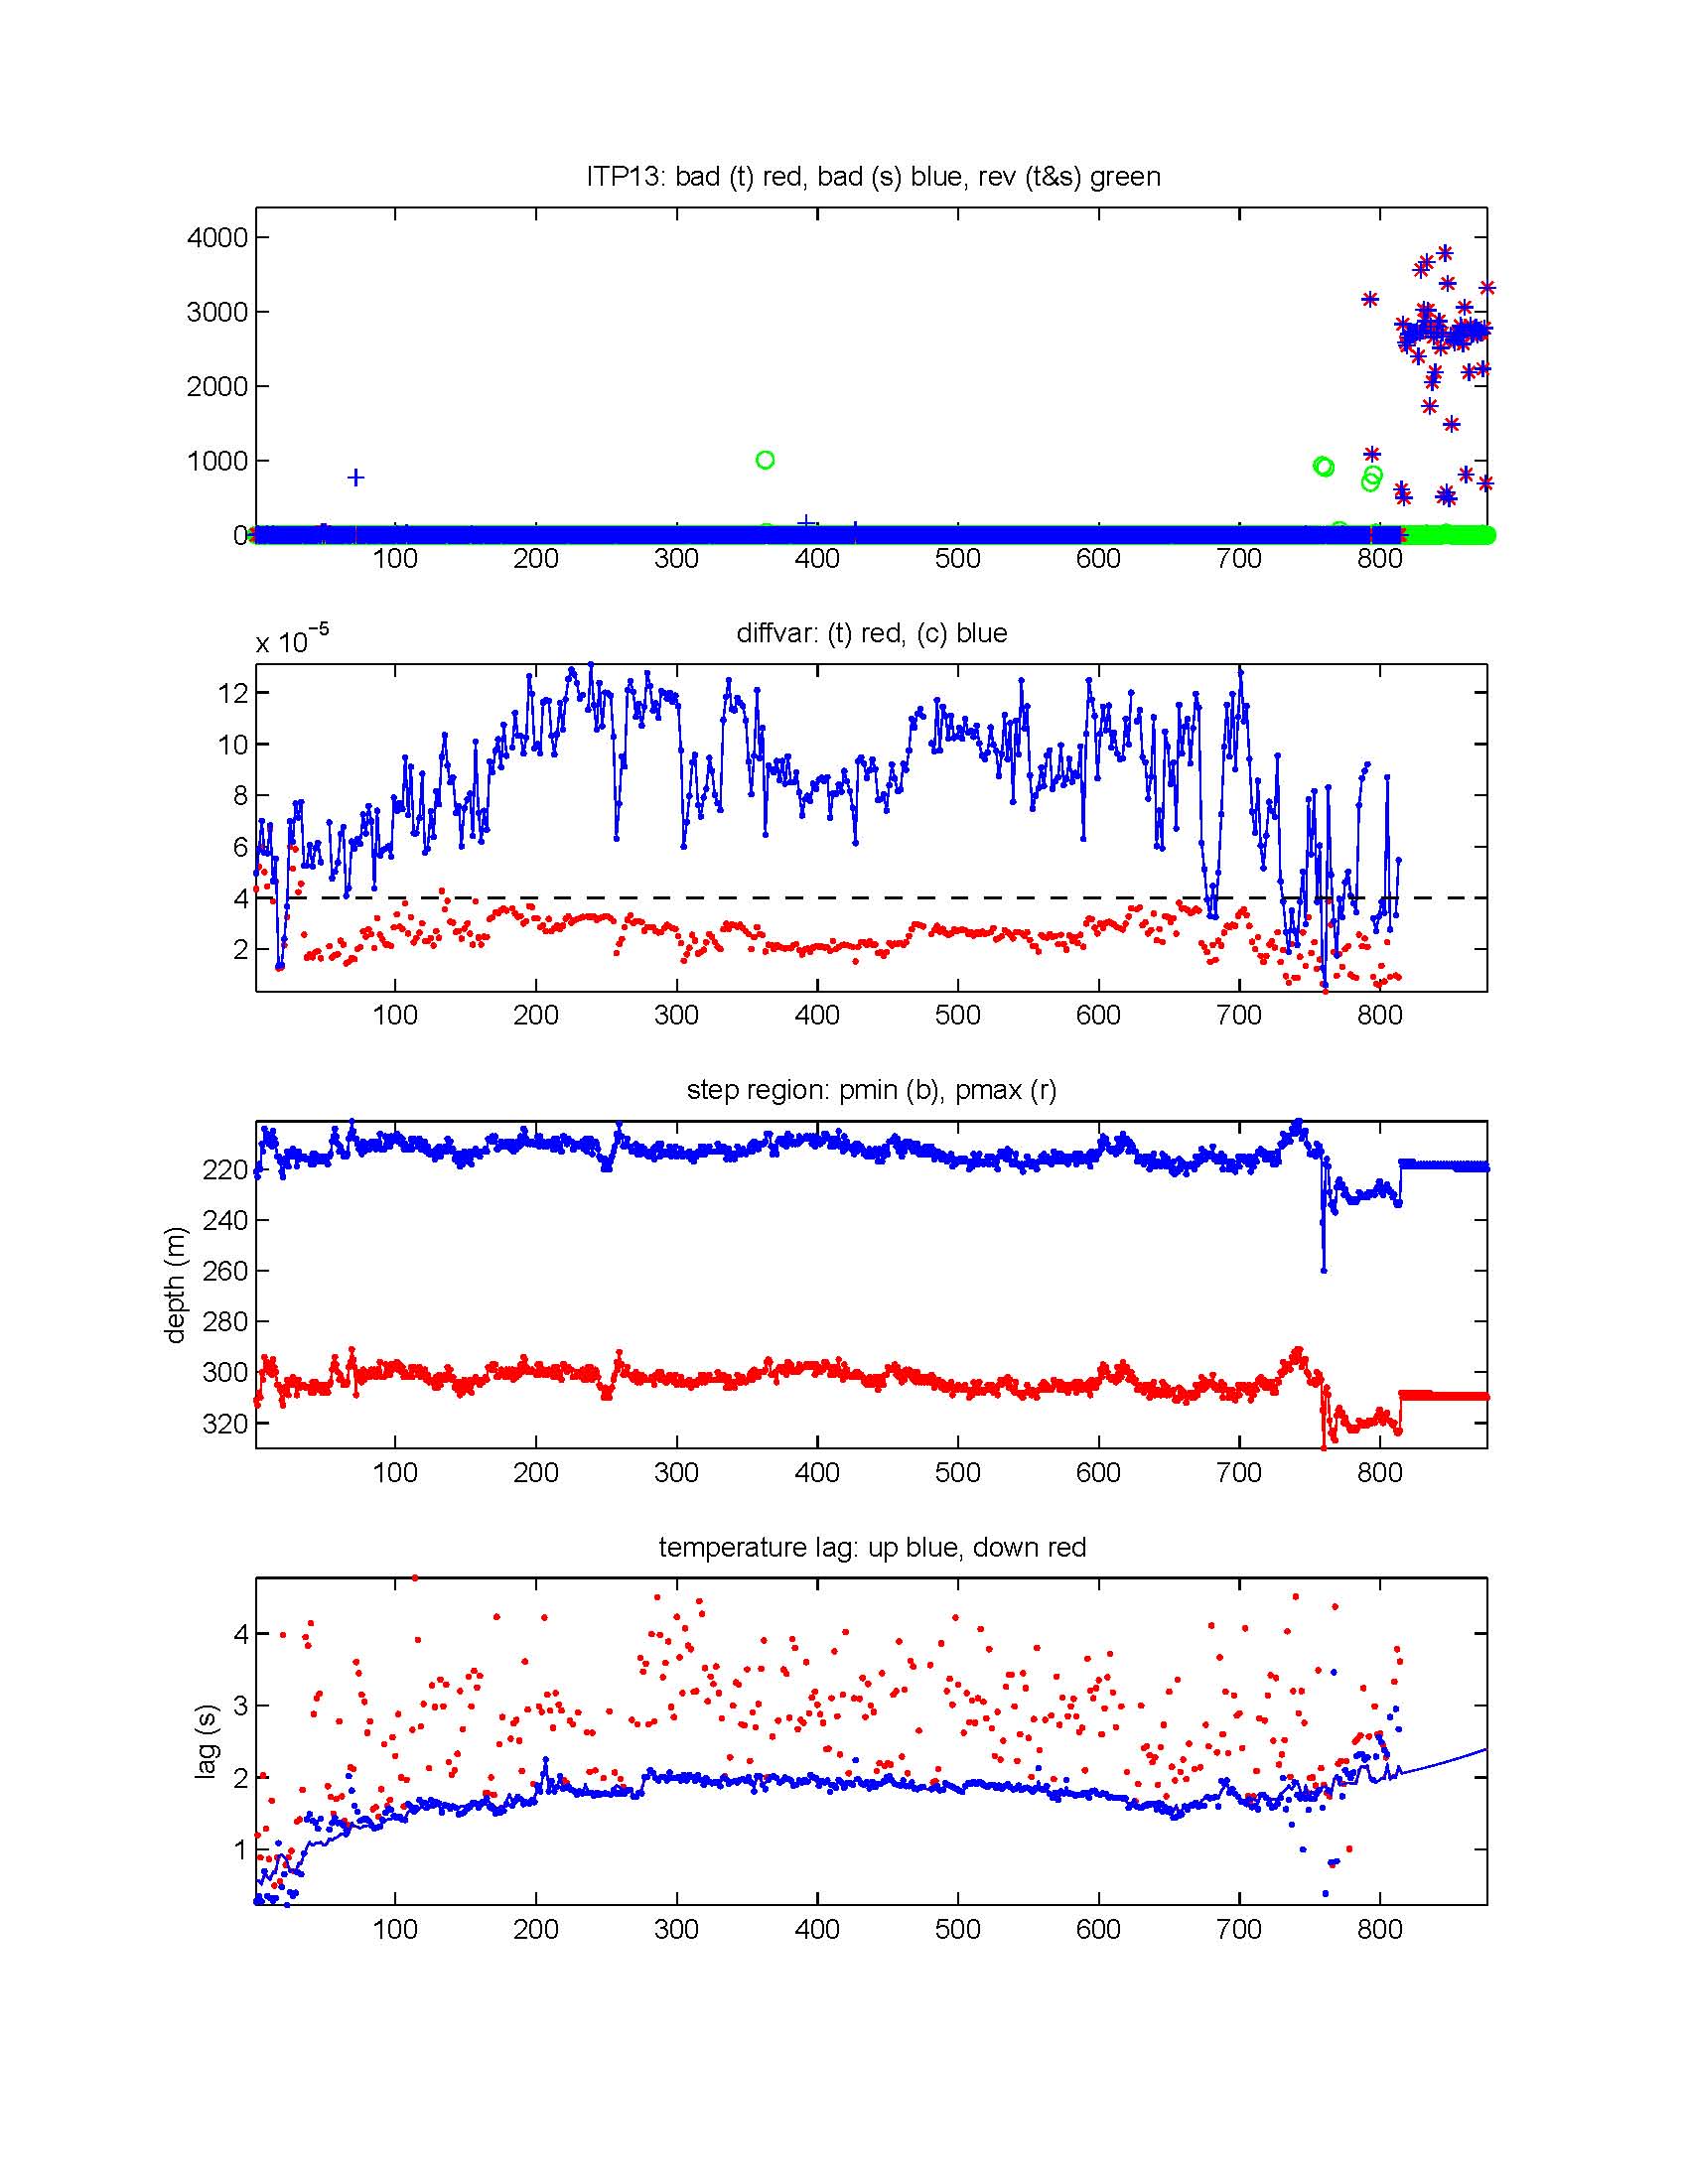
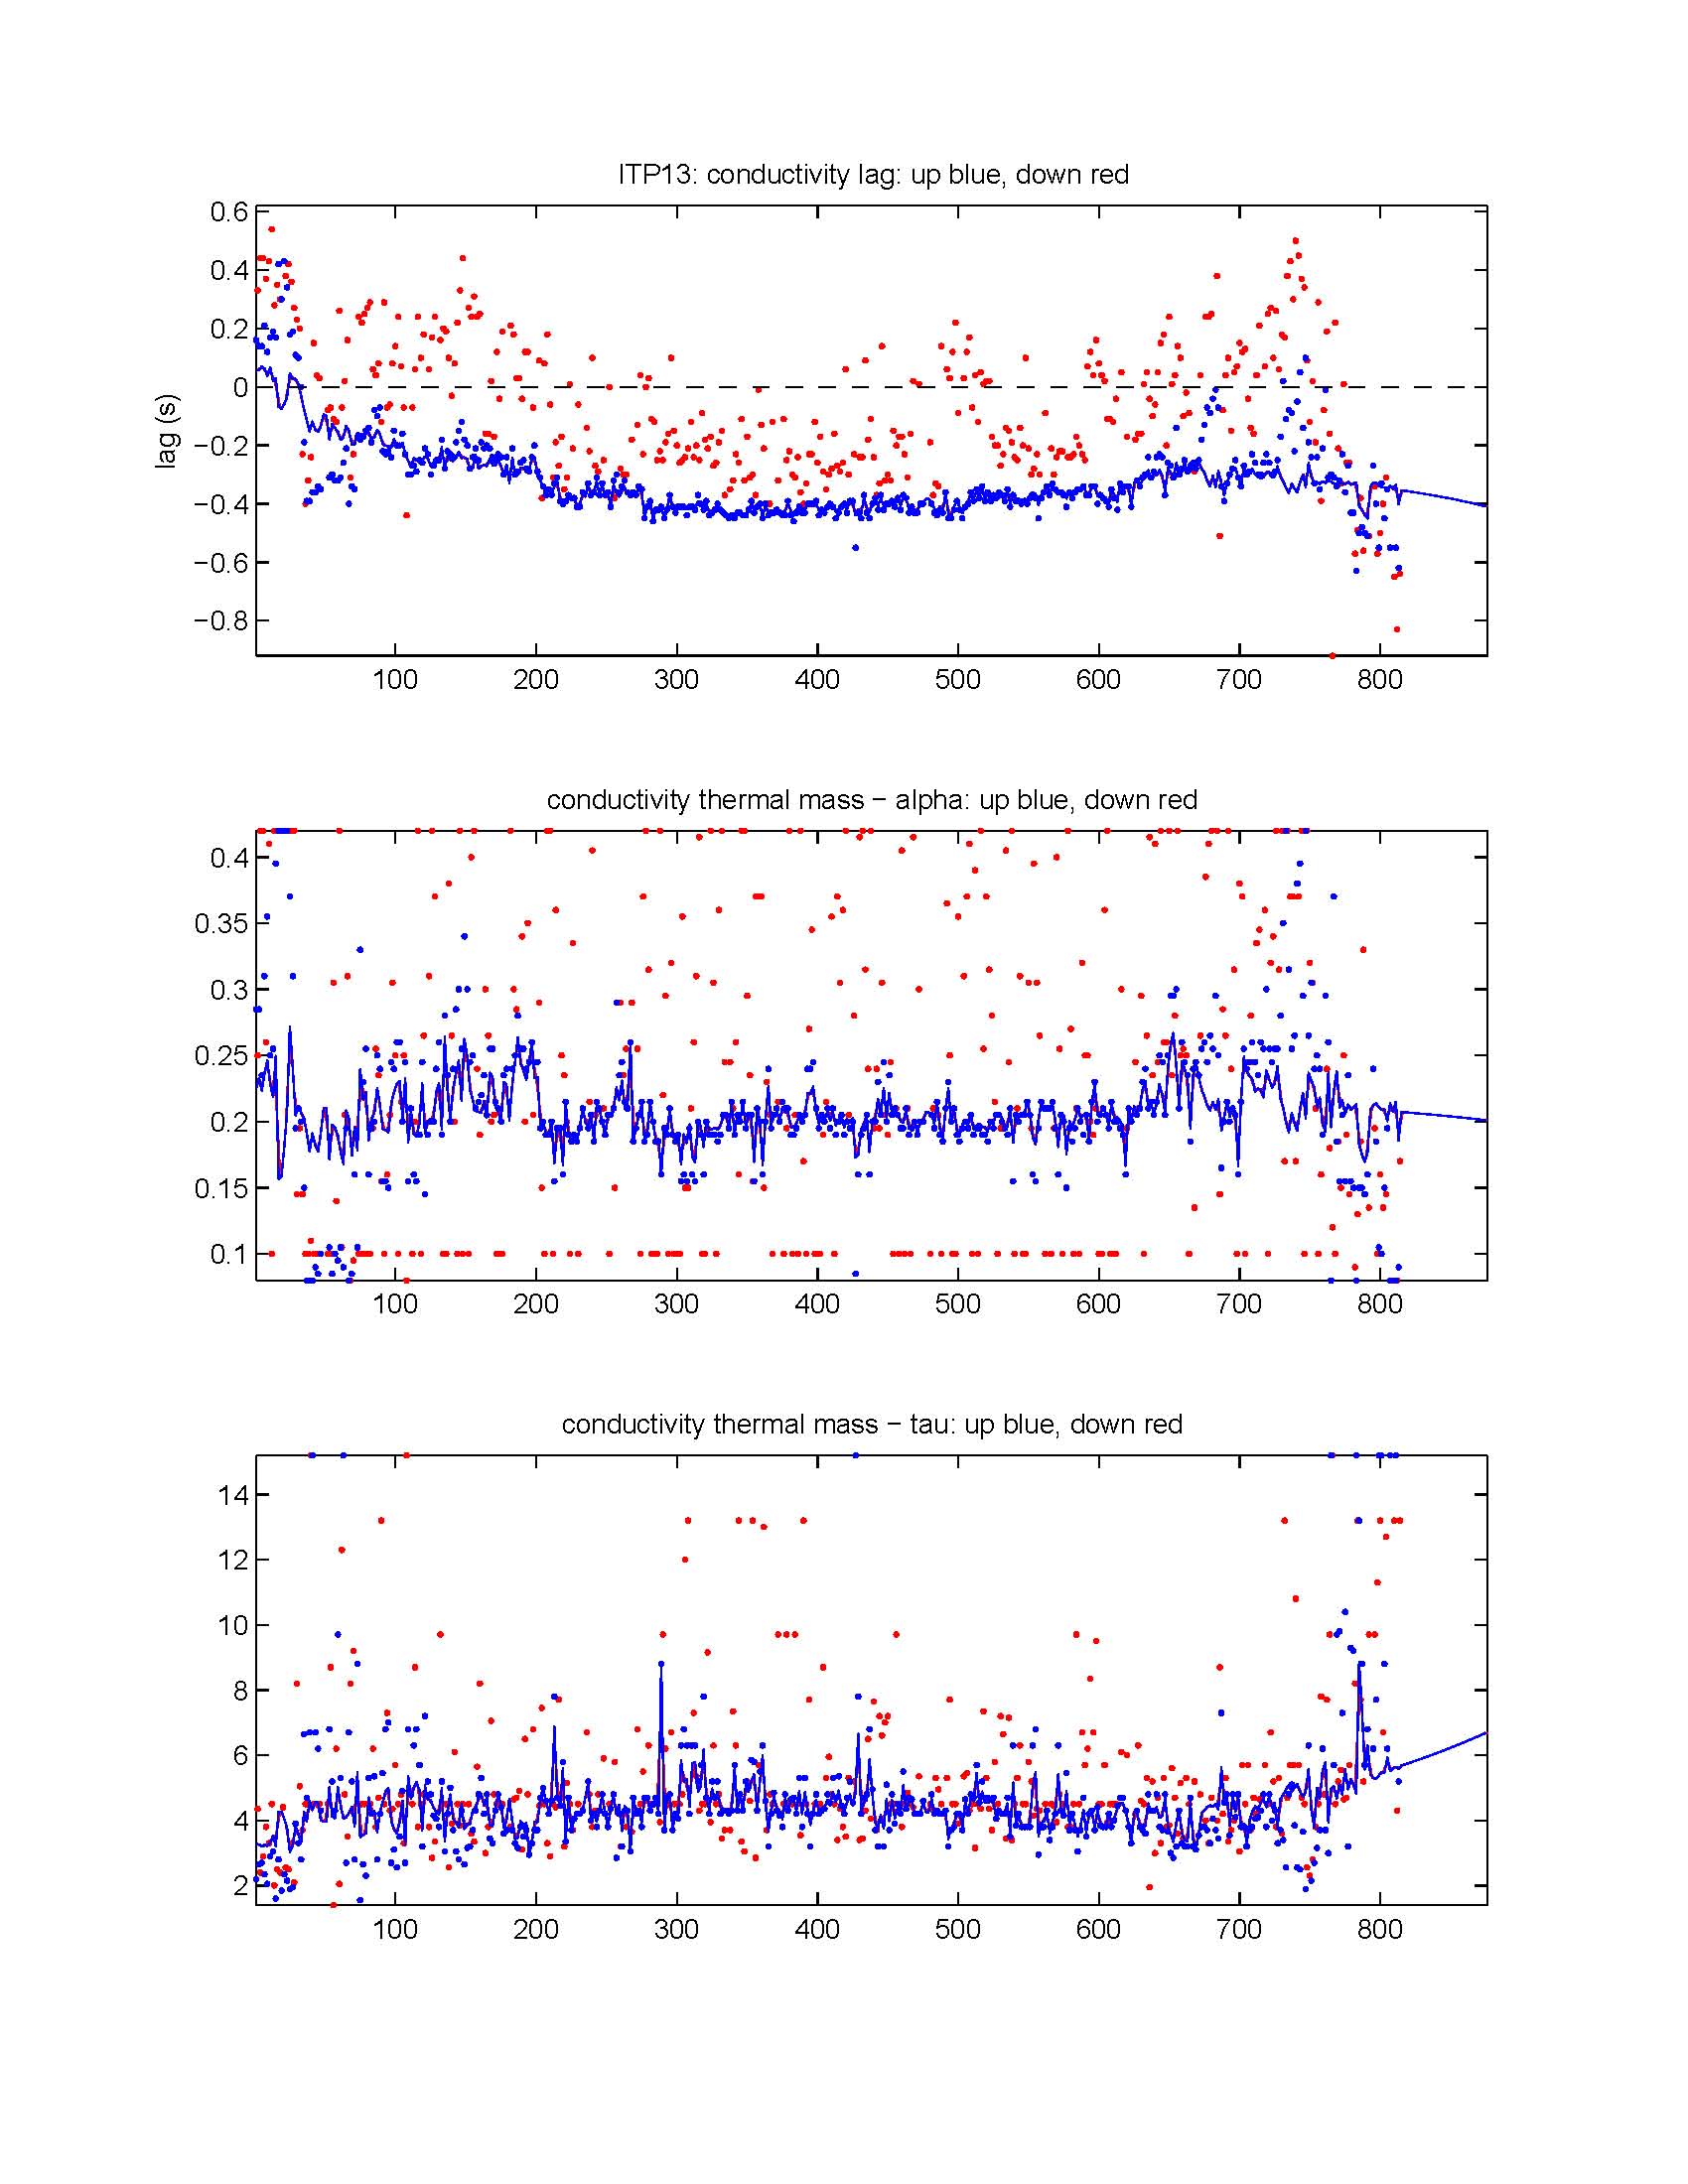
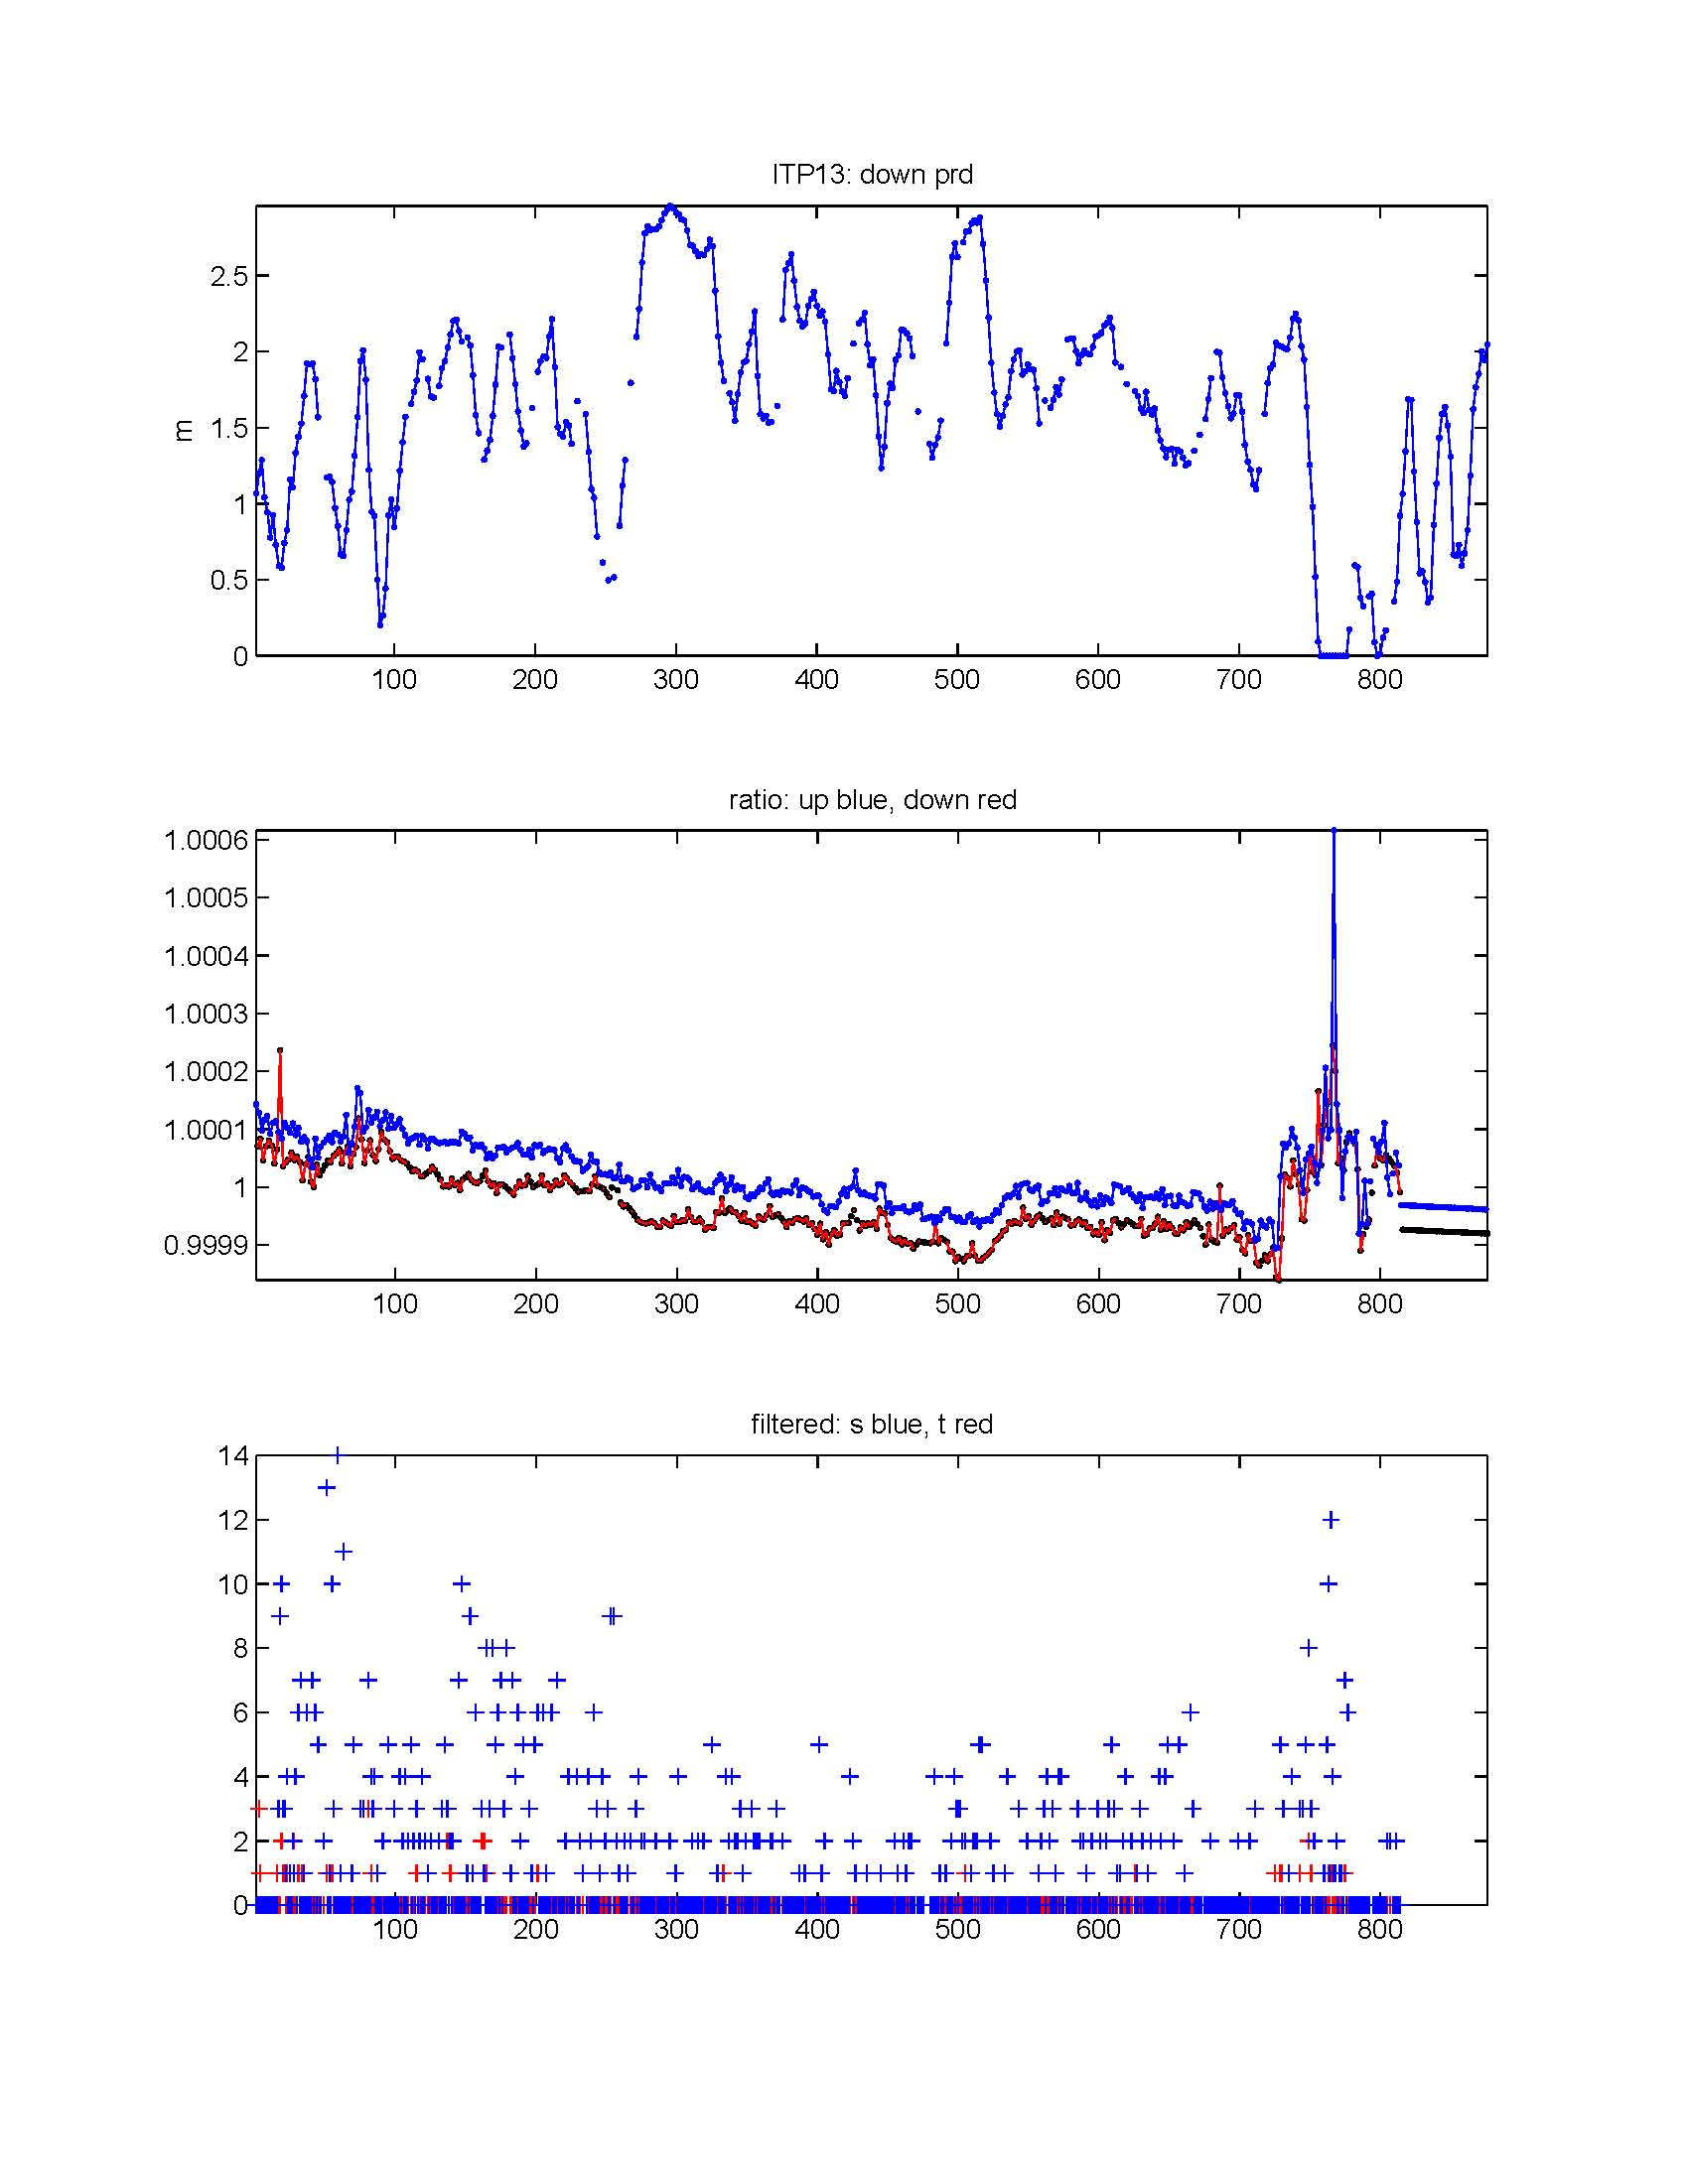
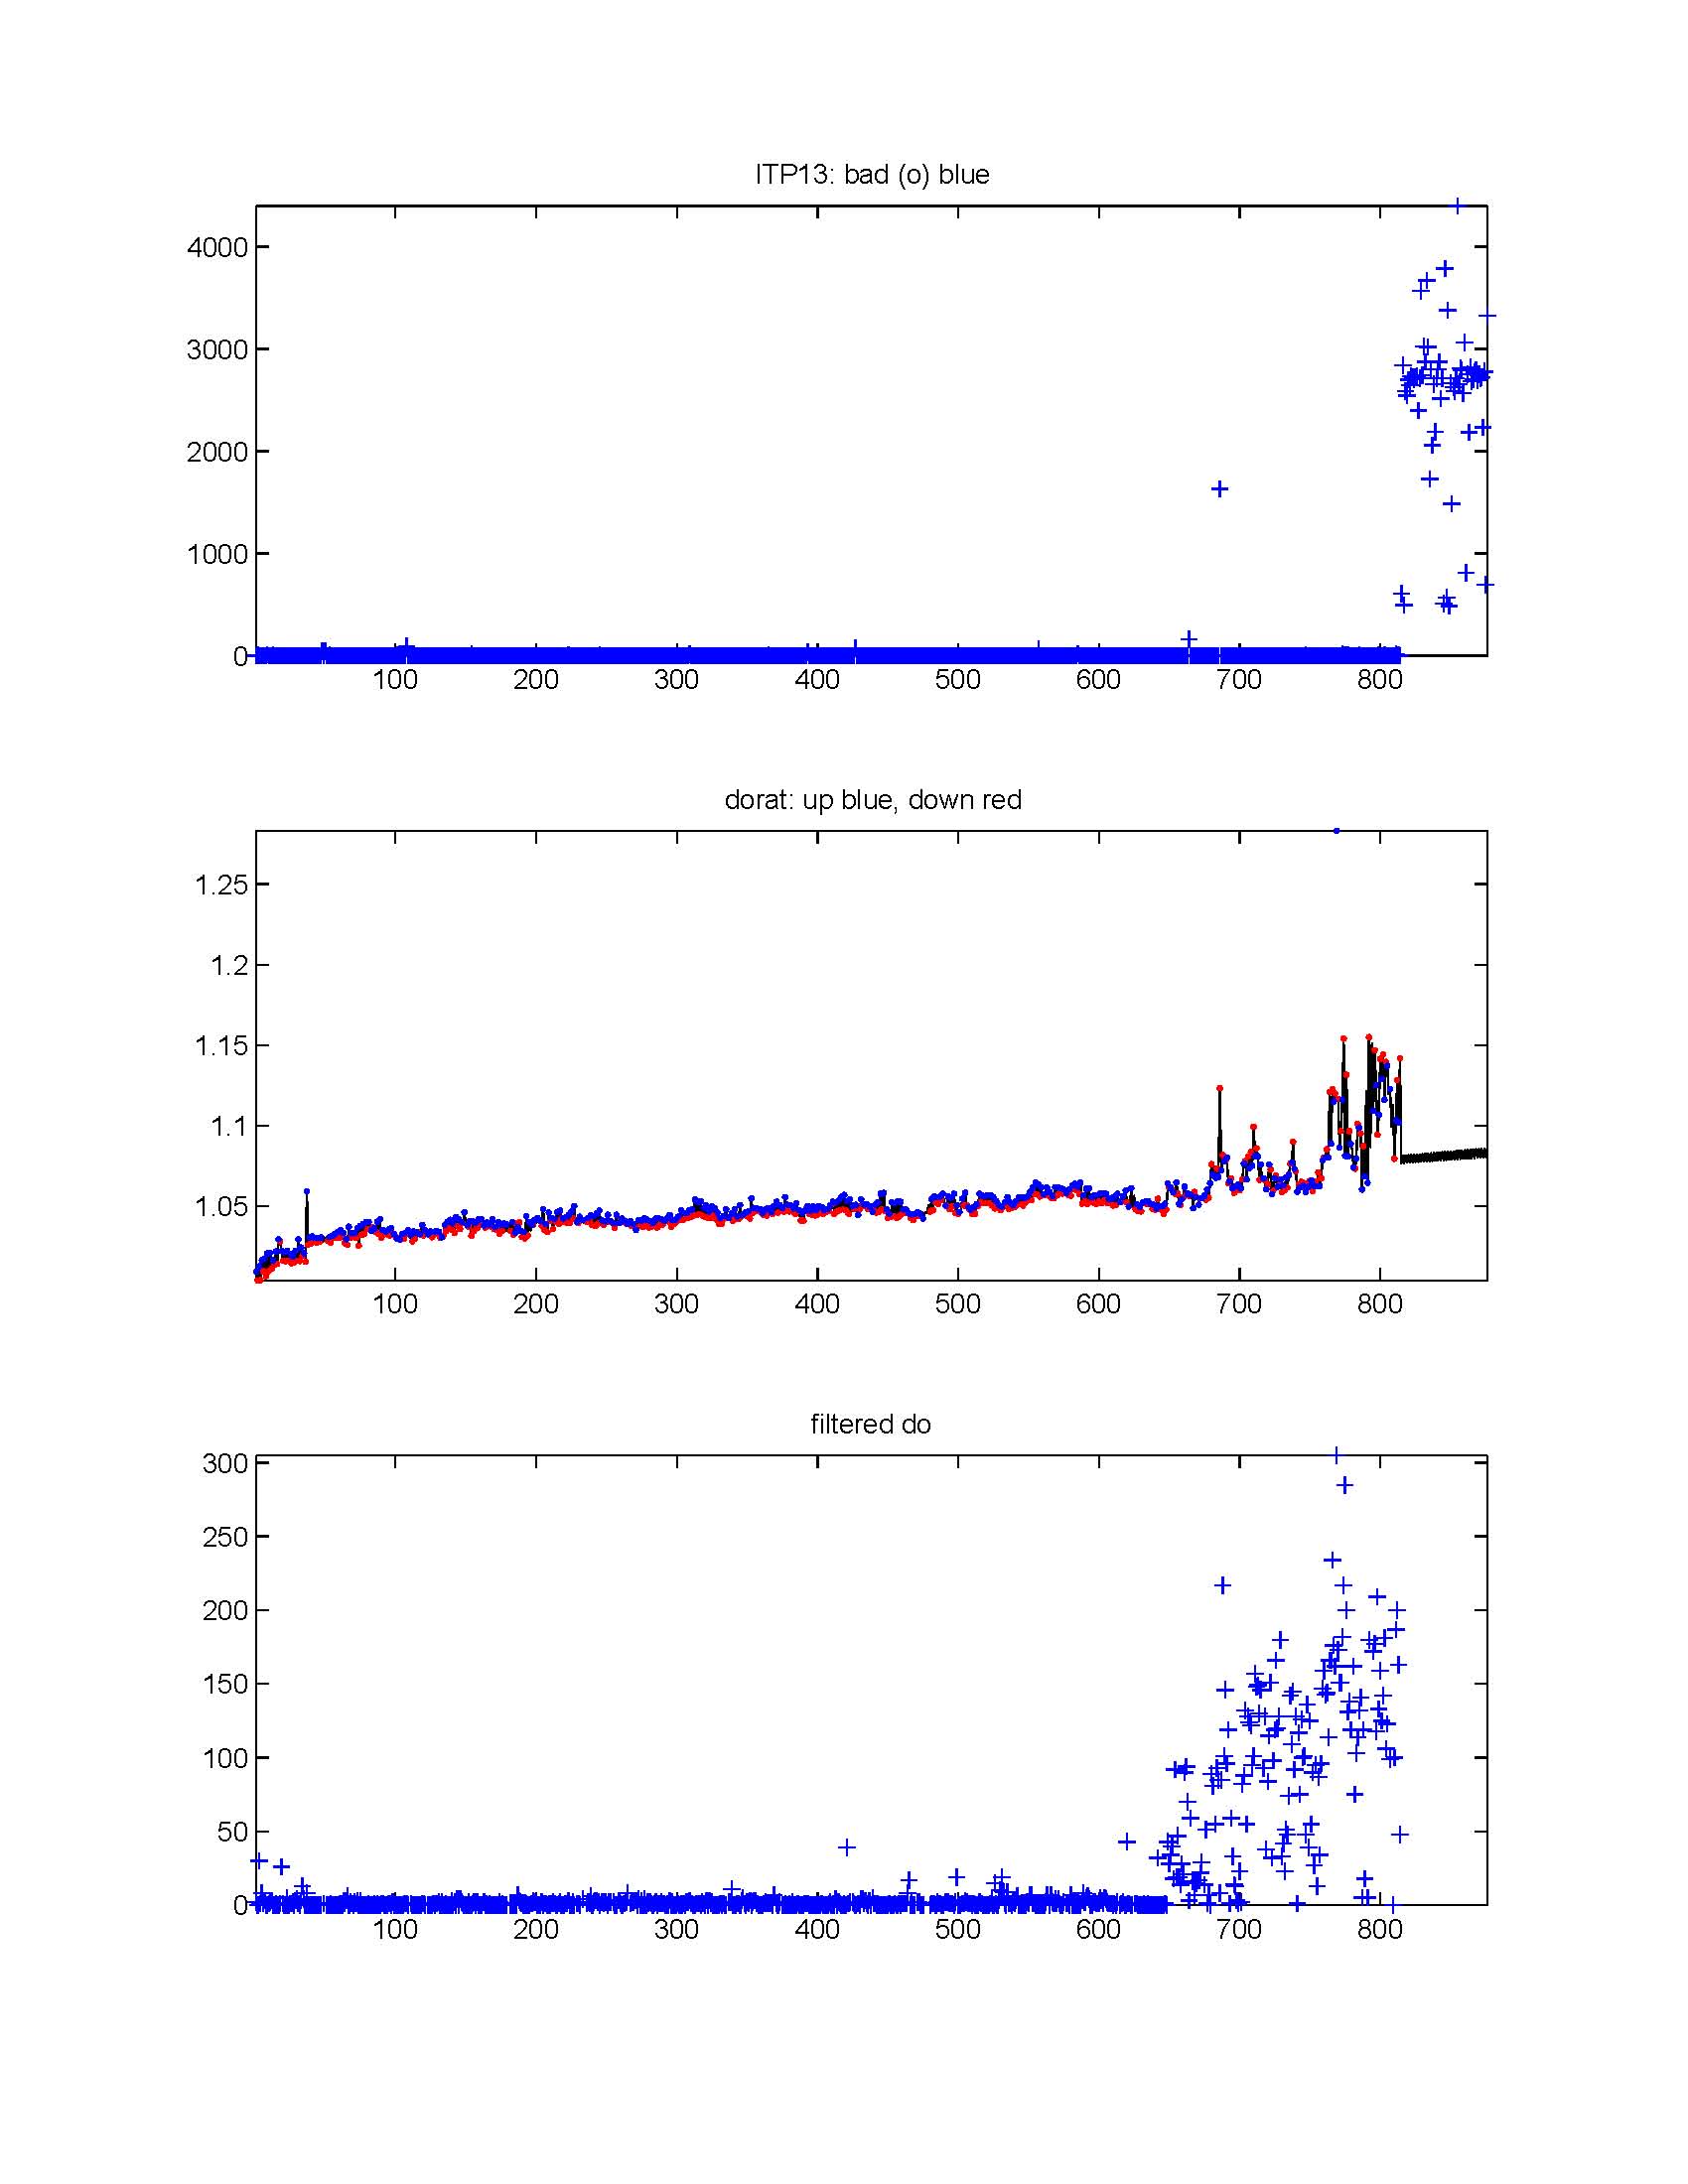
The 876 profiles that were recovered from the ITP were processed according to the procedures described in the ITP Data Processing Procedures. The processing parameters (described in ITP Data Processing Procedures) for ITP 13 are shown in the figures to the right. Thermohaline staircases were present throughout most of the time series, allowing lags to computed throughout. The temperature and conductivity physical separation lags differ significantly from typical values from previous units, but not the conductivity thermal mass lags. This ITP also suffered from the software overflow bug inherent in the 2007 systems, and experienced 52 resets with complete loss of data for these profiles, and typically incomplete vertical coverage for the next subsequent profiles.
Profiles between 760 and 780 were acquired while the ITP was rapidly drifting over the western Canada Basin slope and have odd T-S shapes above and through the Atlantic Water layer. It is not clear that these particular profiles suffered from typical sensor fouling and could contain unique information, so while not consistently stable in density and of questionable quality, they are retained in the final data product.
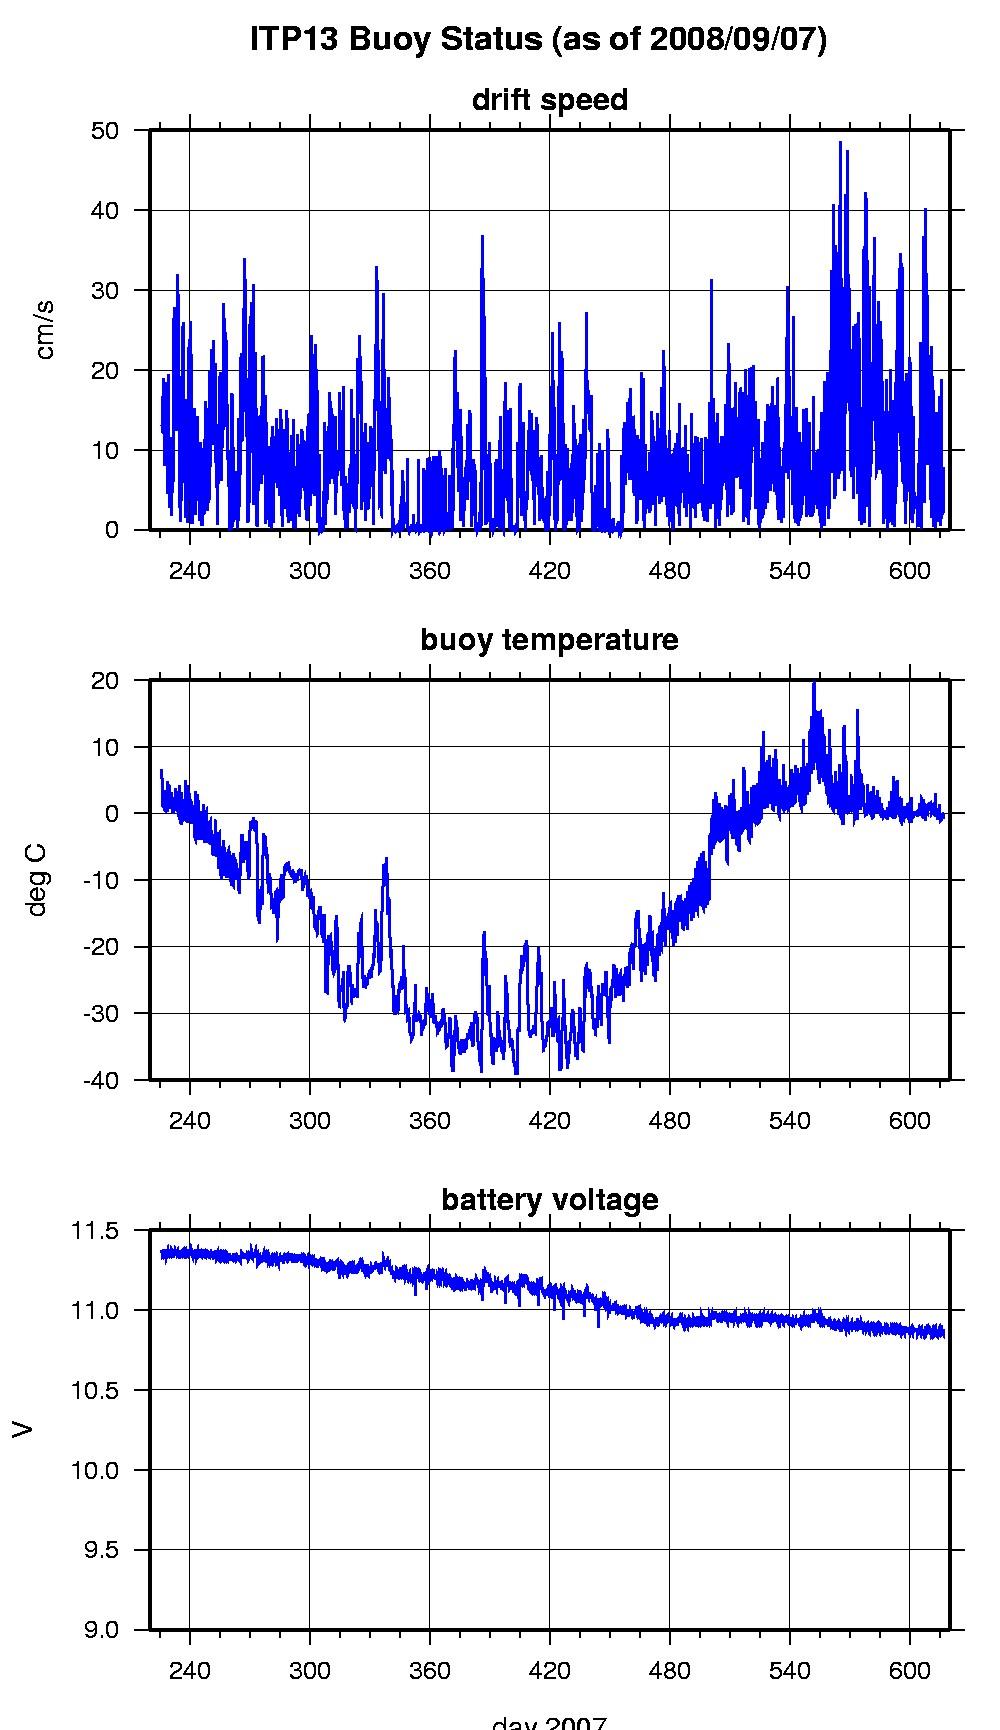
After profile 814, the system reached the Marginal Ice Zone, and indications are that it was released from the icefloe as the temperature of the surface package became that of the seawater and profiling motor currents became highly variable (presumably due to vertical motion of the mooring system due to wave action). From this time unreasonable lags are needed to correct the T & S data, as apparently the vertical motion and/or pumping problem smeared or seemingly delayed the rate of the seawater passing the sensors by 10s of seconds up to more than 2 minutes (compared to 0.5 second typical lag). The error remaining in these profiles appeared to be so large even after applying the mega-lag corrections, that they were removed from the final dataset.
See the Data Products tab to the left for descriptions of the three levels (I, II, III) of data processing and to access all data.
