ITP 6 Data Processing
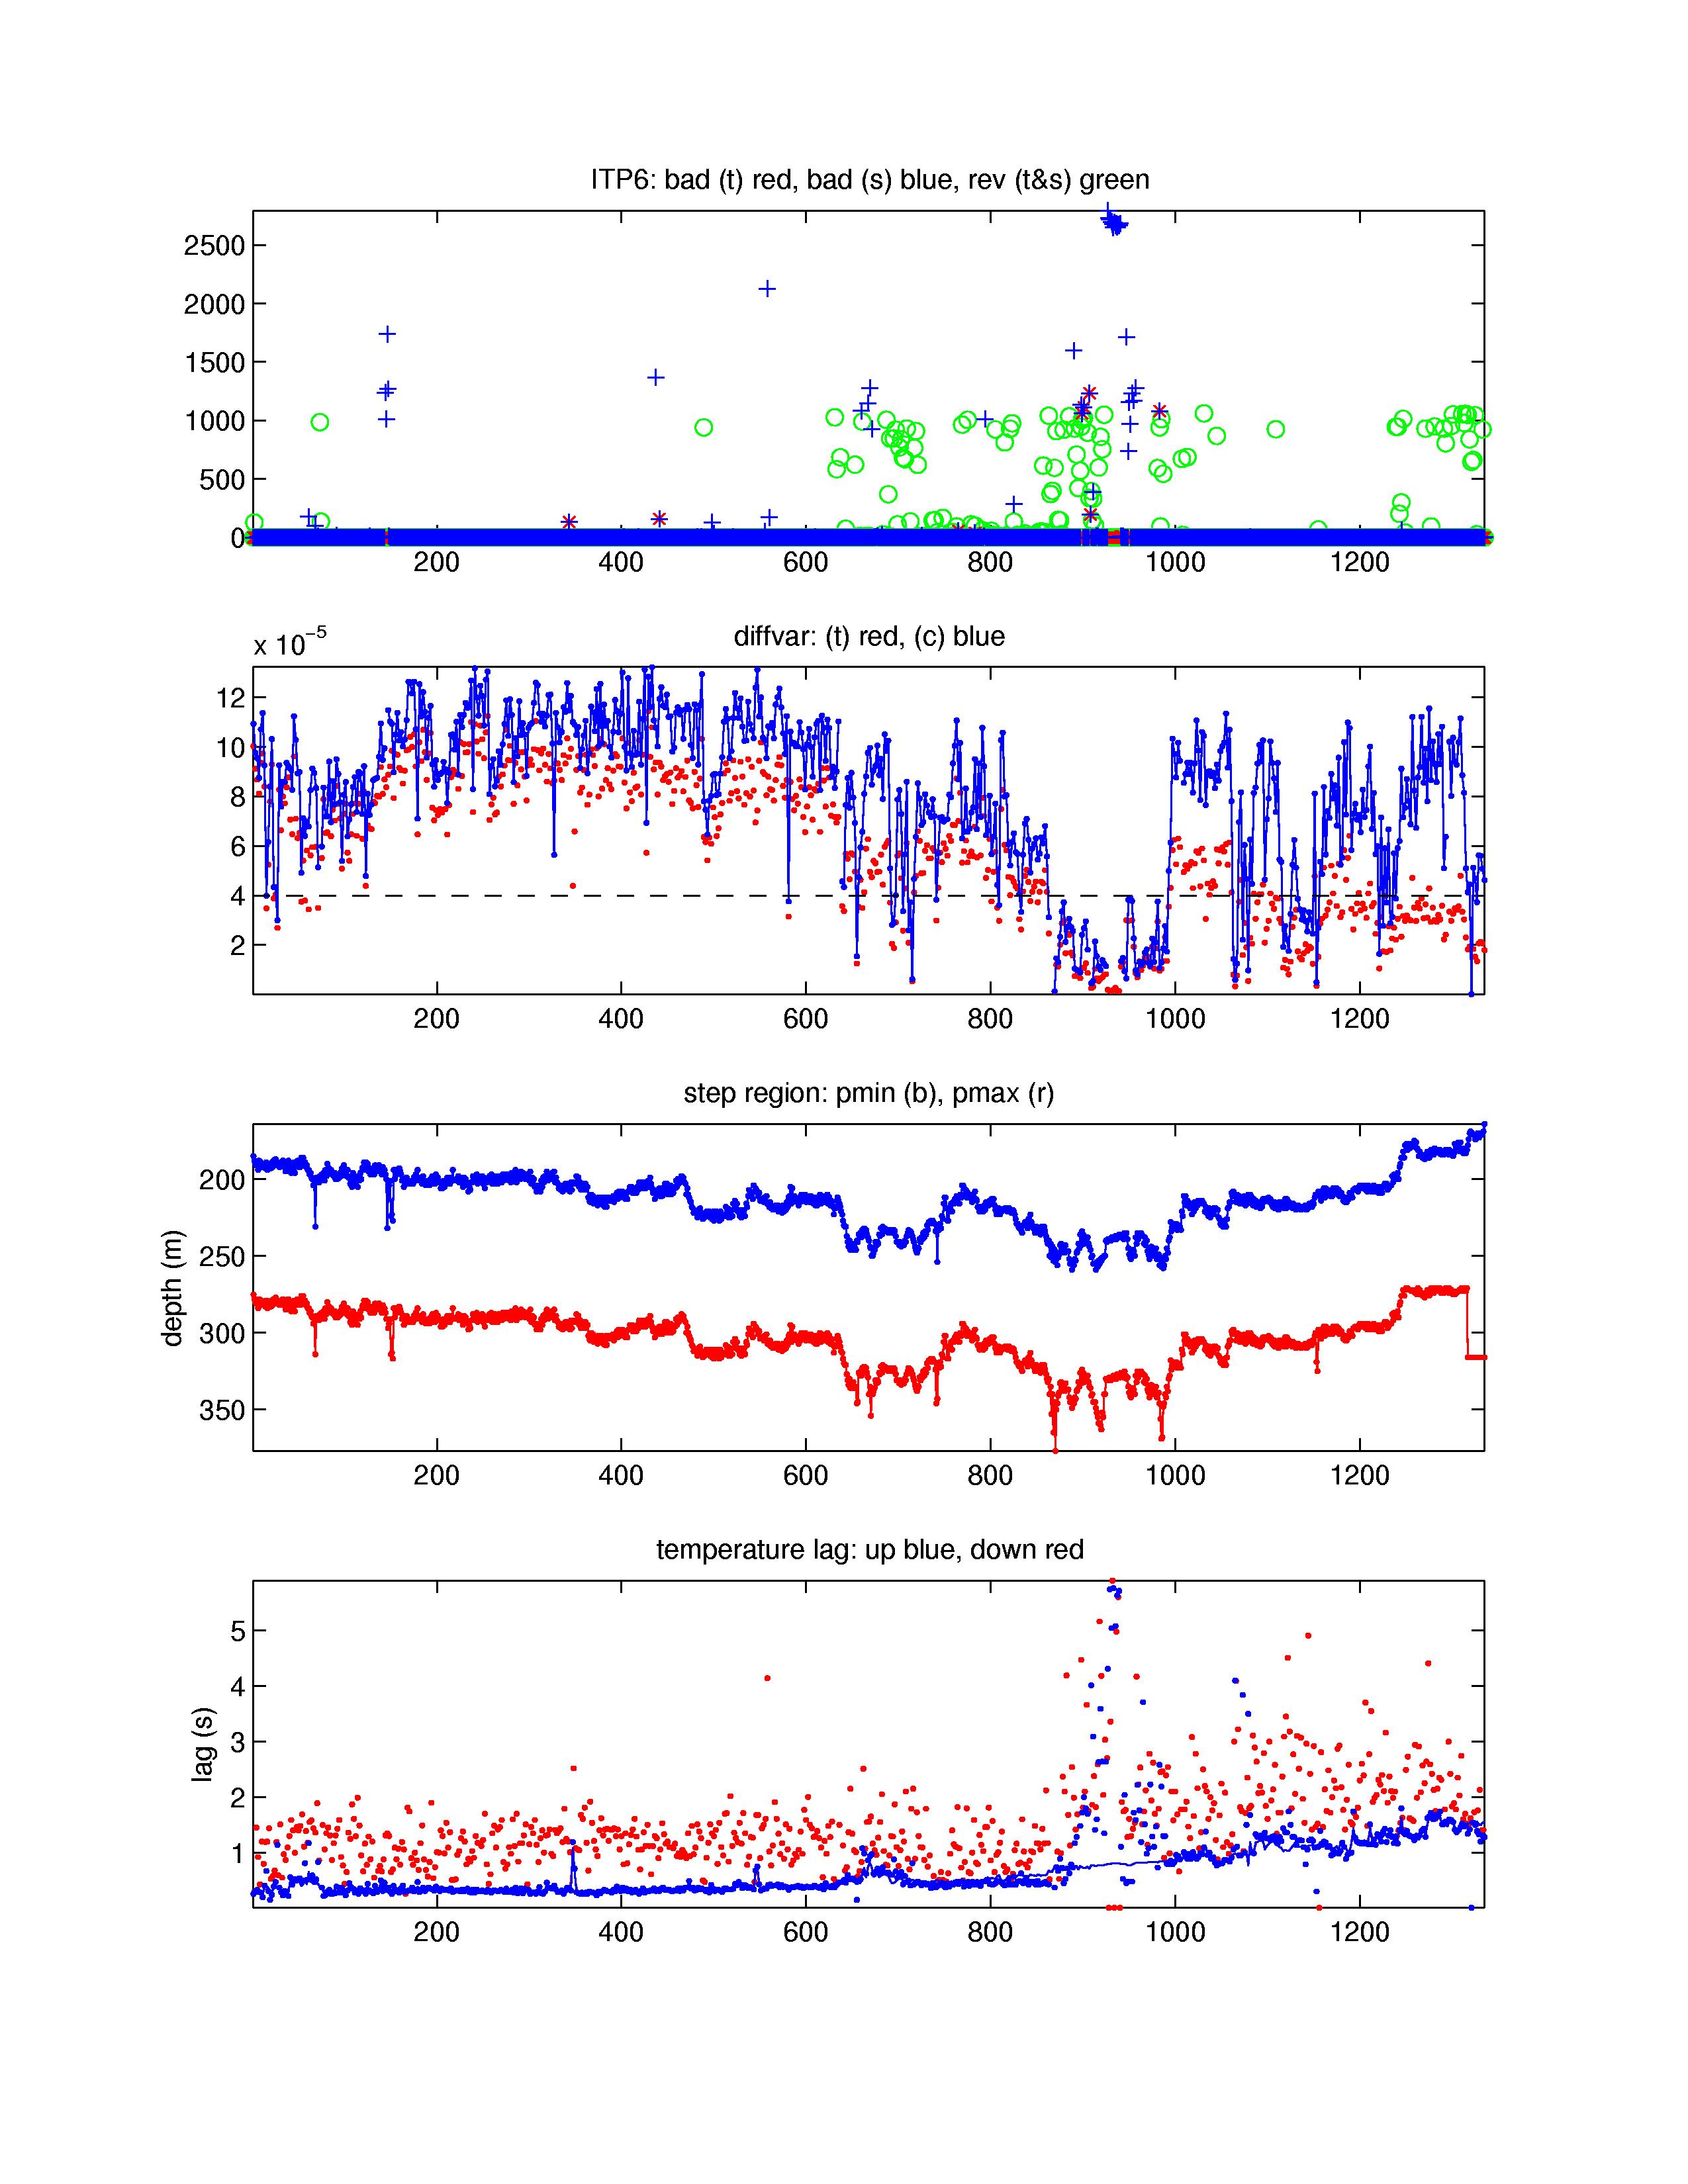
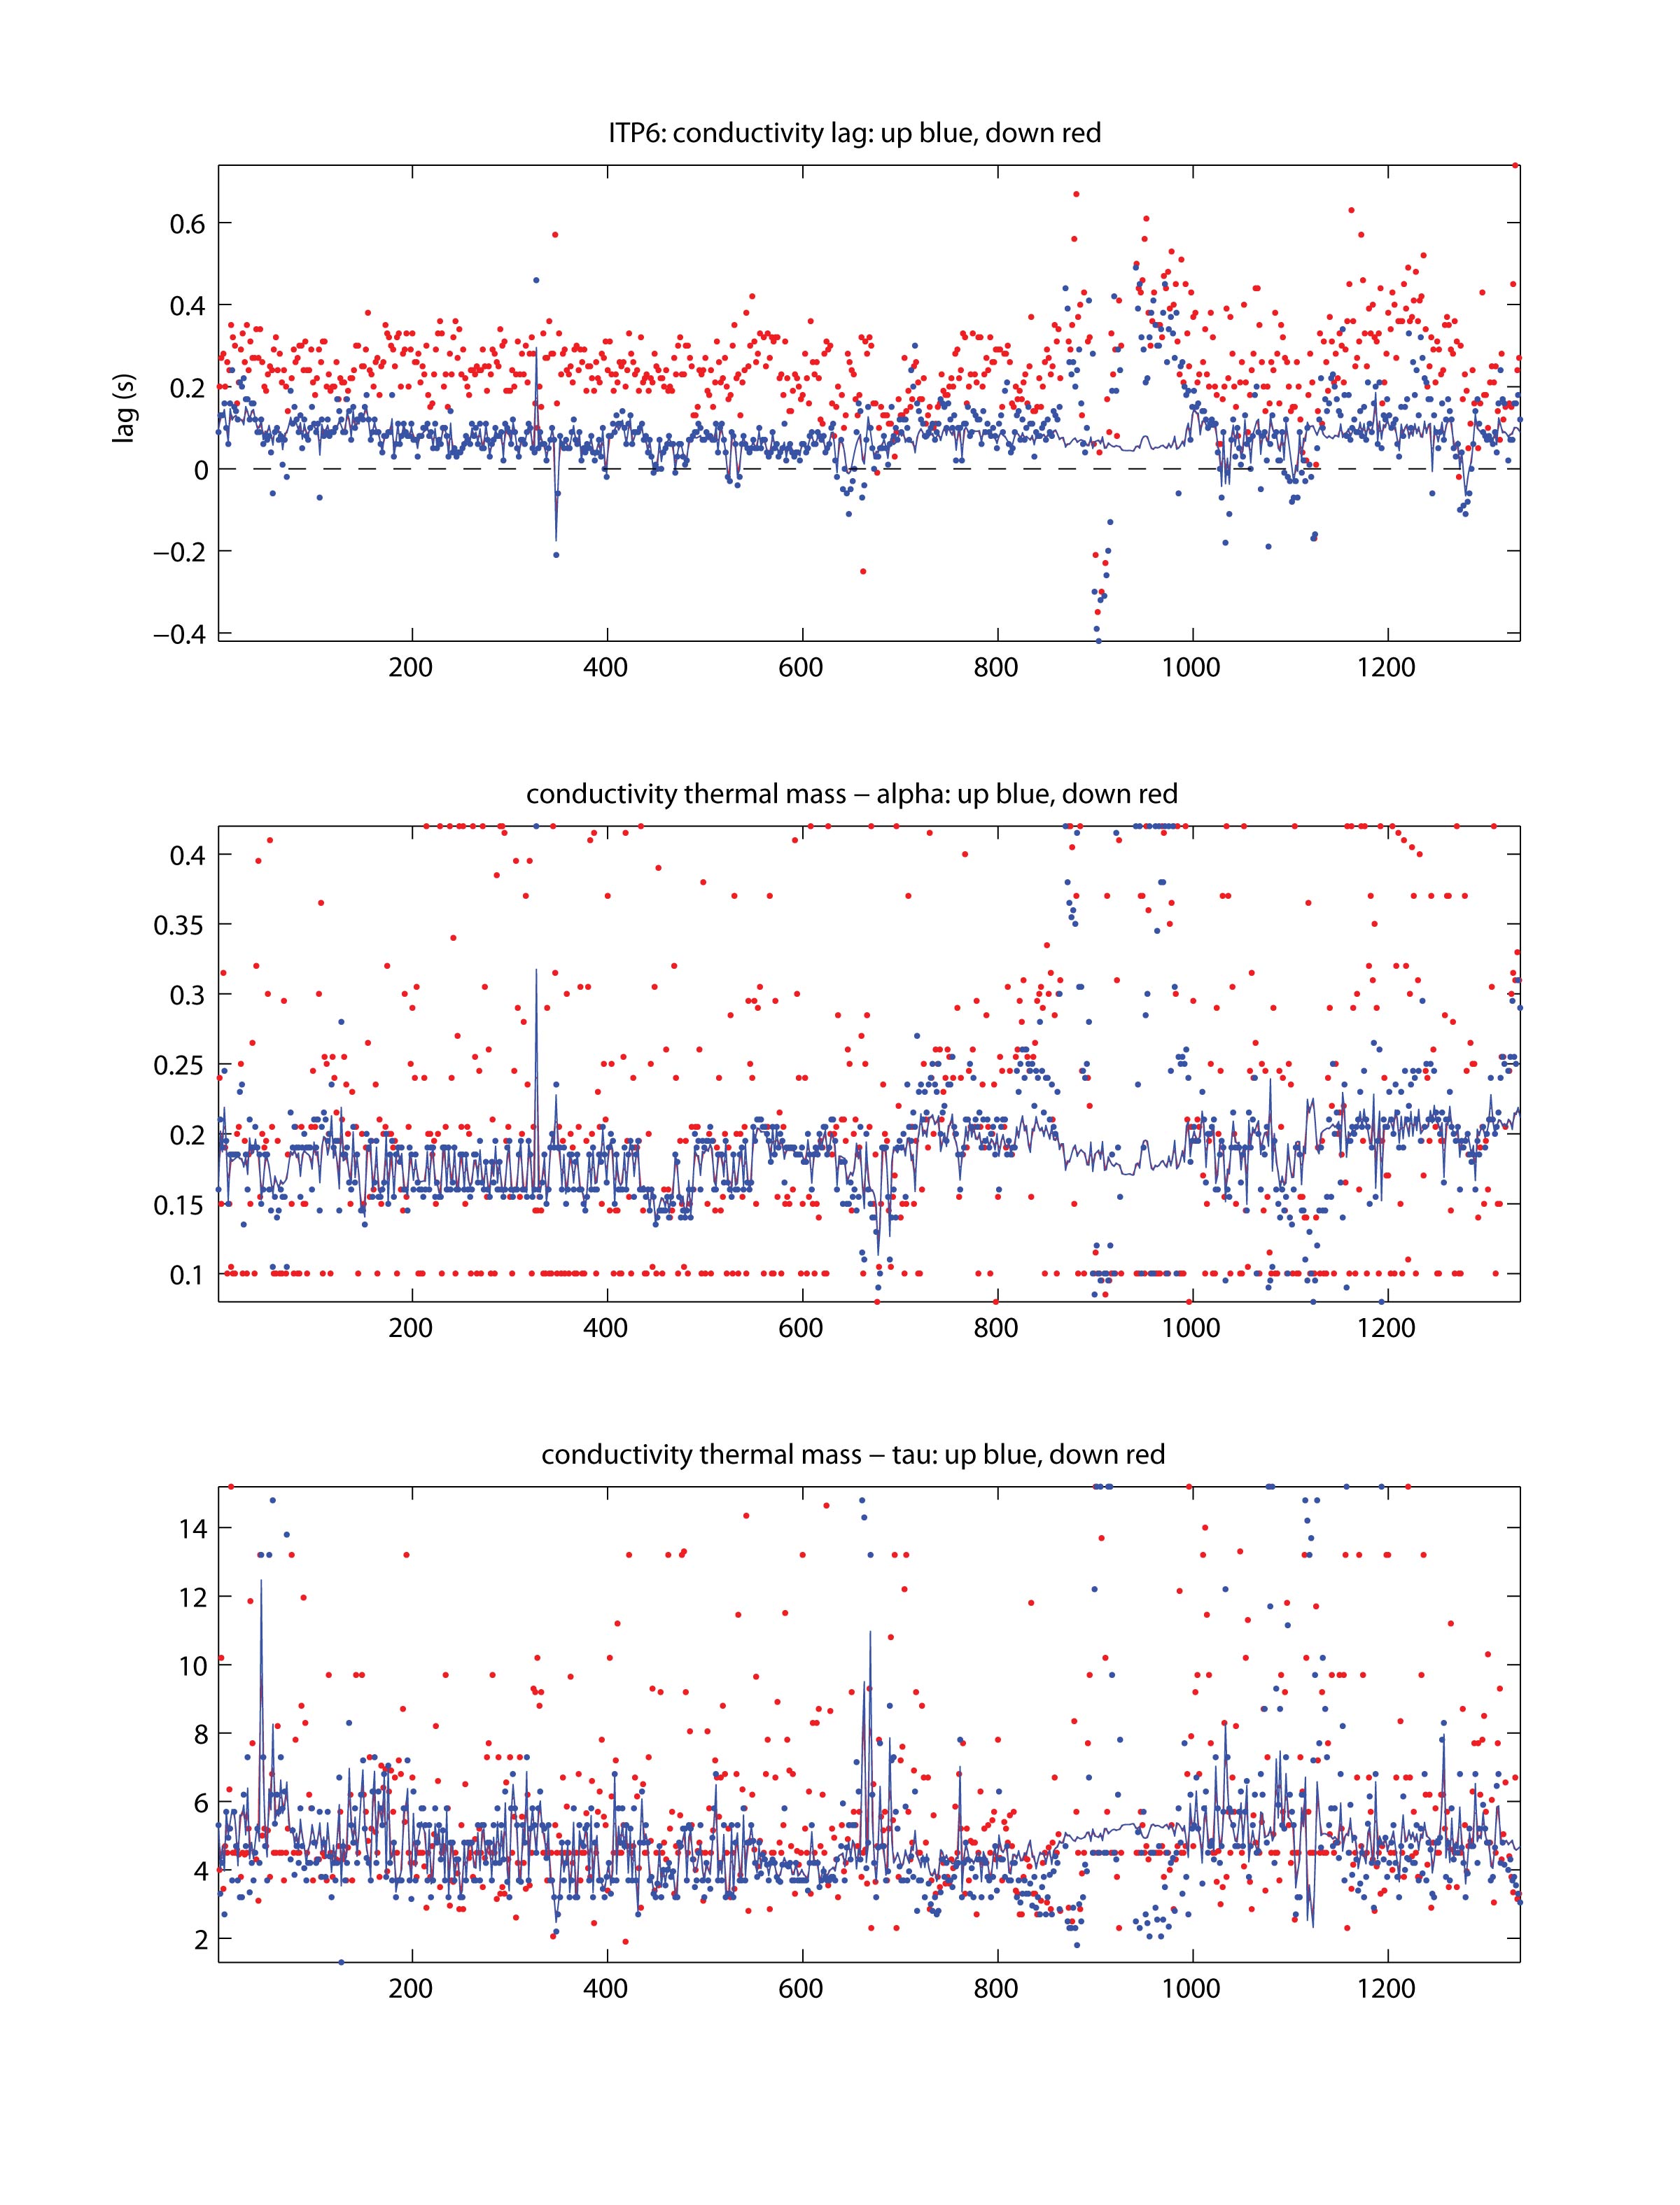
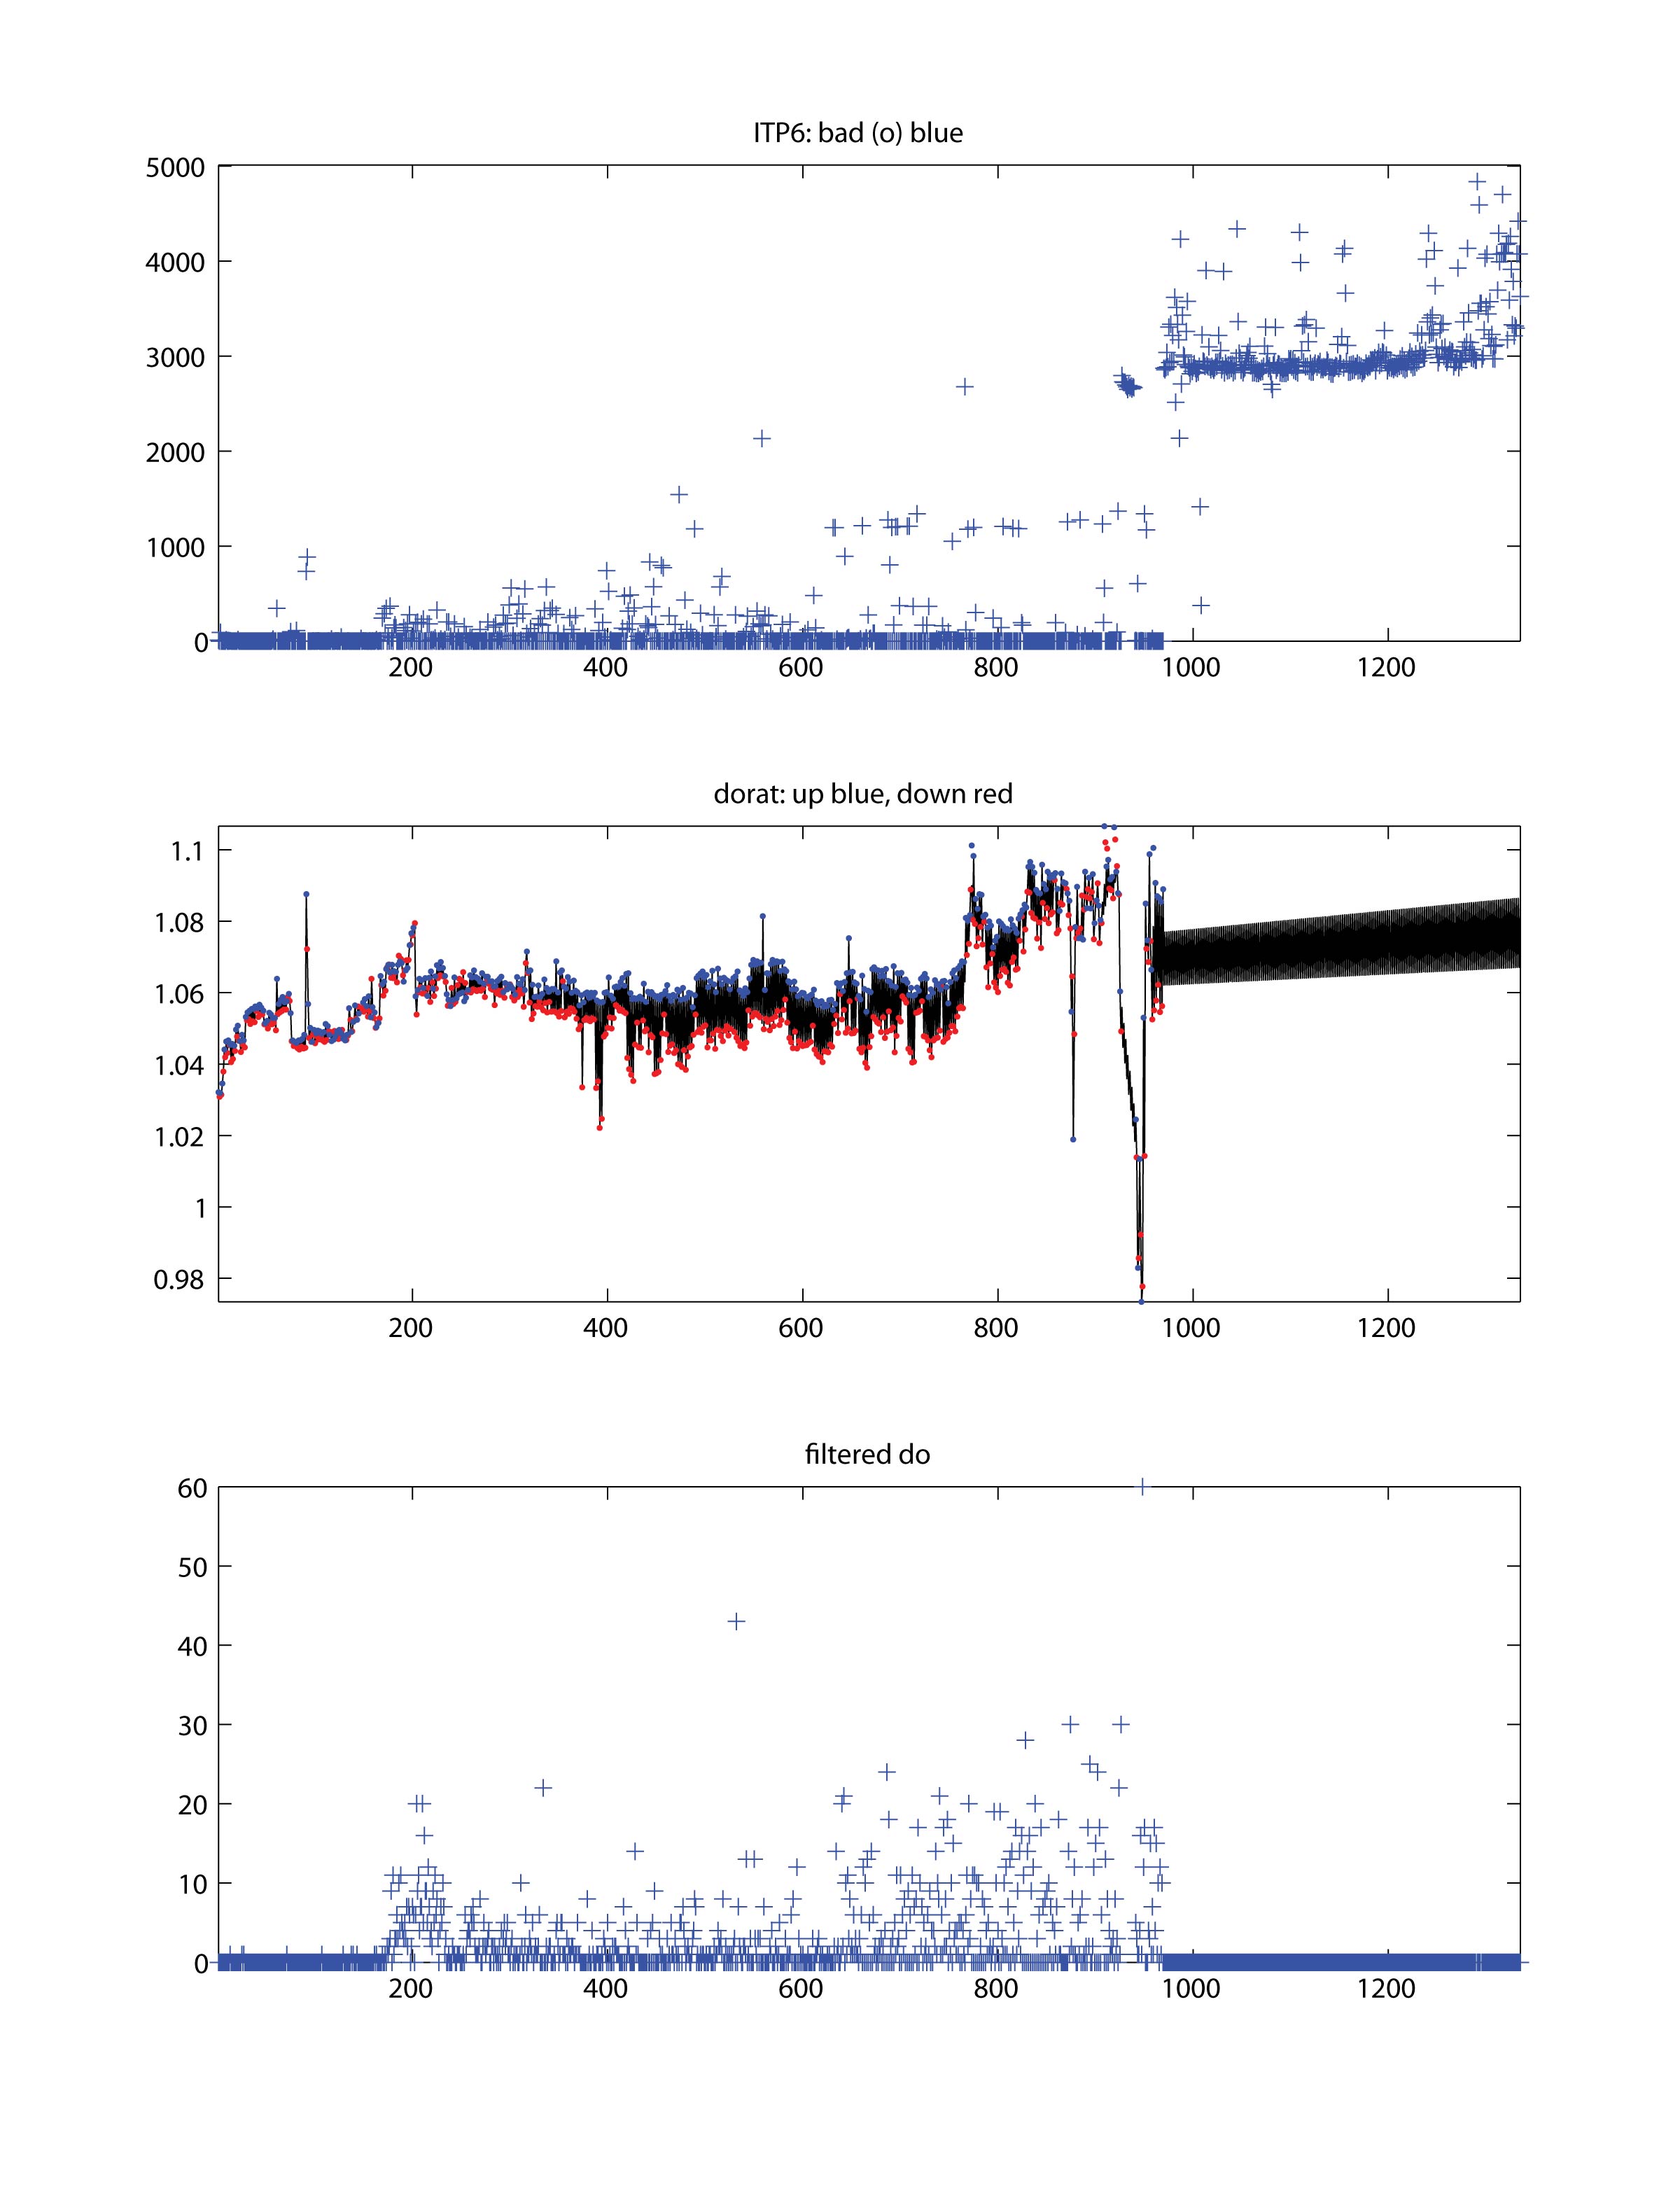
The 1335 profiles that were transmitted from the ITP were processed according to the procedures described in the ITP Updated Data Processing Procedures. Beginning with ITP 6 several new processing procedures were implemented to refine the output product and to handle the added information provided by the dissolved oxygen sensor (when incorporated on CTD sensor package). The processing scheme for the oxygen parallels the processing of the salinity data, including a calibration procedure to tie deep oxygen values to climatological values to remove profile-to-profile variations.
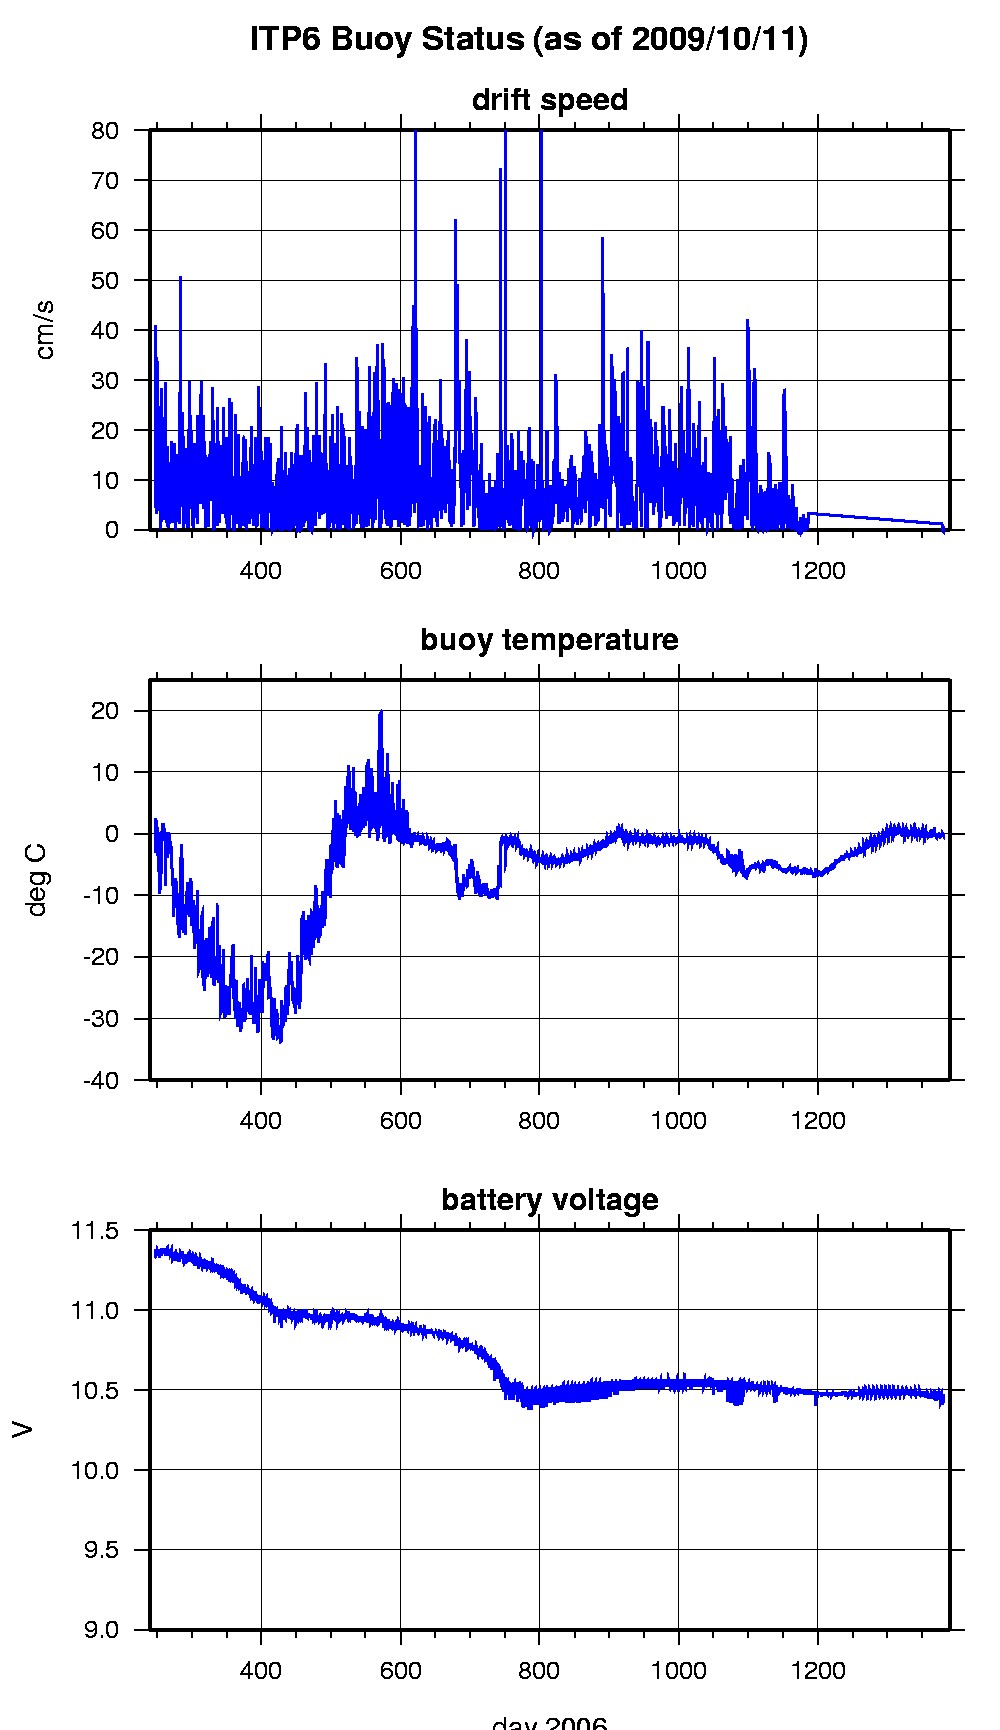
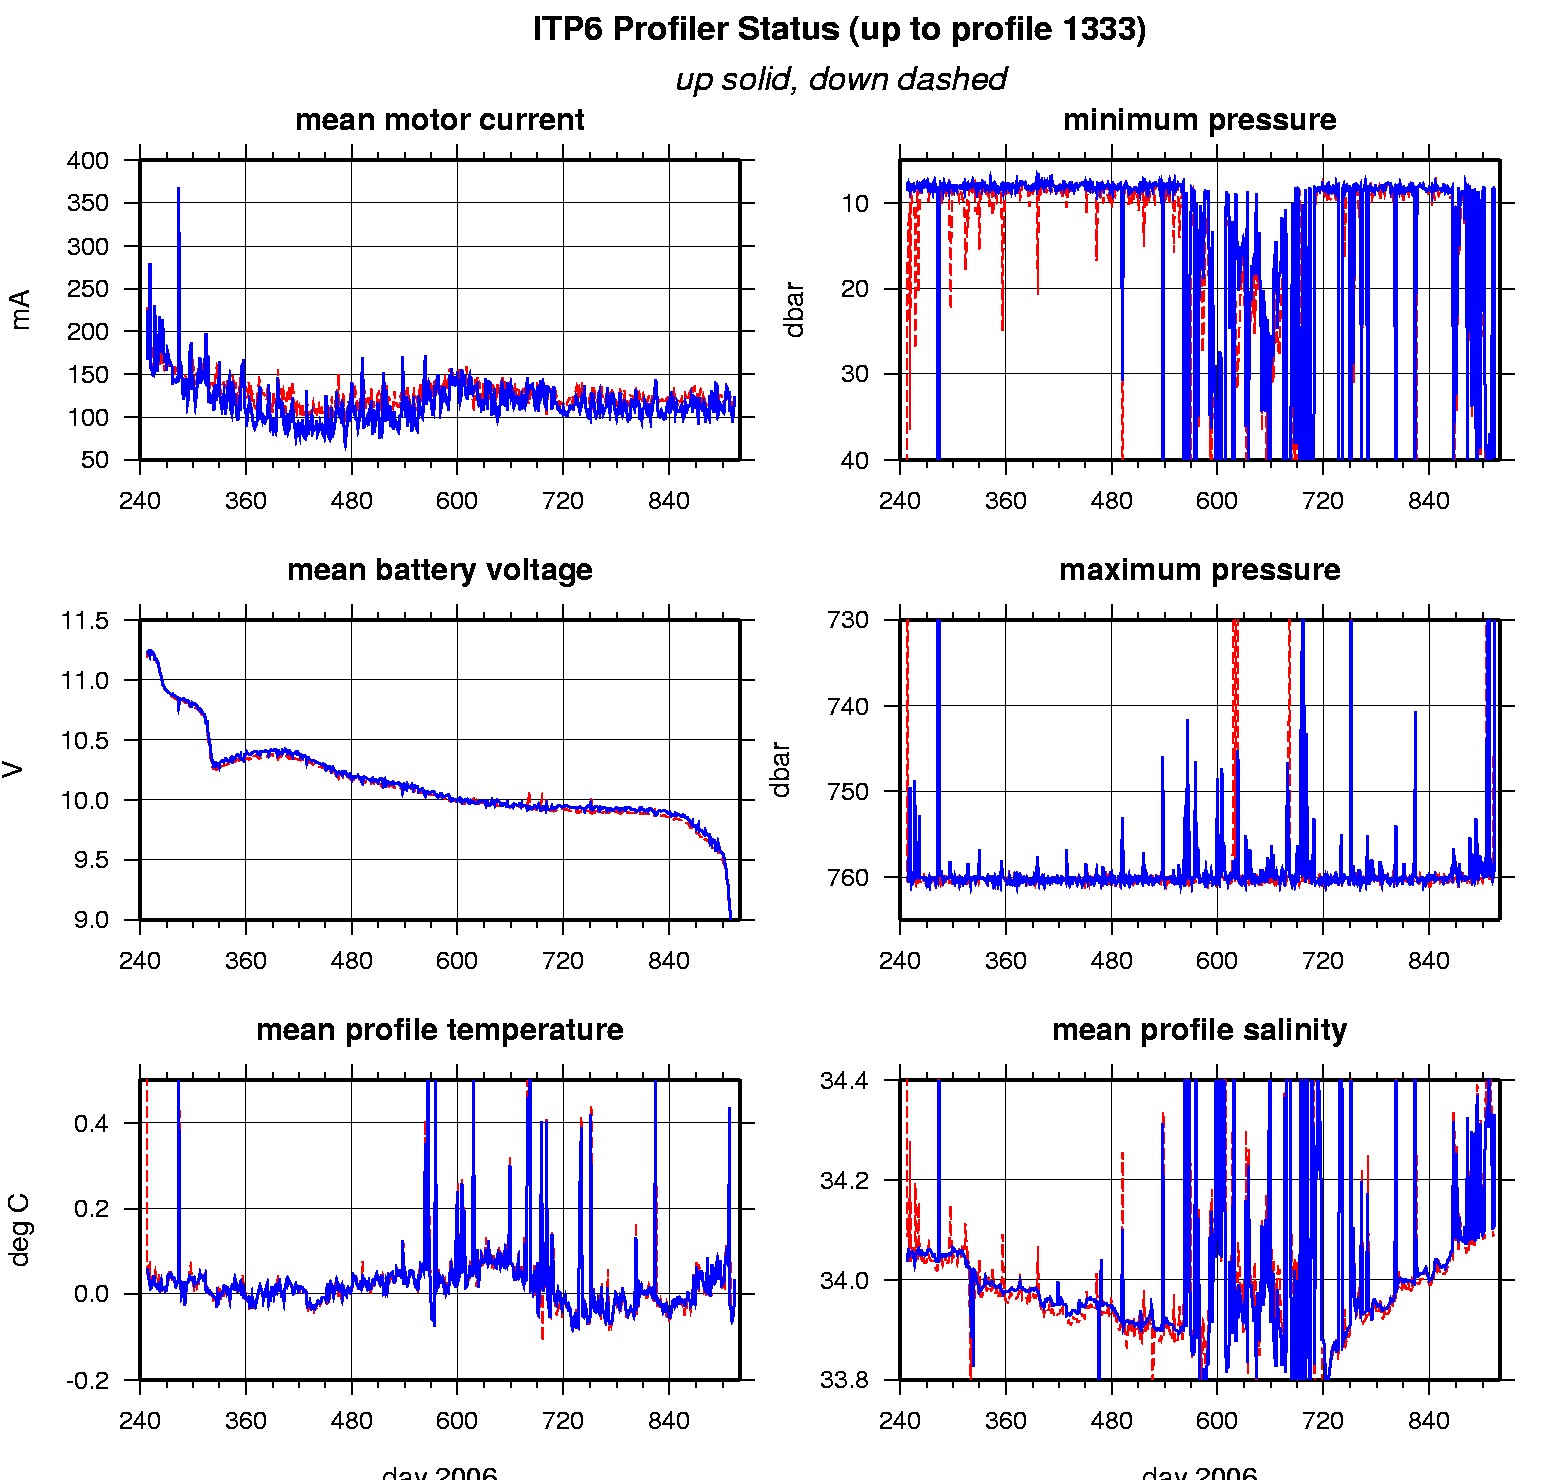
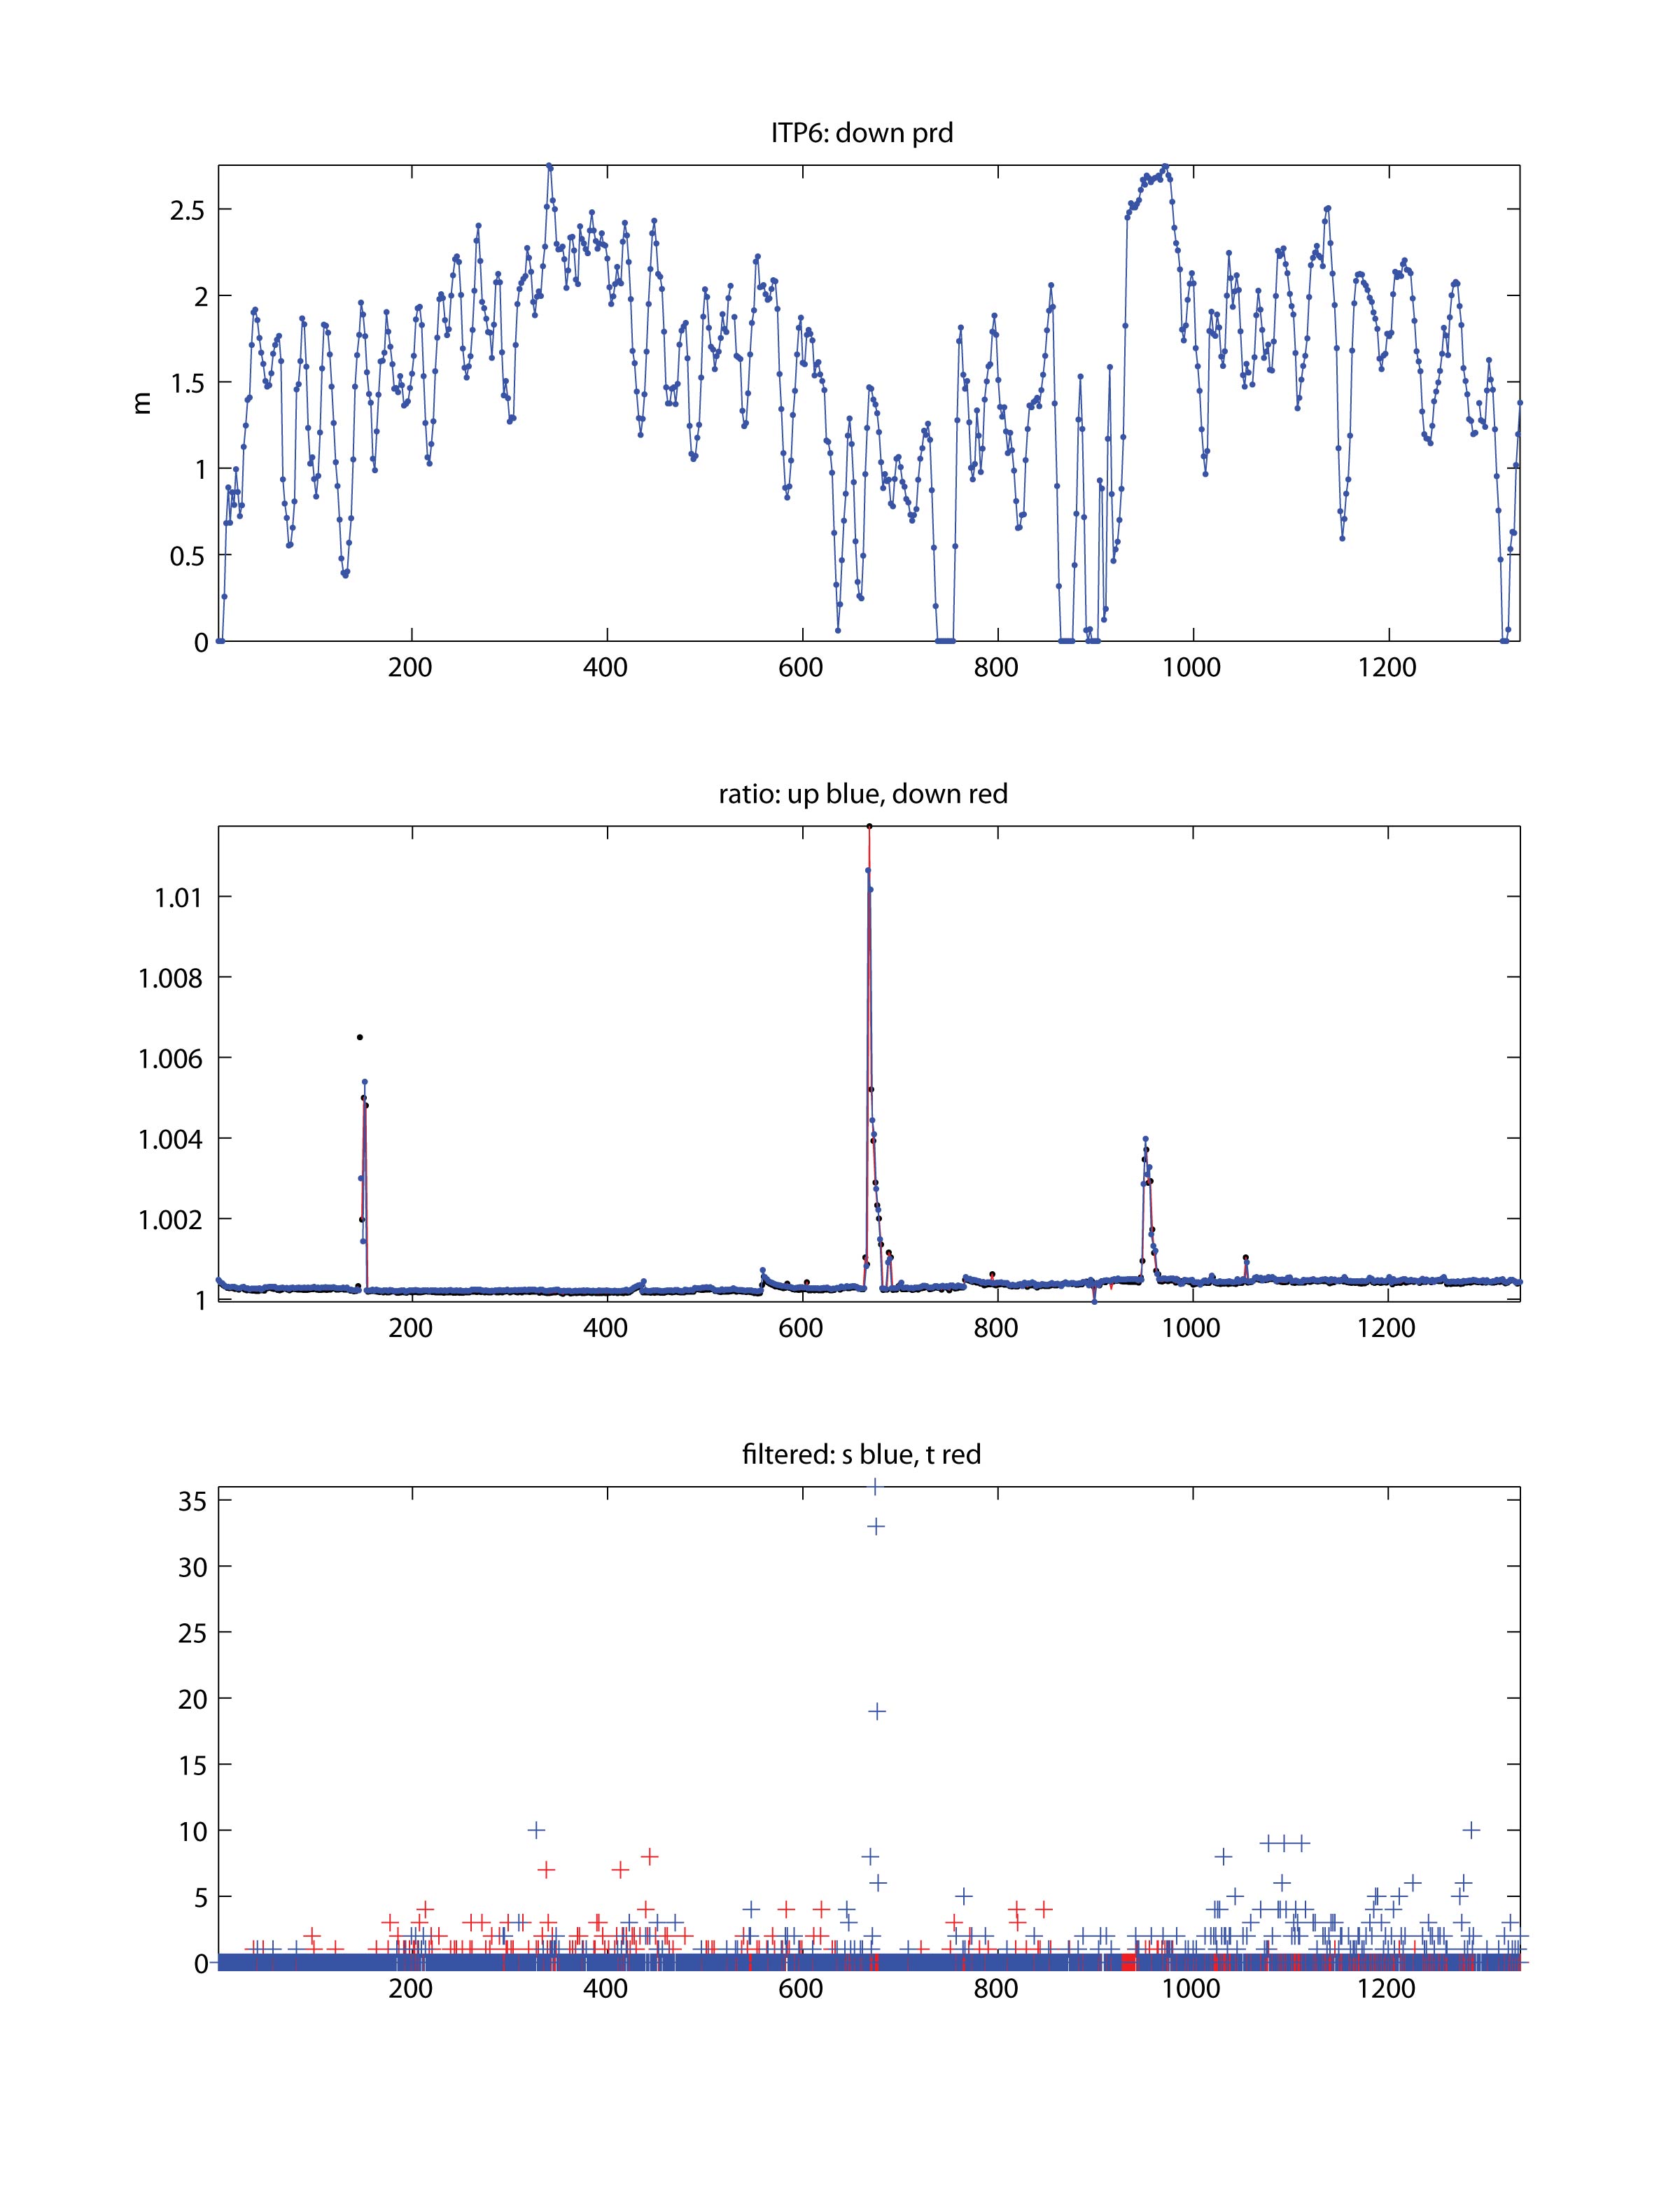
During the first year, the ITP returned predominantly uncontaminated full profiles of temperature, conductivity and oxygen (although the oxygen data contained numerous spikes throughout). During the second year, instances when the profiler could not climb, or reversed and retried were common. Over 98% of the profiles ranged greater than 500 m vertically, but 5% less were able to profile more than 700 m. The large majority of stoppages occurred near the top of up profiles between 600 and 1000 (while the surface buoy was pushed under the ice) and at the end of the record after 1200 until the battery expired on profile 1335. Profiles 528 and 1059 did not arrive with profiler engineering data (no timecode). A comparable number of bad points due to suspected biofouling or sensor icing are removed as in previous ITPs, however slightly more (over 1%) were completely corrupted (profiles 927 through 940) so were eliminated from the final data. An extensive amount of effort was applied to manually remove bad data in the dissolved oxygen measurements, which included a substantial amount of spikes, perhaps due to a greater sensitivity to fouling. The final product still includes some sensor noise, and there is no useful dissolved oxygen data after profile 969.
See the Data Products tab to the left for descriptions of the three levels (I, II, III) of data processing and to access all data.
