ITP 069 Data Description
The ITP profiler was configured to operate on a pattern profiling schedule with different summer and winter schedules. In the summer (between deployment and October 31, and after the following March 1), the instrument conducted a 1.5 day repeating pattern of an up profile from 750 to 7 m, followed by 4 one-way (down, up, down, up) profiles between 7 and 200 m, followed by a down profile from 7 to 750 m, all spaced 6 hours apart. In the winter (after November 1), the instrument conducted a 3 day repeating pattern of an up profile from 750 to 7 m, followed 6 hours later by a down profile from 7 to 200 m, followed 24 hours later by an up profile from 200 to 7 m, followed 6 hours later by a down profile from 7 to 750 m, followed by a 36 hour gap before the pattern repeated. The complicated scheme was designed to conserve battery power to extend the lifetime of the instrument, while maximizing the acquisition of the bio-optical data during the summer months. In the surface package, the GPS receiver was powered hourly to obtain locations hourly, and buoy temperature and battery voltage status were recorded.
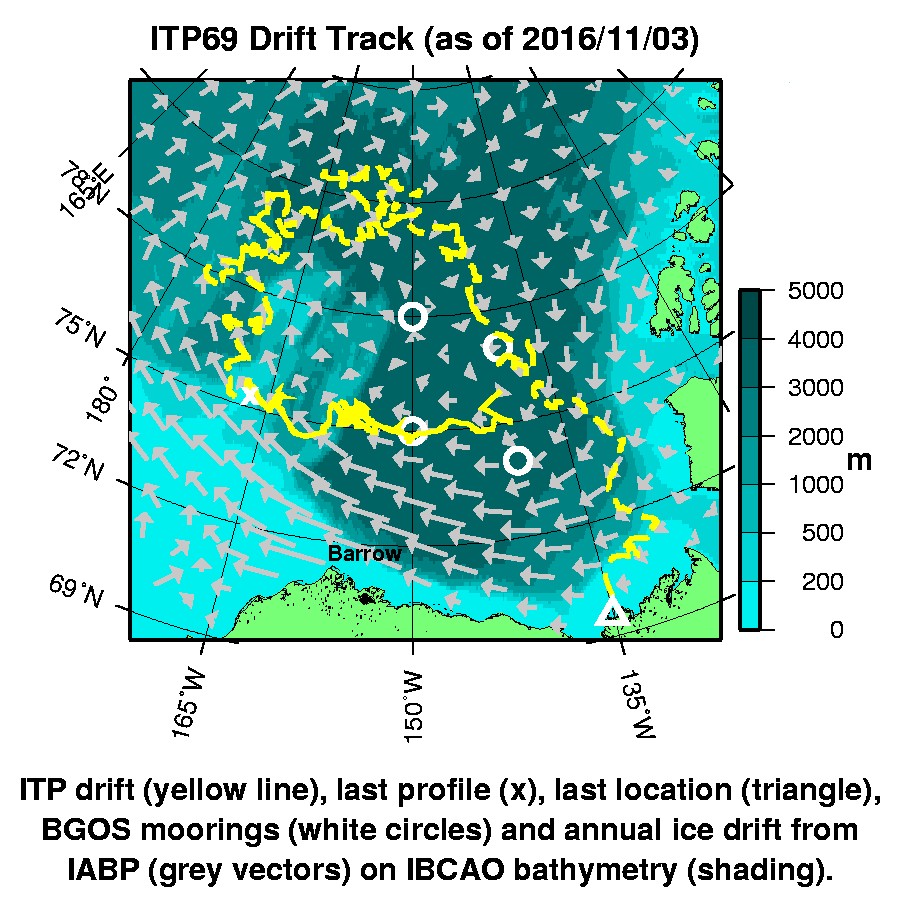
The ITP drifted generally westward after being deployed, over the Northwind Ridge and over the Chukchi escarpment where the mooring apparently dragged and the profiler was lost on March 12, 2014. The surface unit continued drifting in a large clockwise loop, eventually grounding near the MacKenzie River delta.
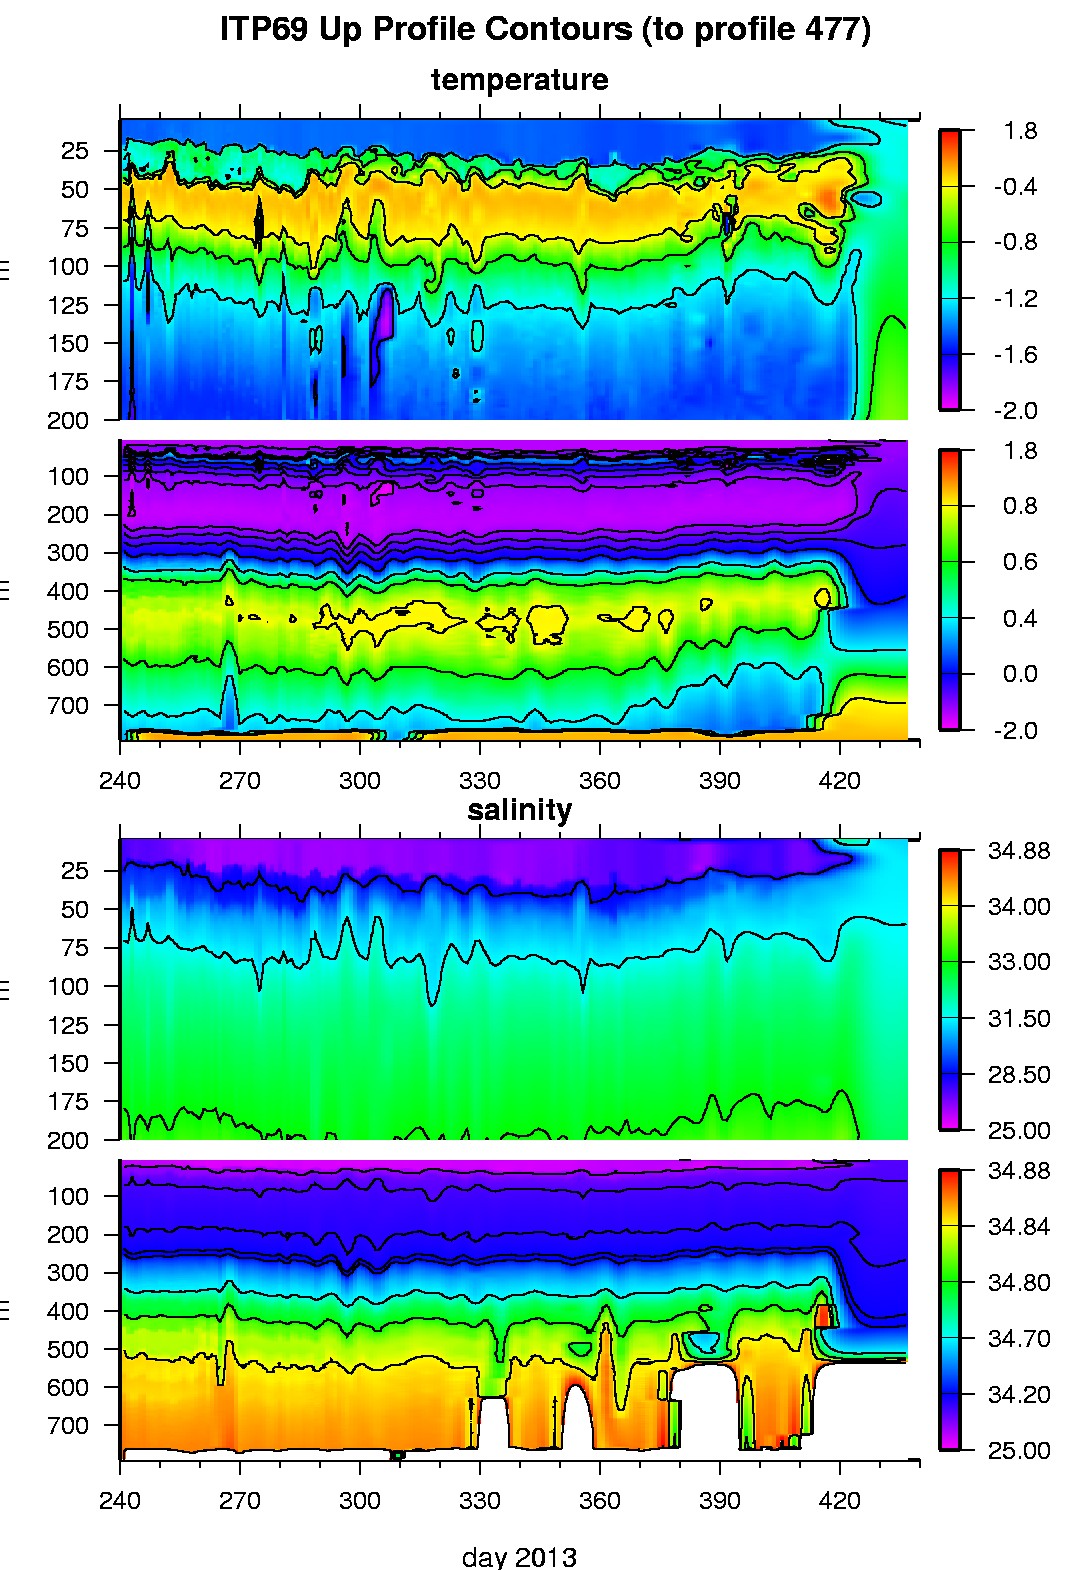
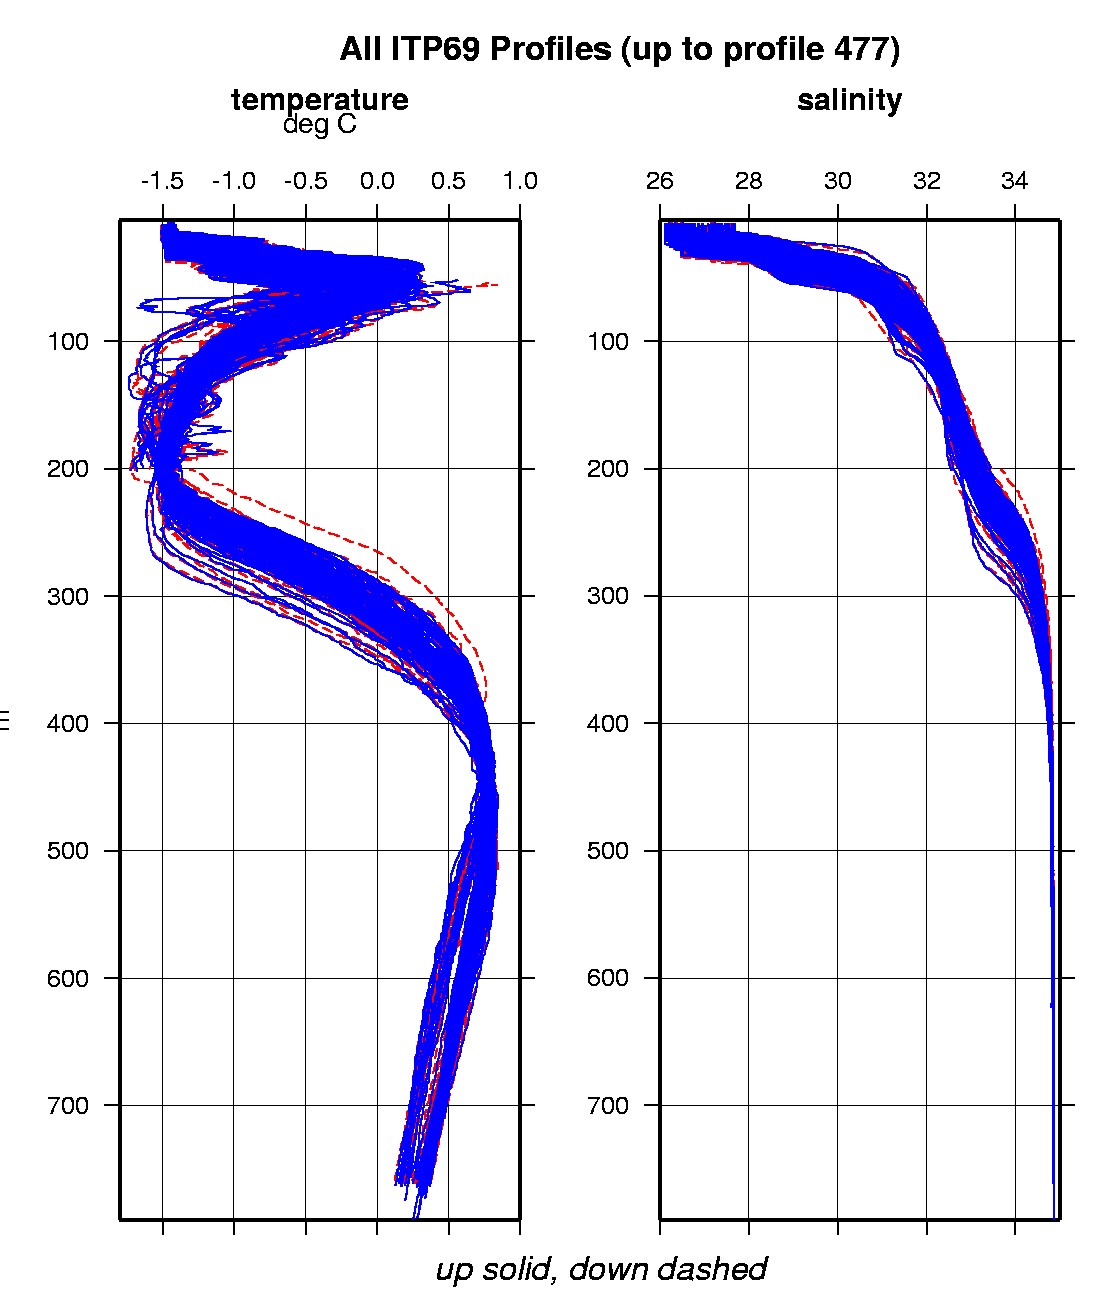
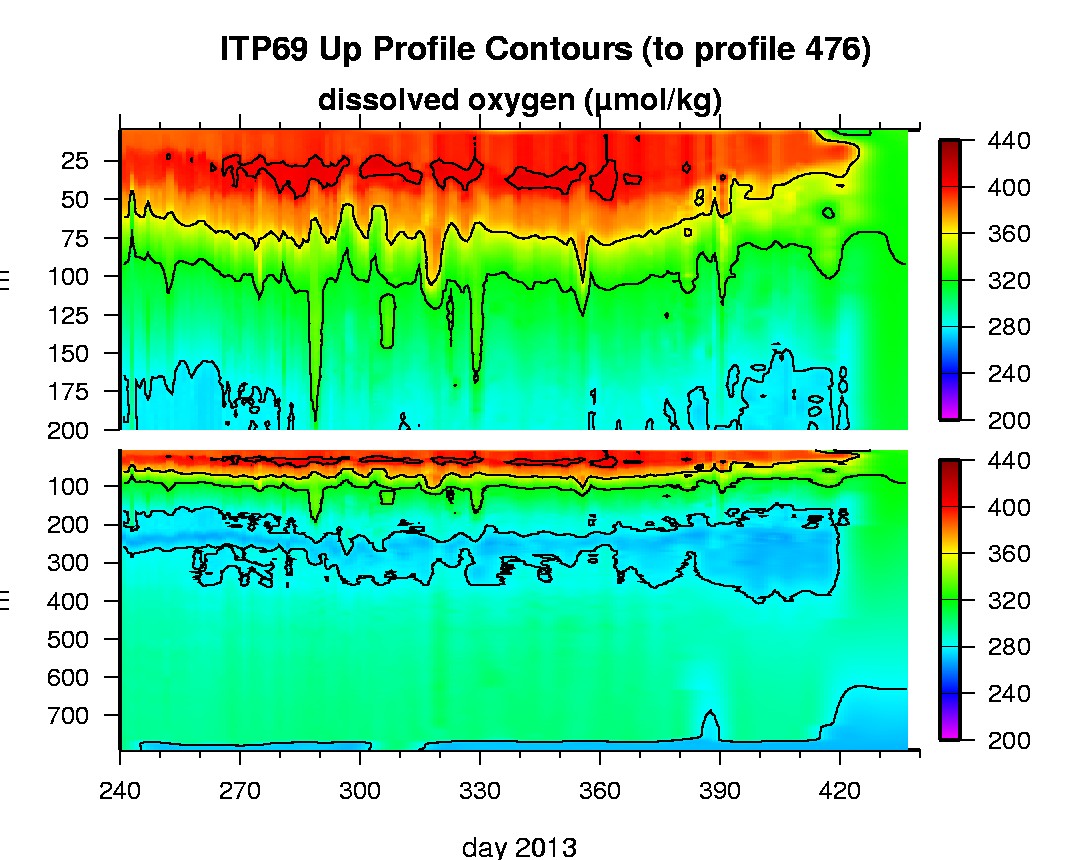
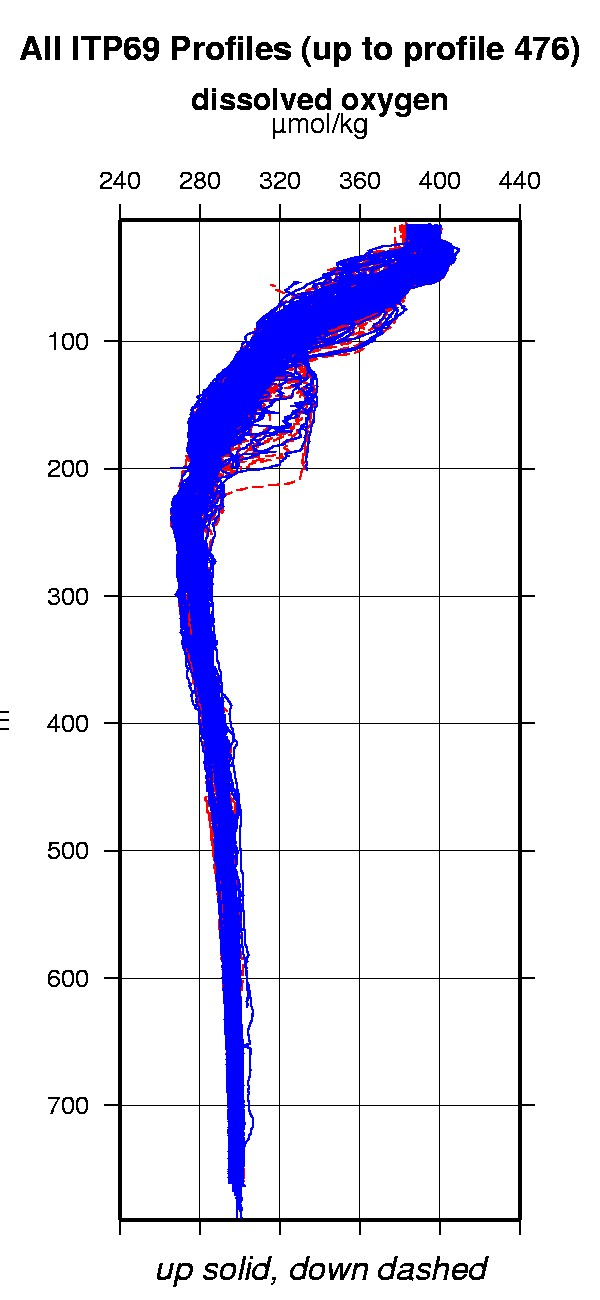
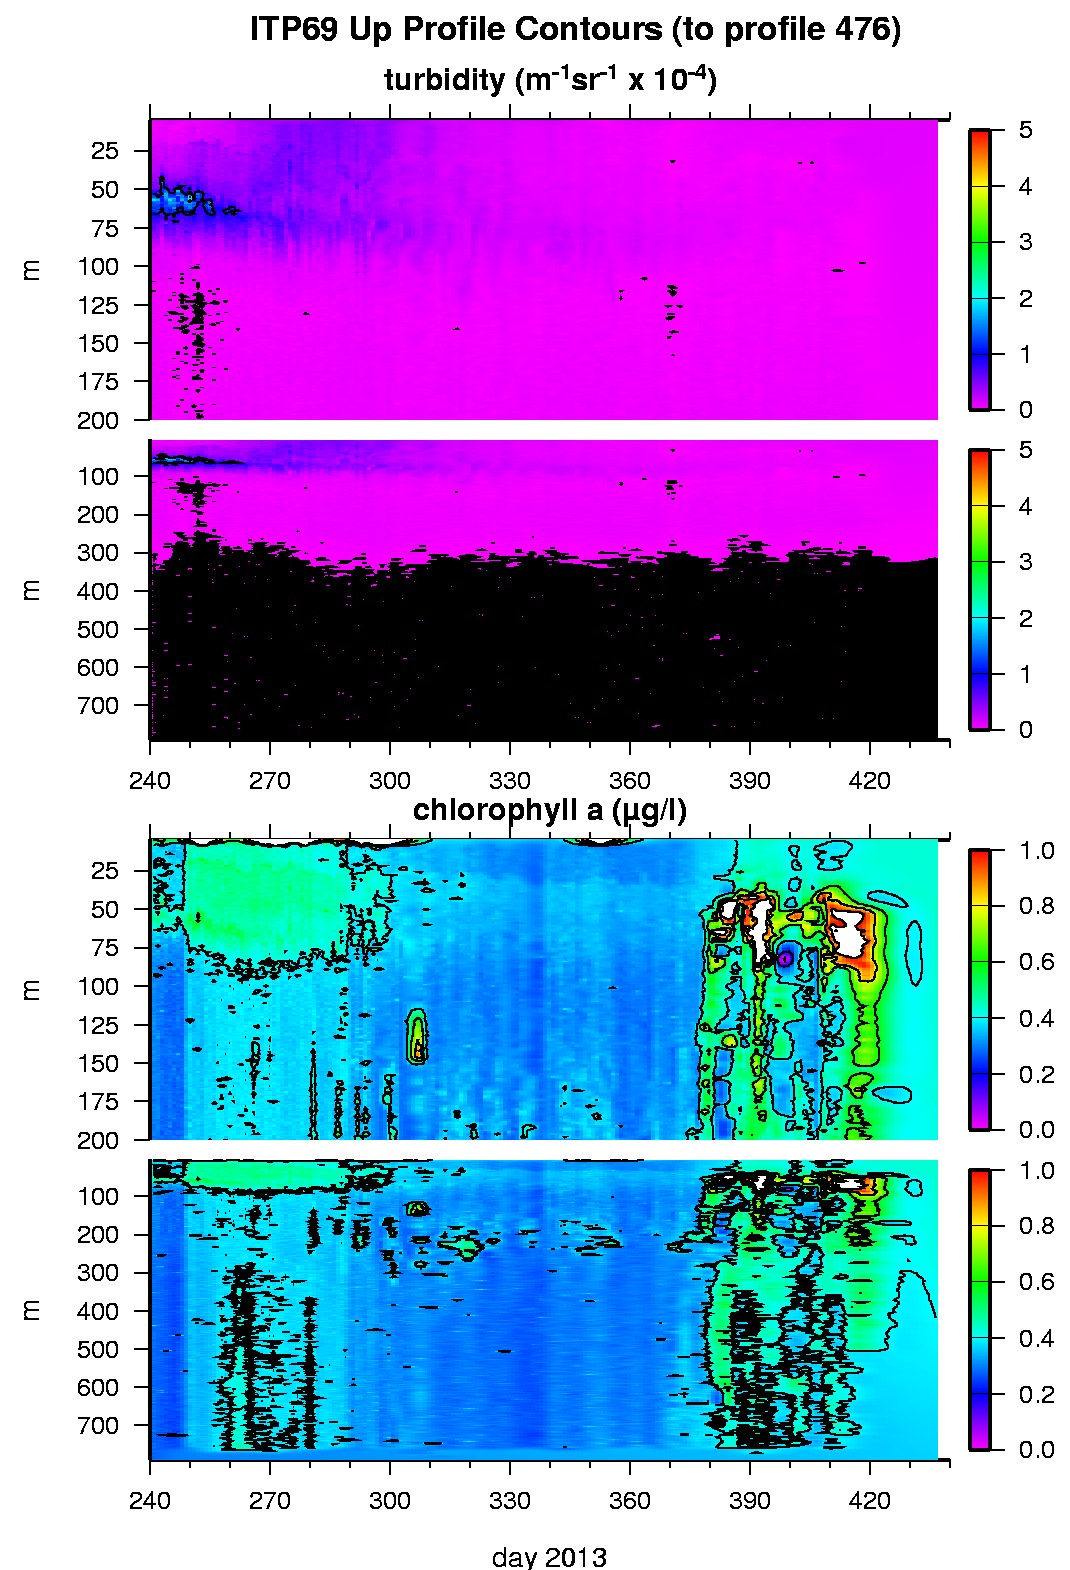
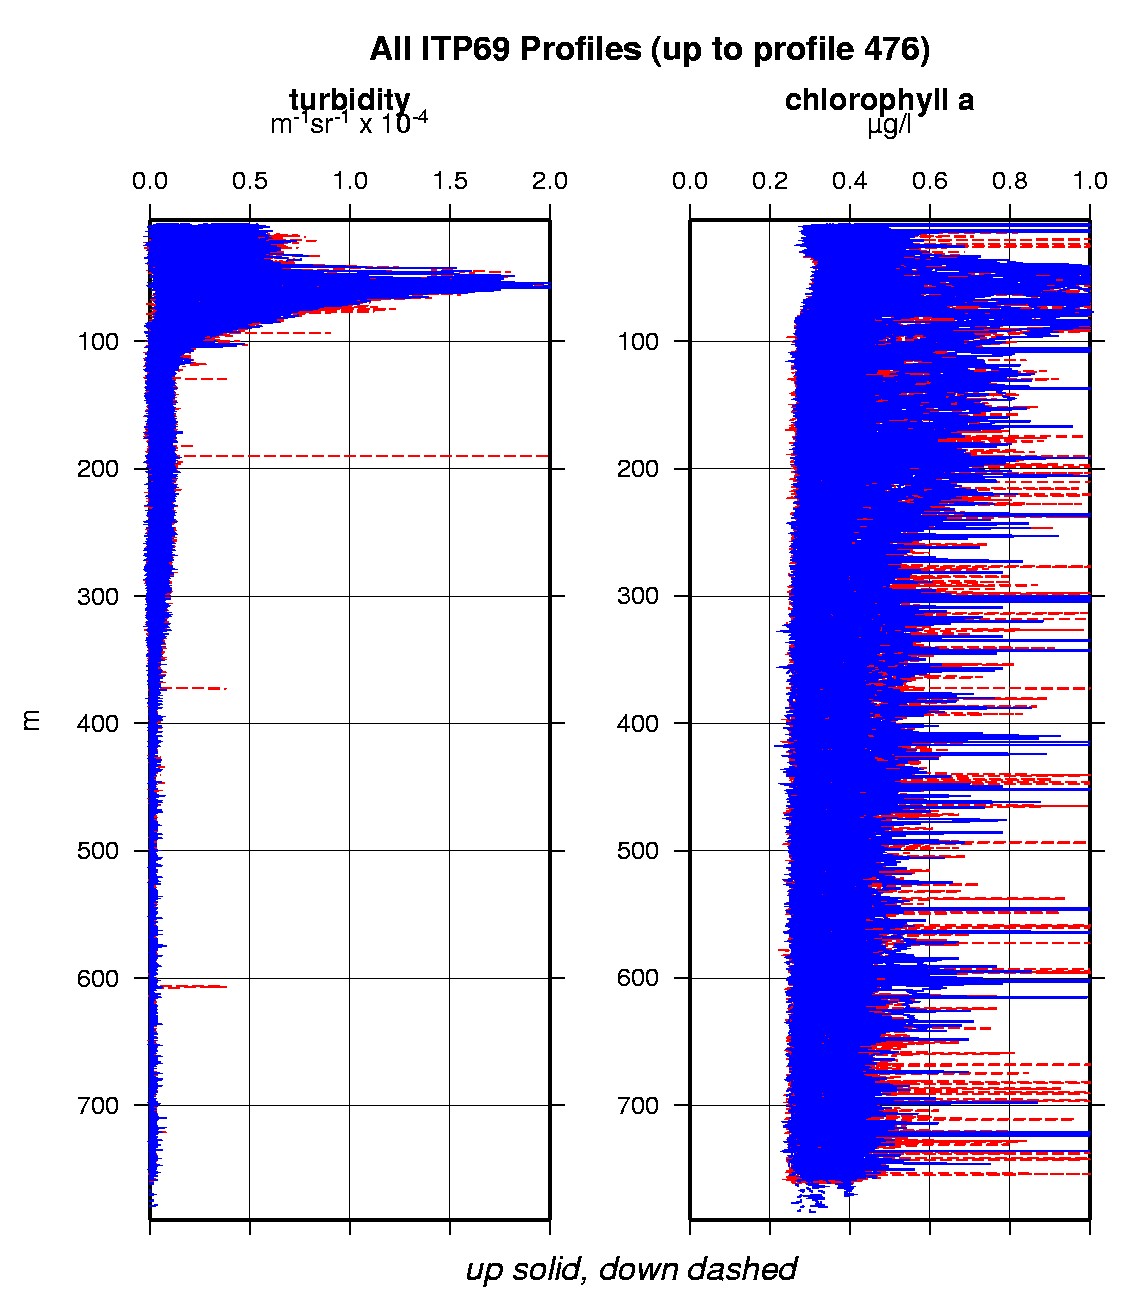
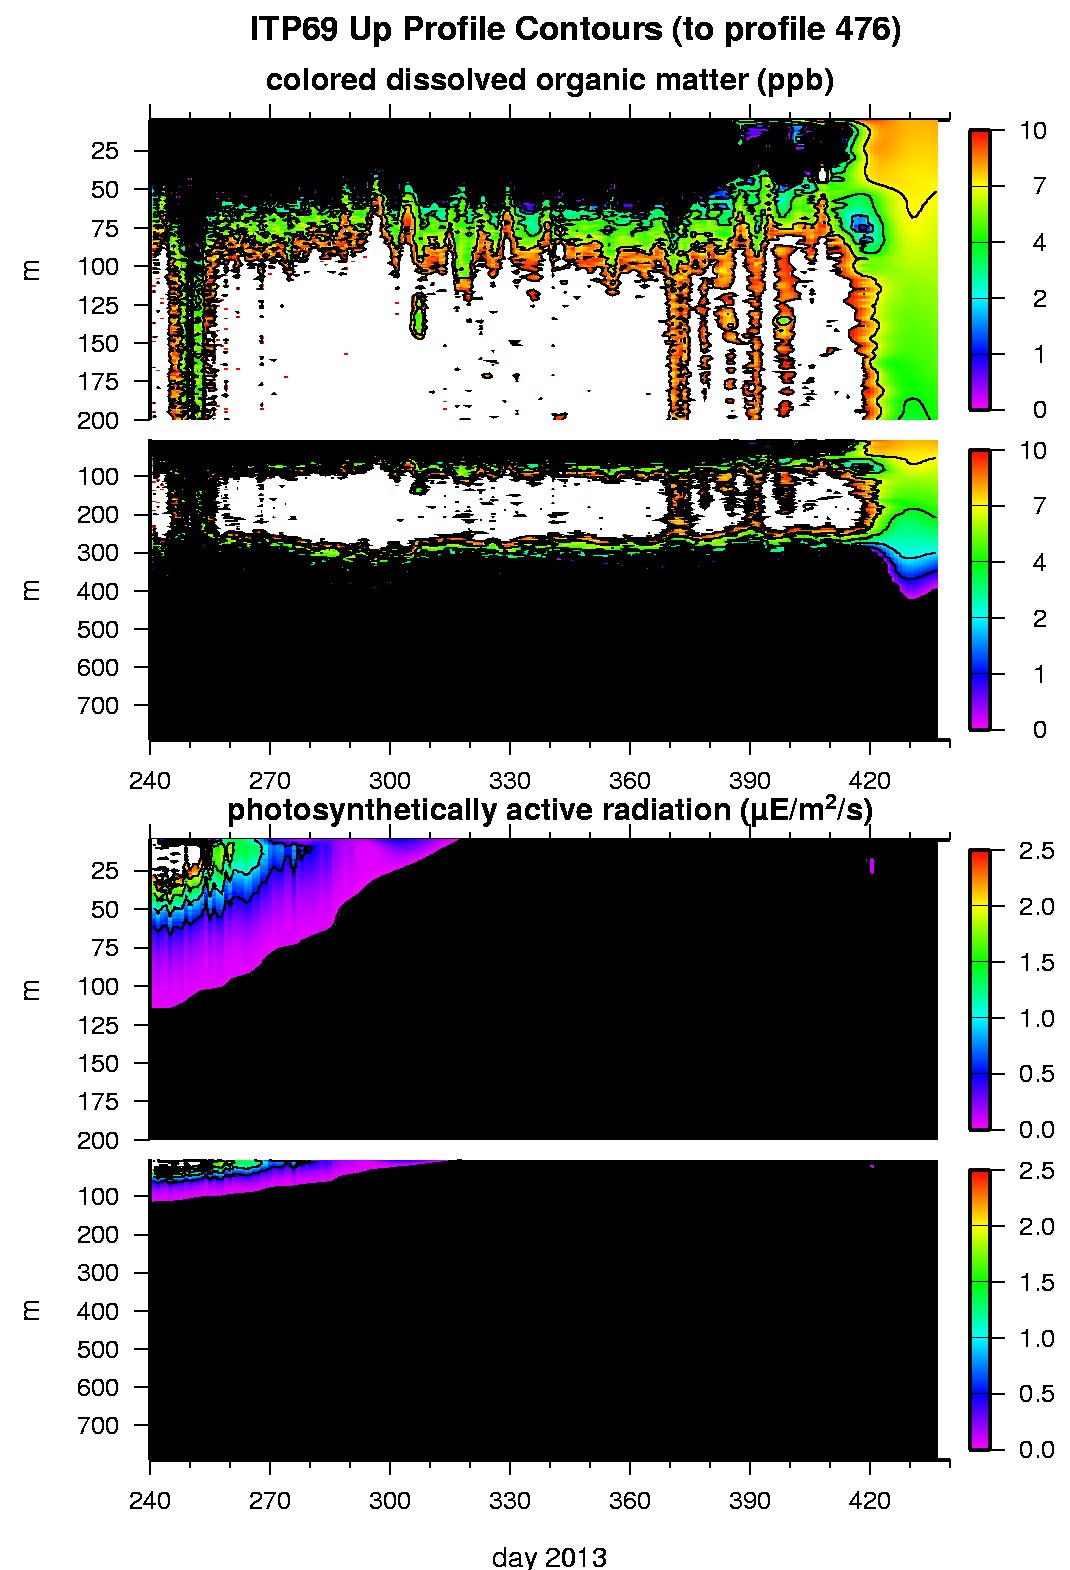
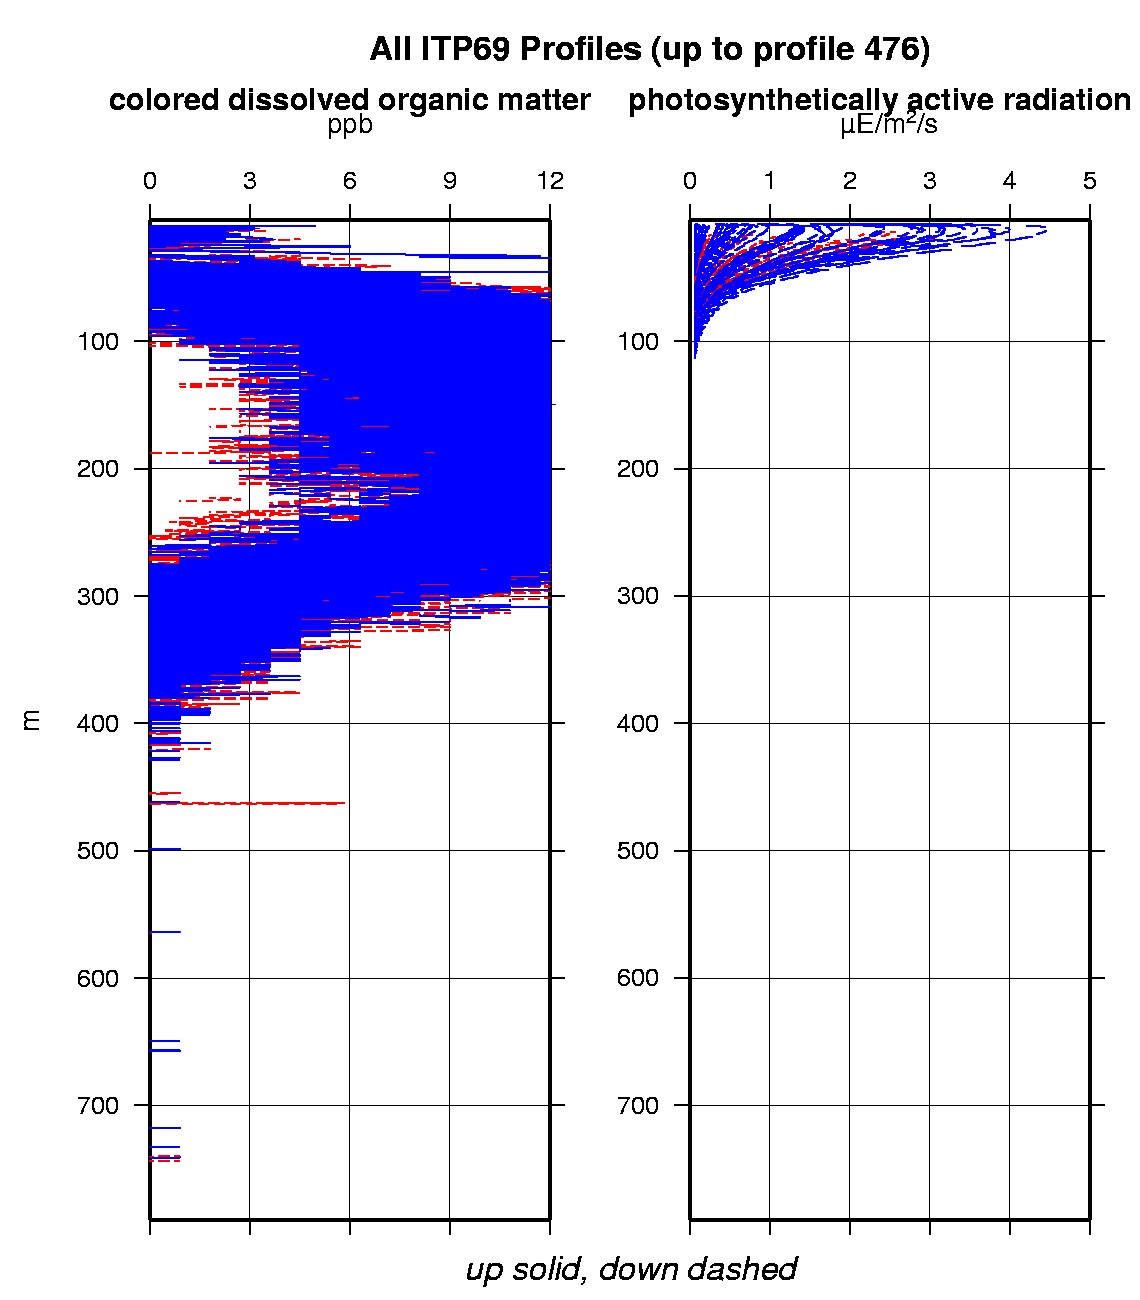
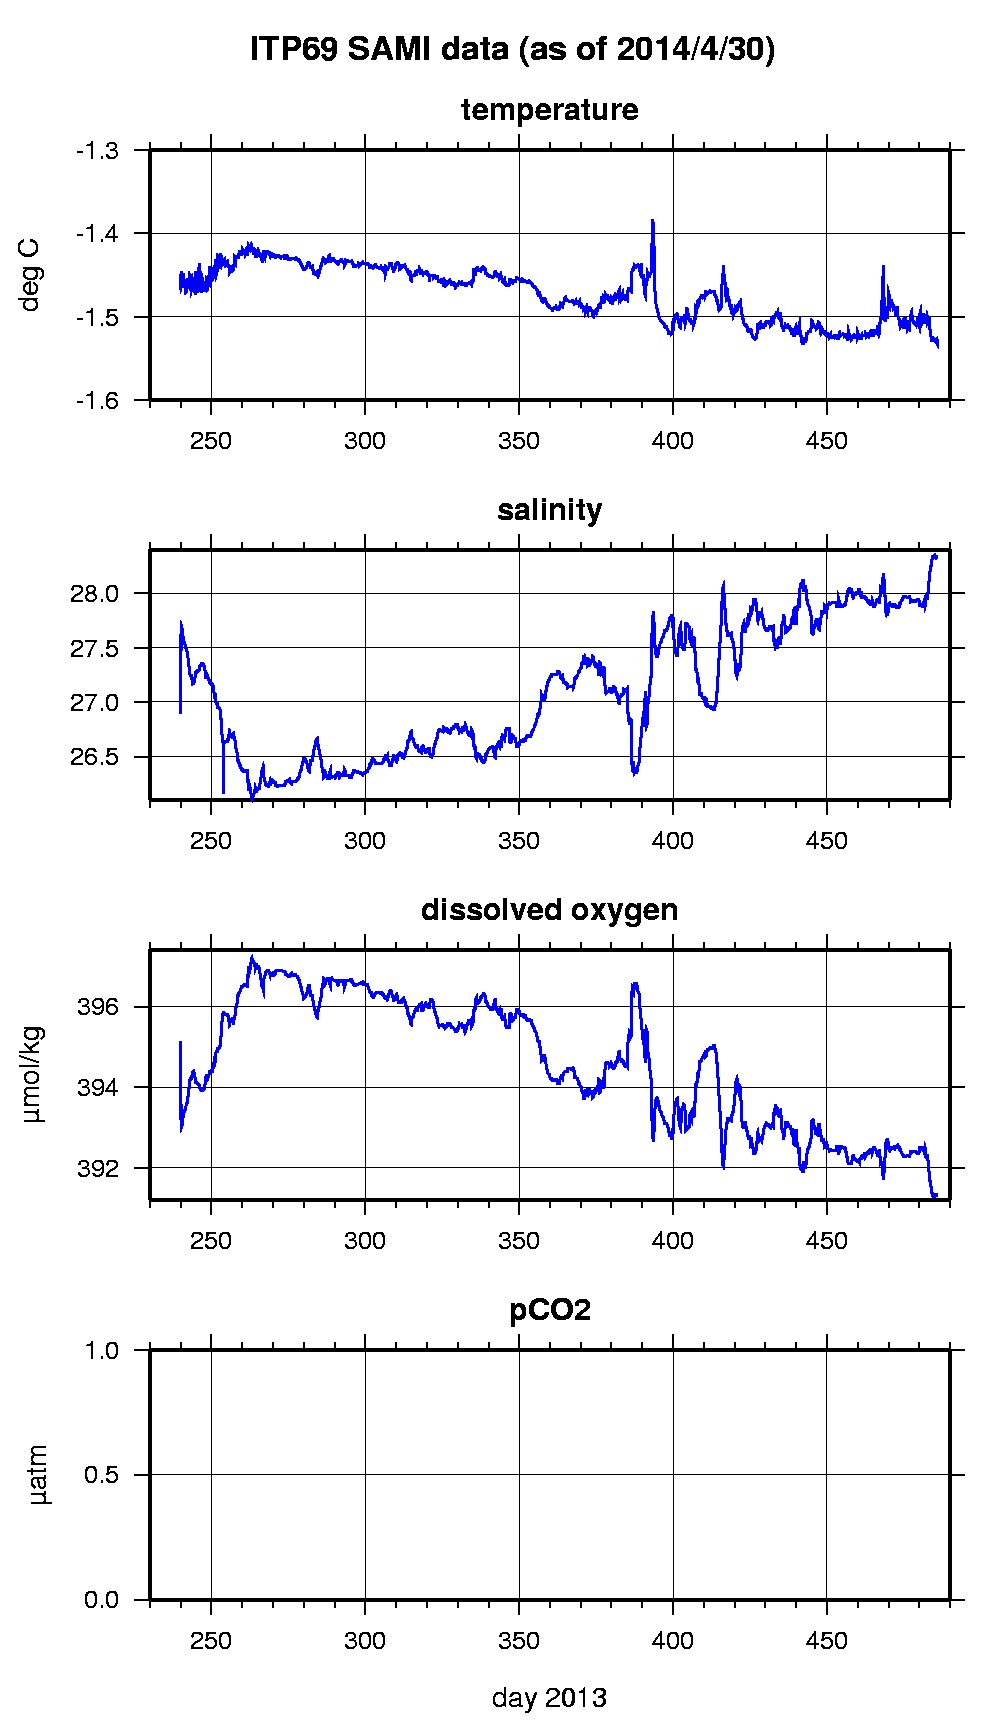
The plots to the right are of the final, calibrated, edited data (as opposed to the raw data presented on the active instrument pages).
See the Data Products tab to the left for descriptions of the three levels (I, II, III) of data processing and to access all data.
ITP 69 data can also be found at the links below:
Level II hourly buoy location data in ASCII format: itp69rawlocs.dat
Level III 1-Hz processed profile and SAMI data in MATLAB format: itp69cormat.tar.Z and itp69cormat.zip
Level III 1-db bin-averaged processed profile and SAMI data in MATLAB format: itp69final.mat
Level III 1-db bin-averaged processed profile and SAMI data in ASCII format: itp69final.tar.Z and itp69final.zip
