ITP19 Data Description
The ITP profiler was configured to operate with an accelerated sampling schedule of 4 one-way profiles between 7 and 760 m depth each day, as it was expected to reach Fram Strait in less than a year. In the surface package, the GPS receiver was powered hourly to obtain locations, and buoy temperature and battery voltage status were recorded.
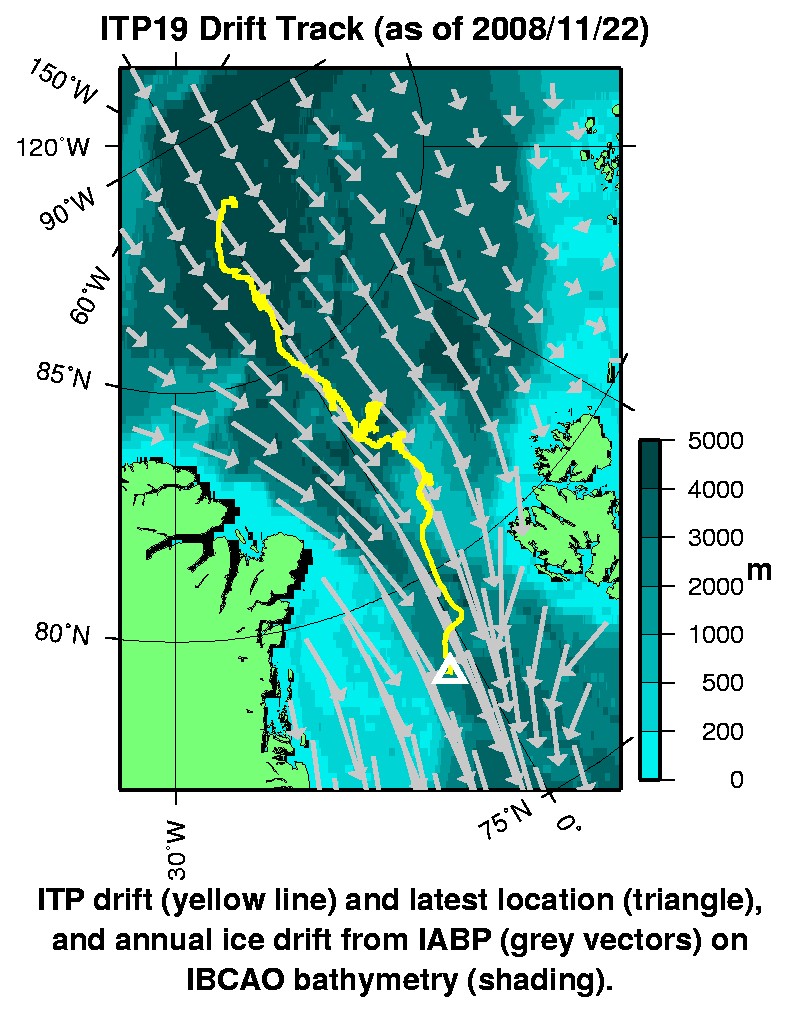
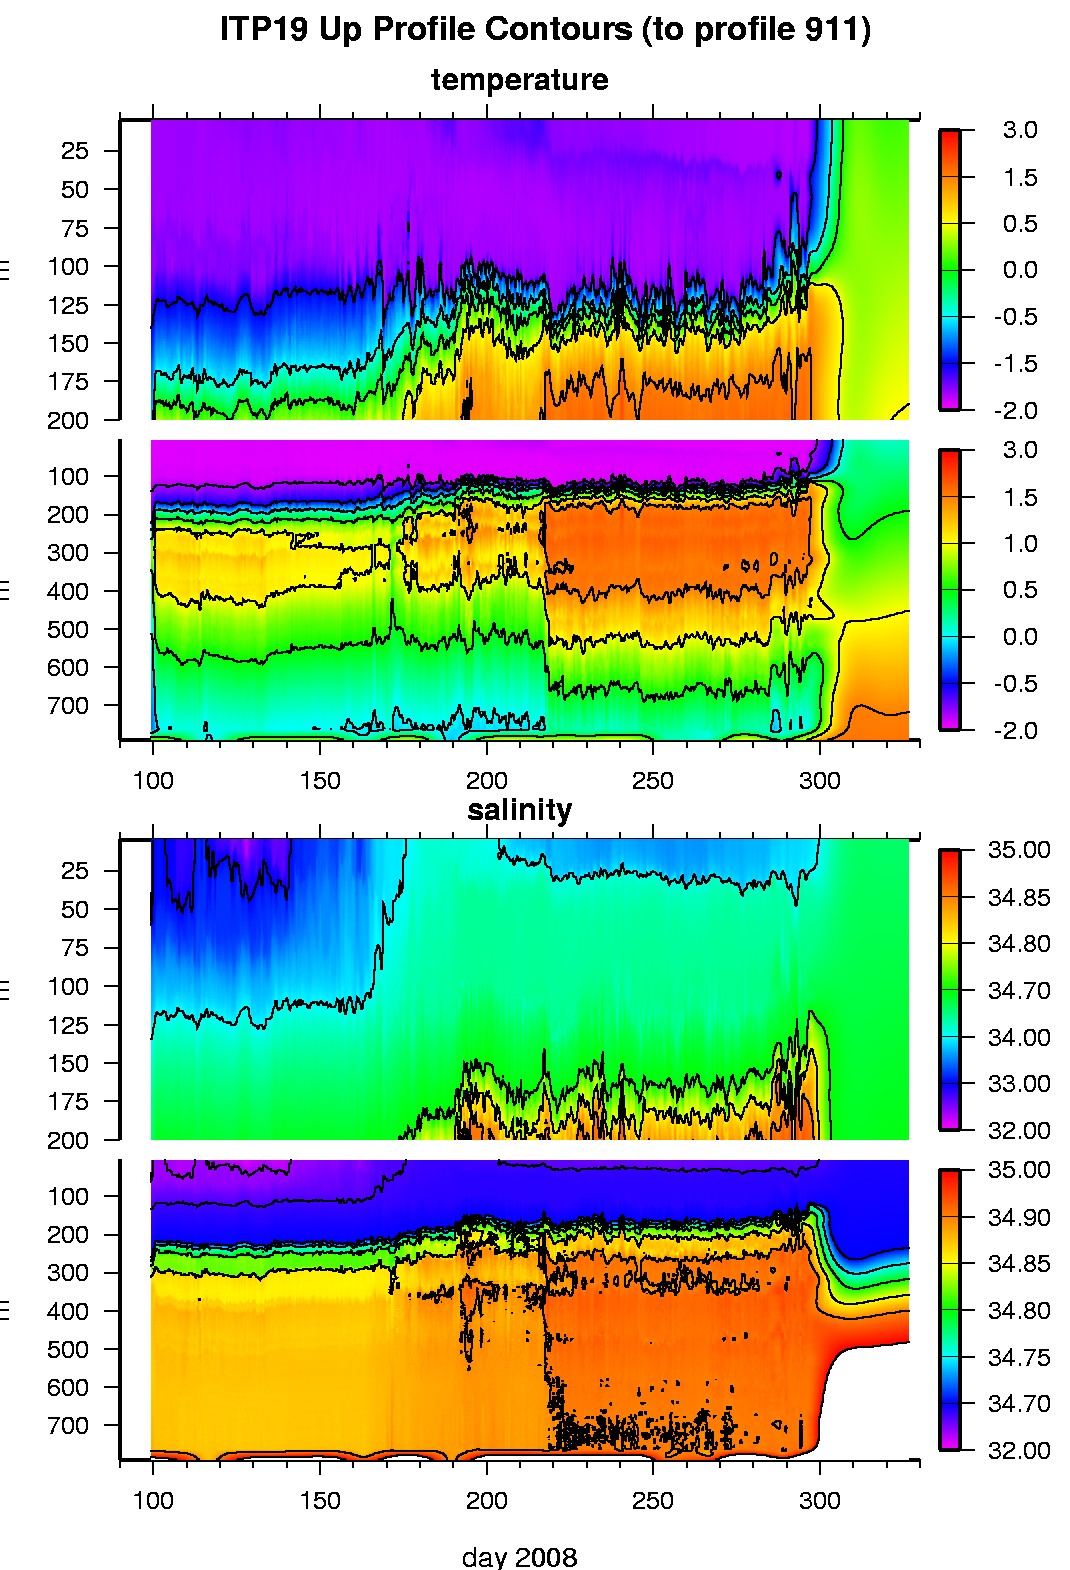
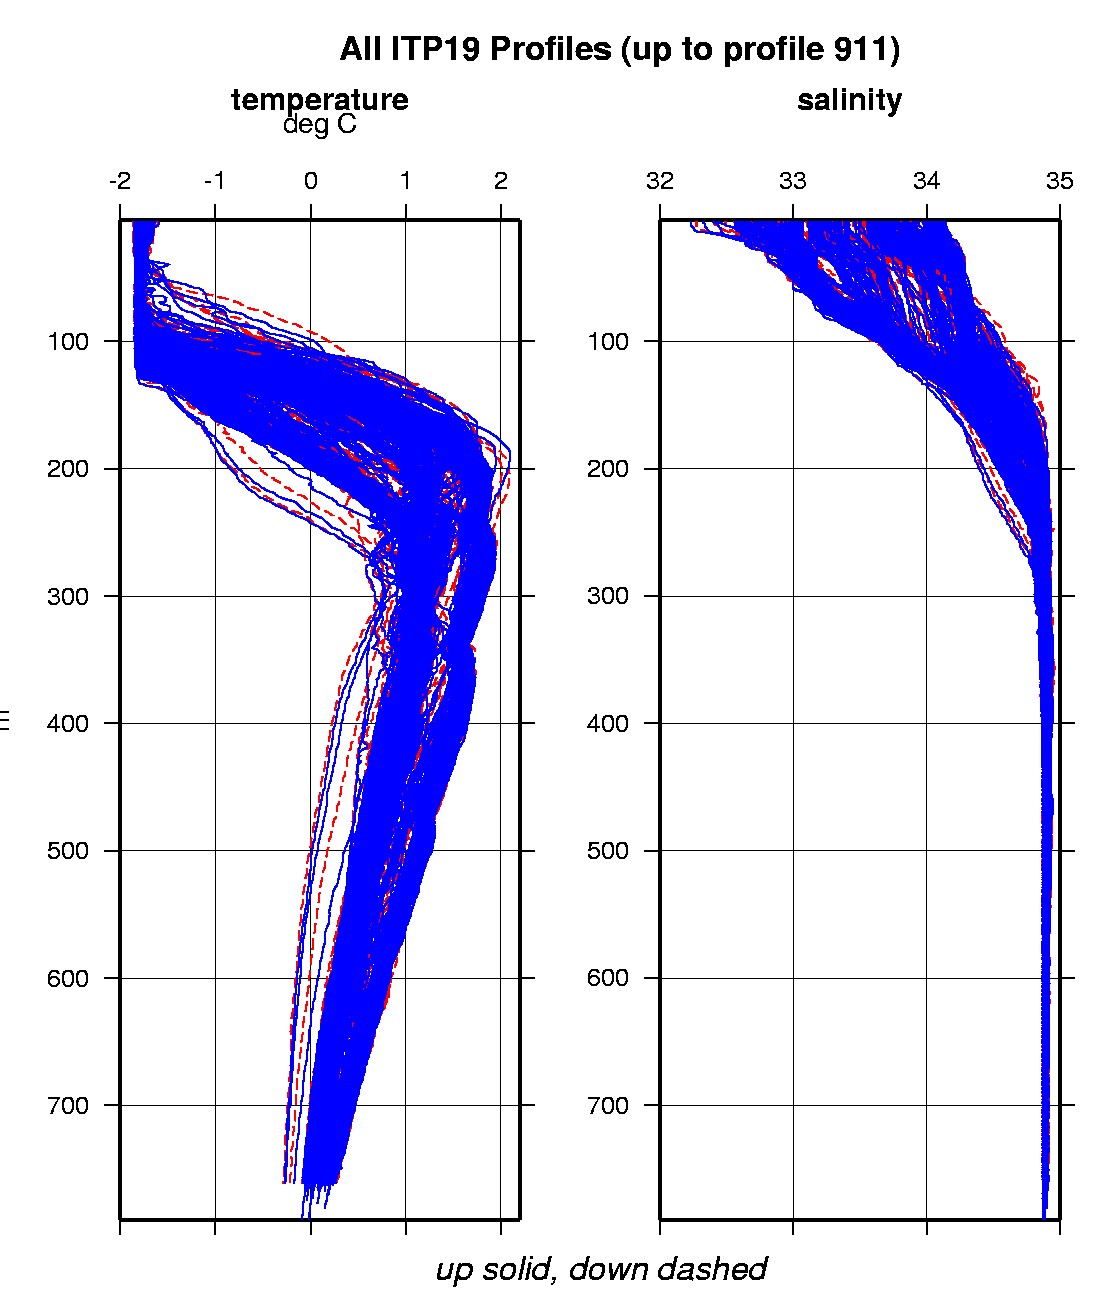
The drift of the ITP was fortuitous as it managed to skirt shallow bathymetry and speed through Fram Strait with the 790 m mooring tether intact. During the first 4 months the profiler sampled through the Amundsen and Nansen Basins and encountered the entering Atlantic water looping around the Yermak Plateau, when the CTD pump on the profiler malfunctioned or fouled so caused extreme sensor lags. While these are corrected in the dataset, the accuracy of the results is reduced beginning in August, and completely corrupted profiles during the transit through Fram Strait beginning in October are removed. Just after the last profile attempts were received a month later, the ITP surface package stopped communicating.
The plots to the right are of the final, calibrated, edited data (as opposed to the raw data presented on the active instrument pages).
See the Data Products tab to the left for descriptions of the three levels (I, II, III) of data processing and to access all data.
ITP 19 data can also be found at the links below:
Level II hourly buoy location data in ASCII format: itp19rawlocs.dat
Level III 1-Hz processed profile data in MATLAB format: itp19cormat.tar.Z and itp19cormat.zip
Level III 1-db bin-averaged processed profile data in MATLAB format: itp19final.mat
Level III 1-db bin-averaged processed profile data in ASCII format: itp19final.tar.Z and itp19final.zip


