ITP29 Data Processing
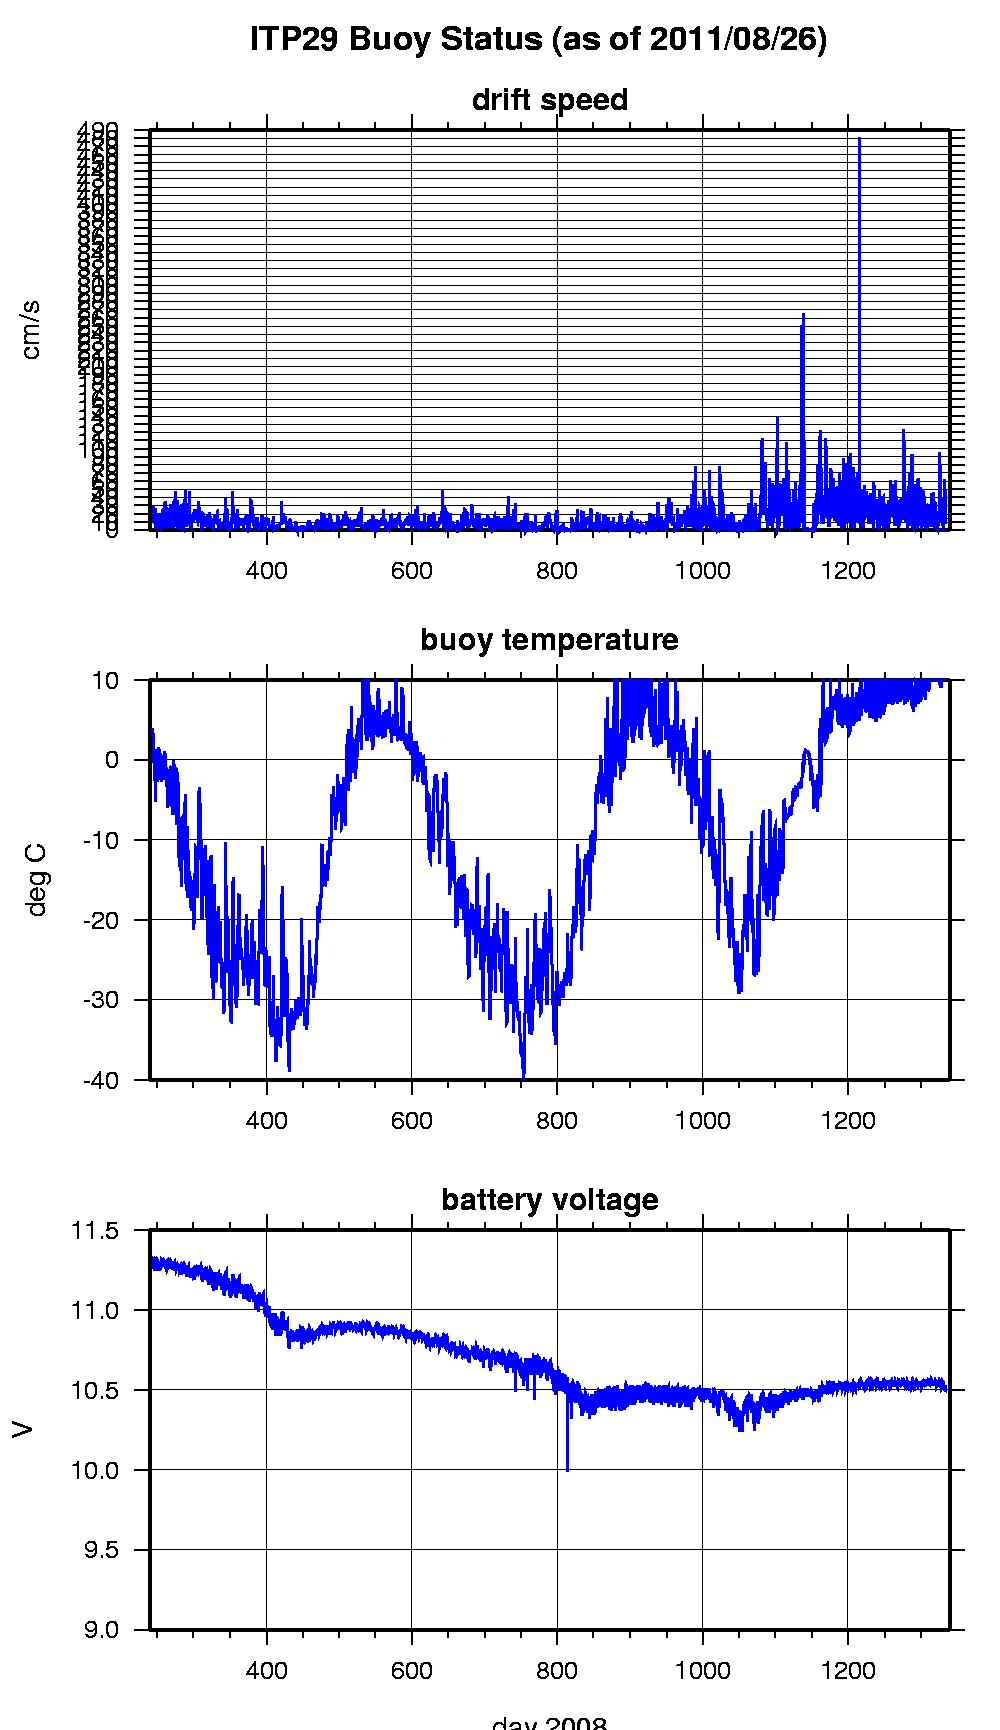
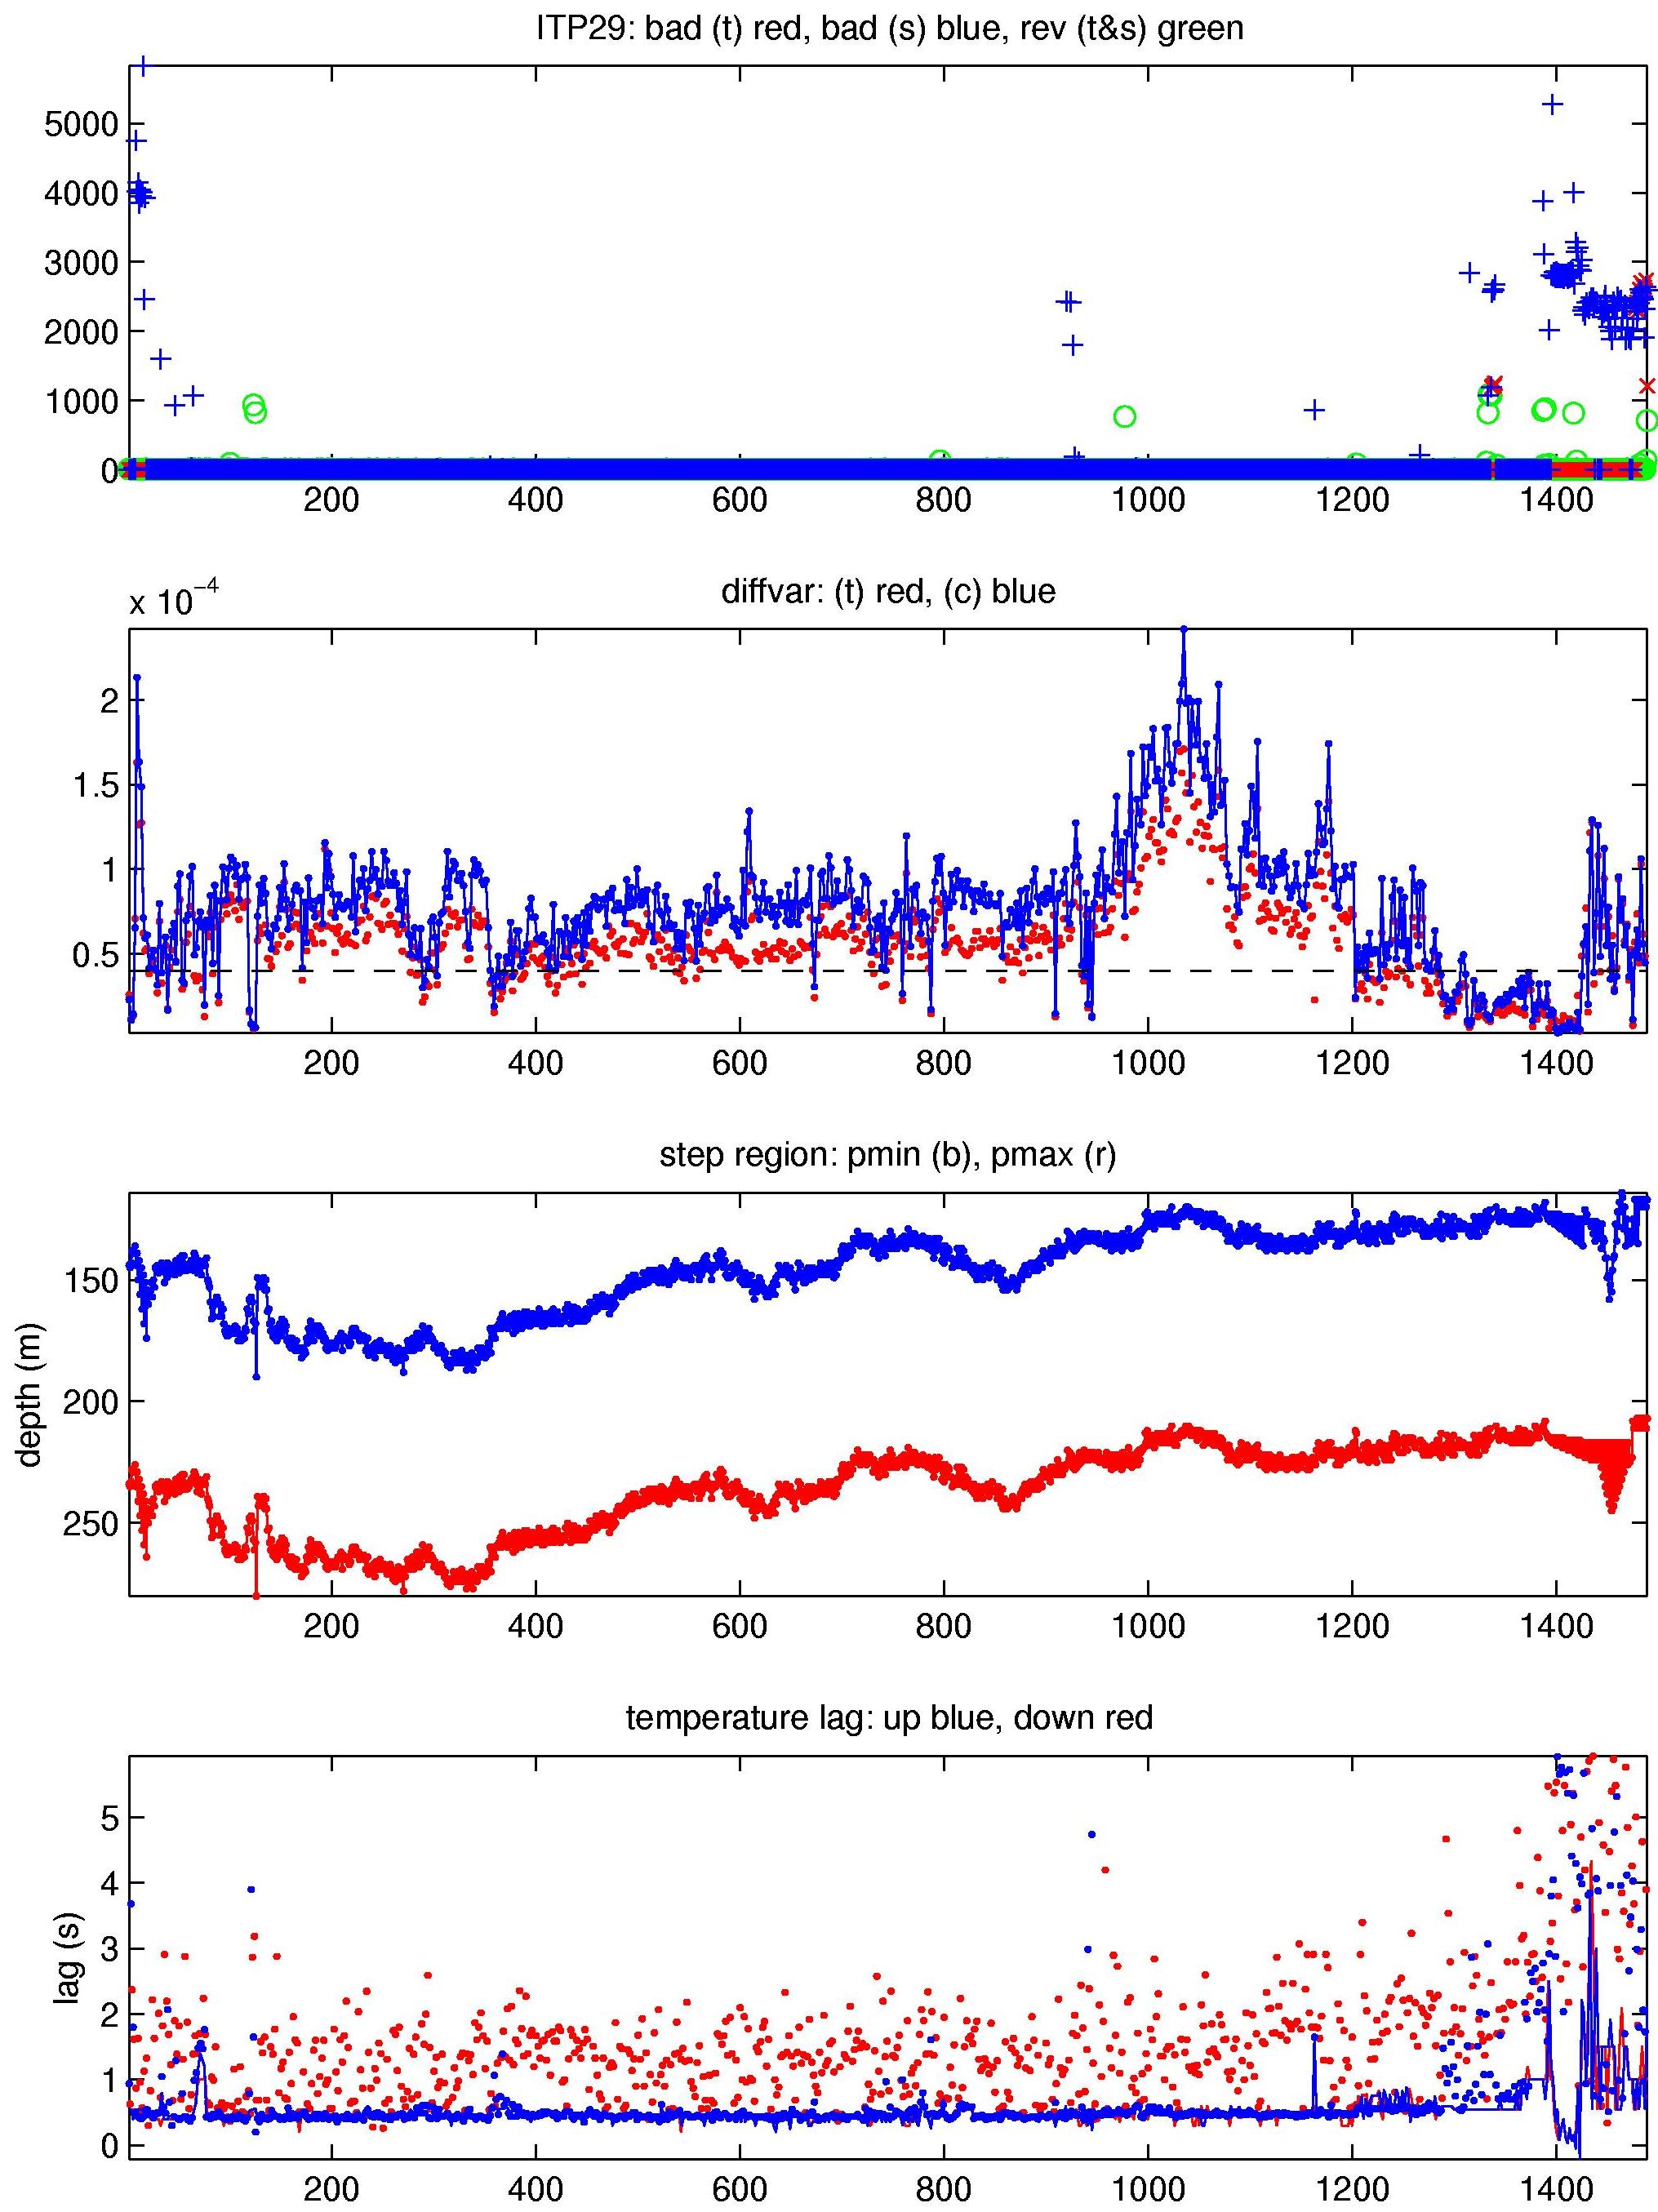
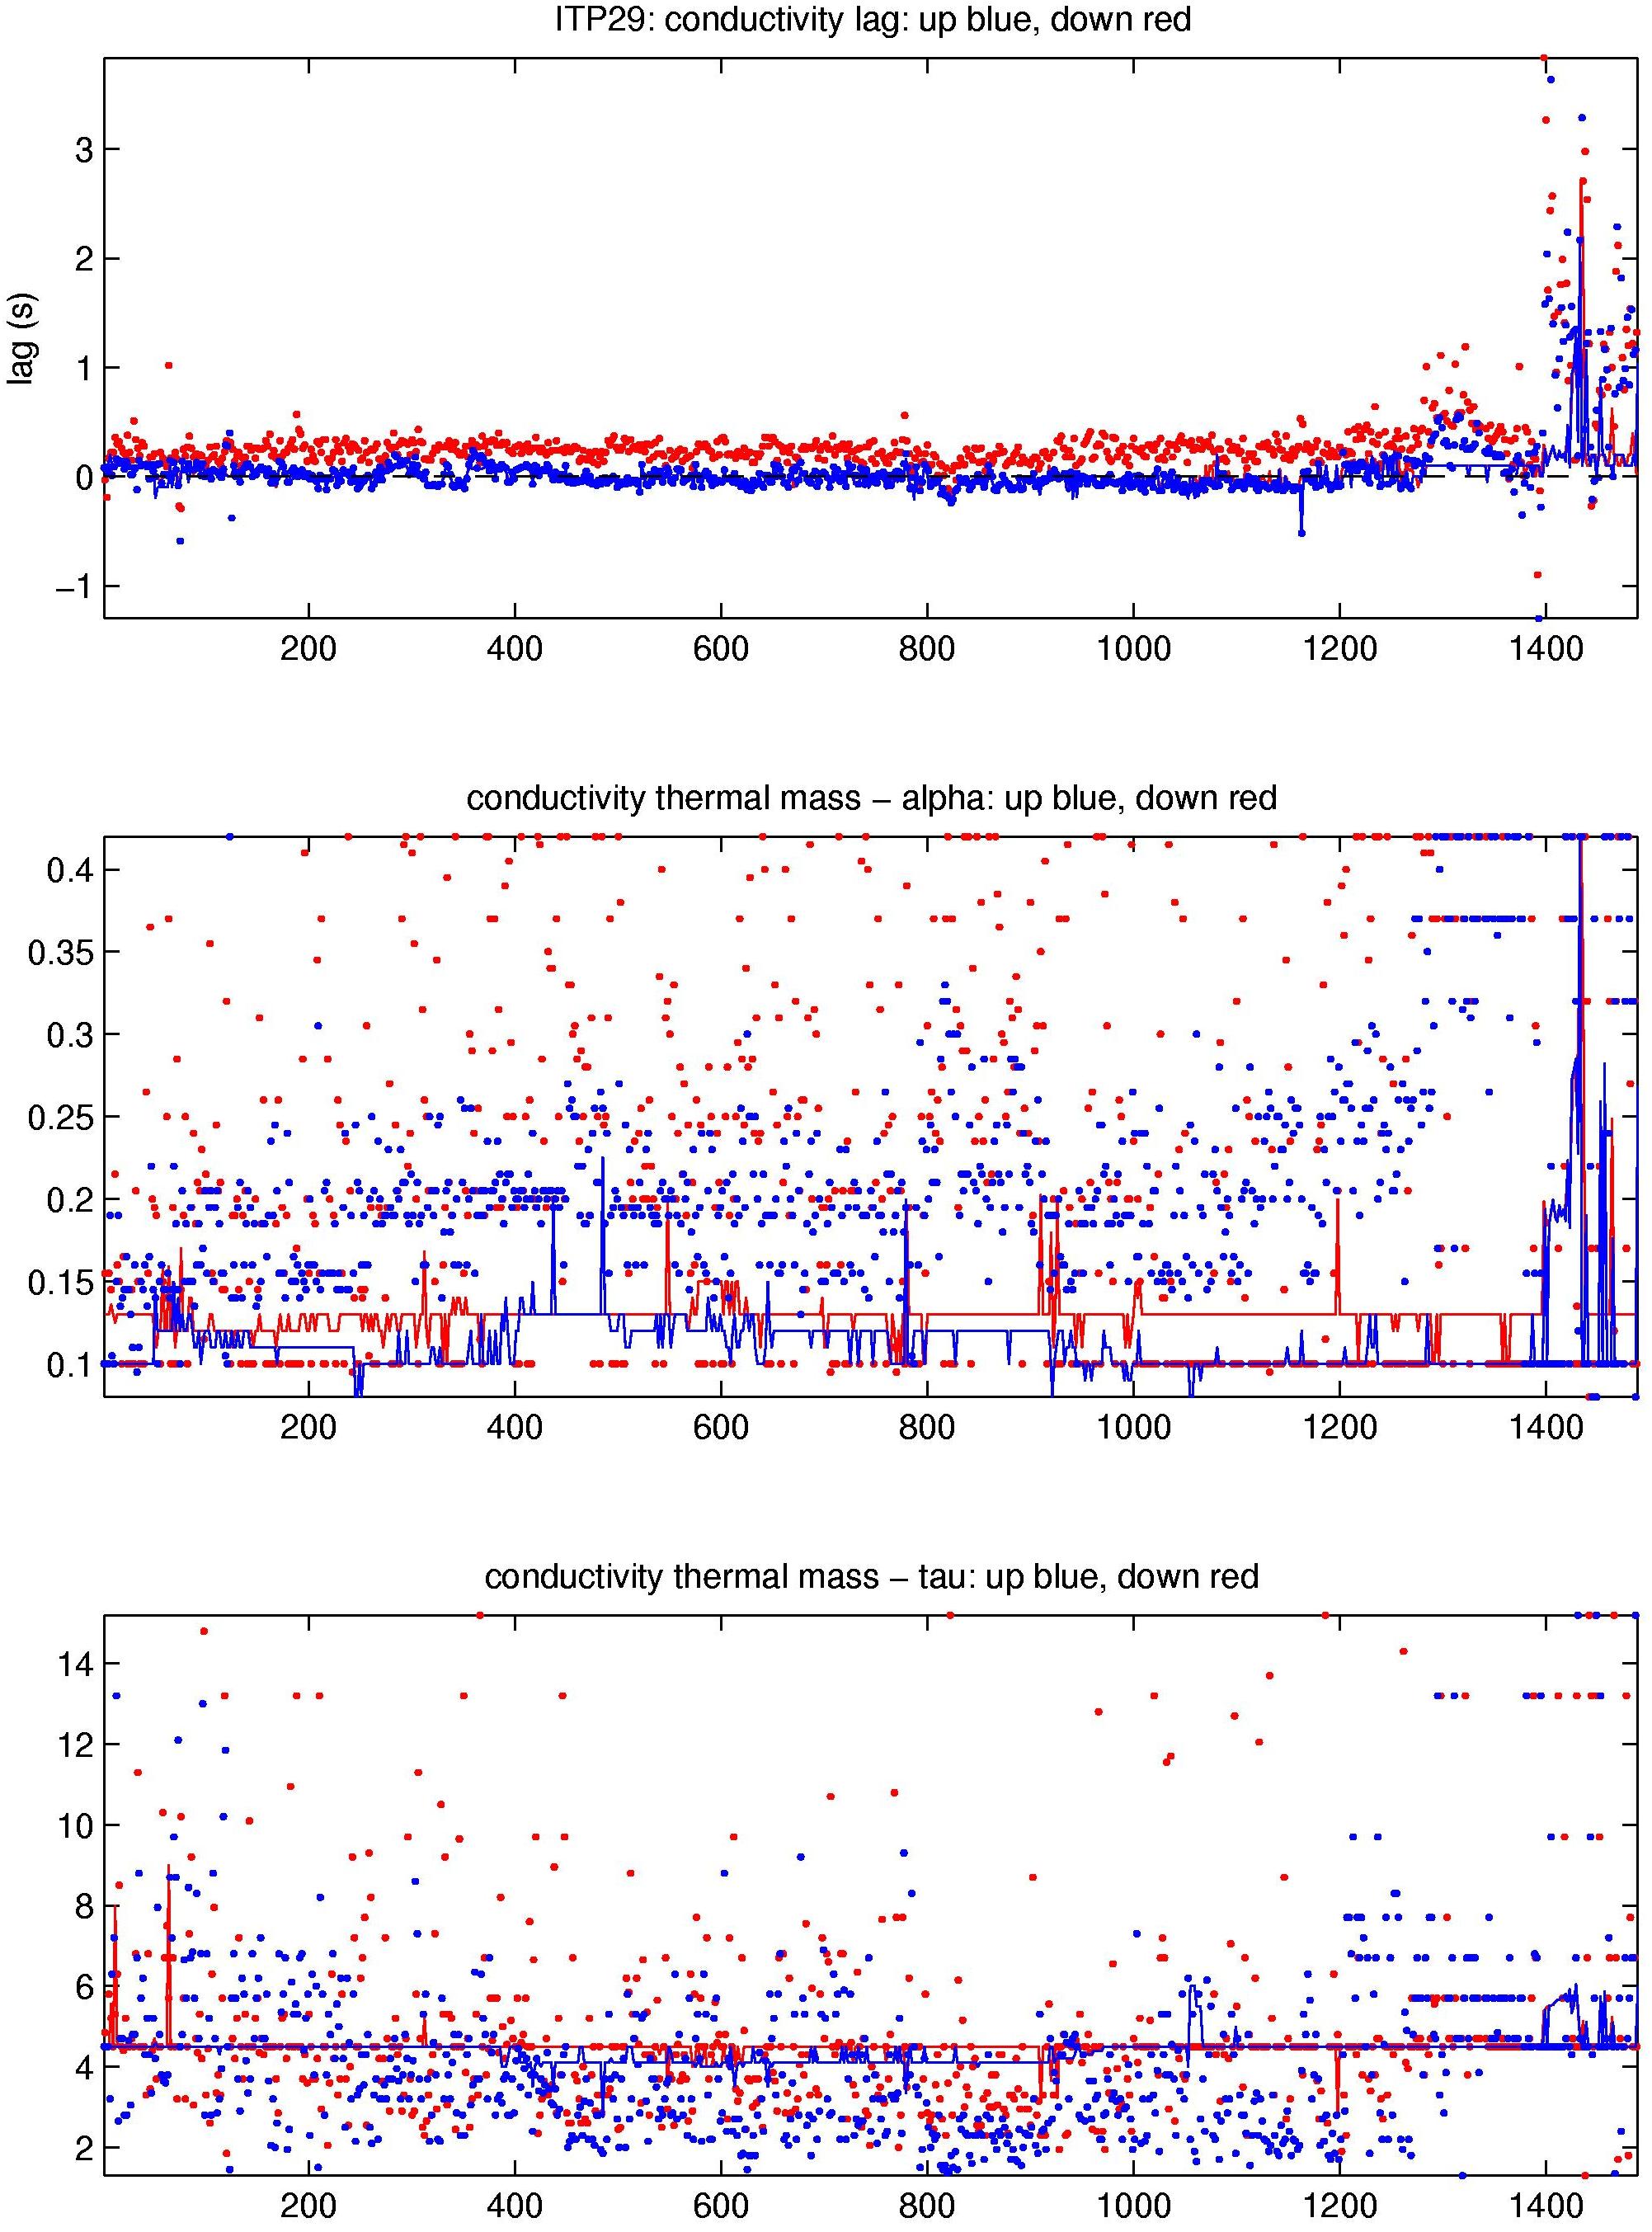
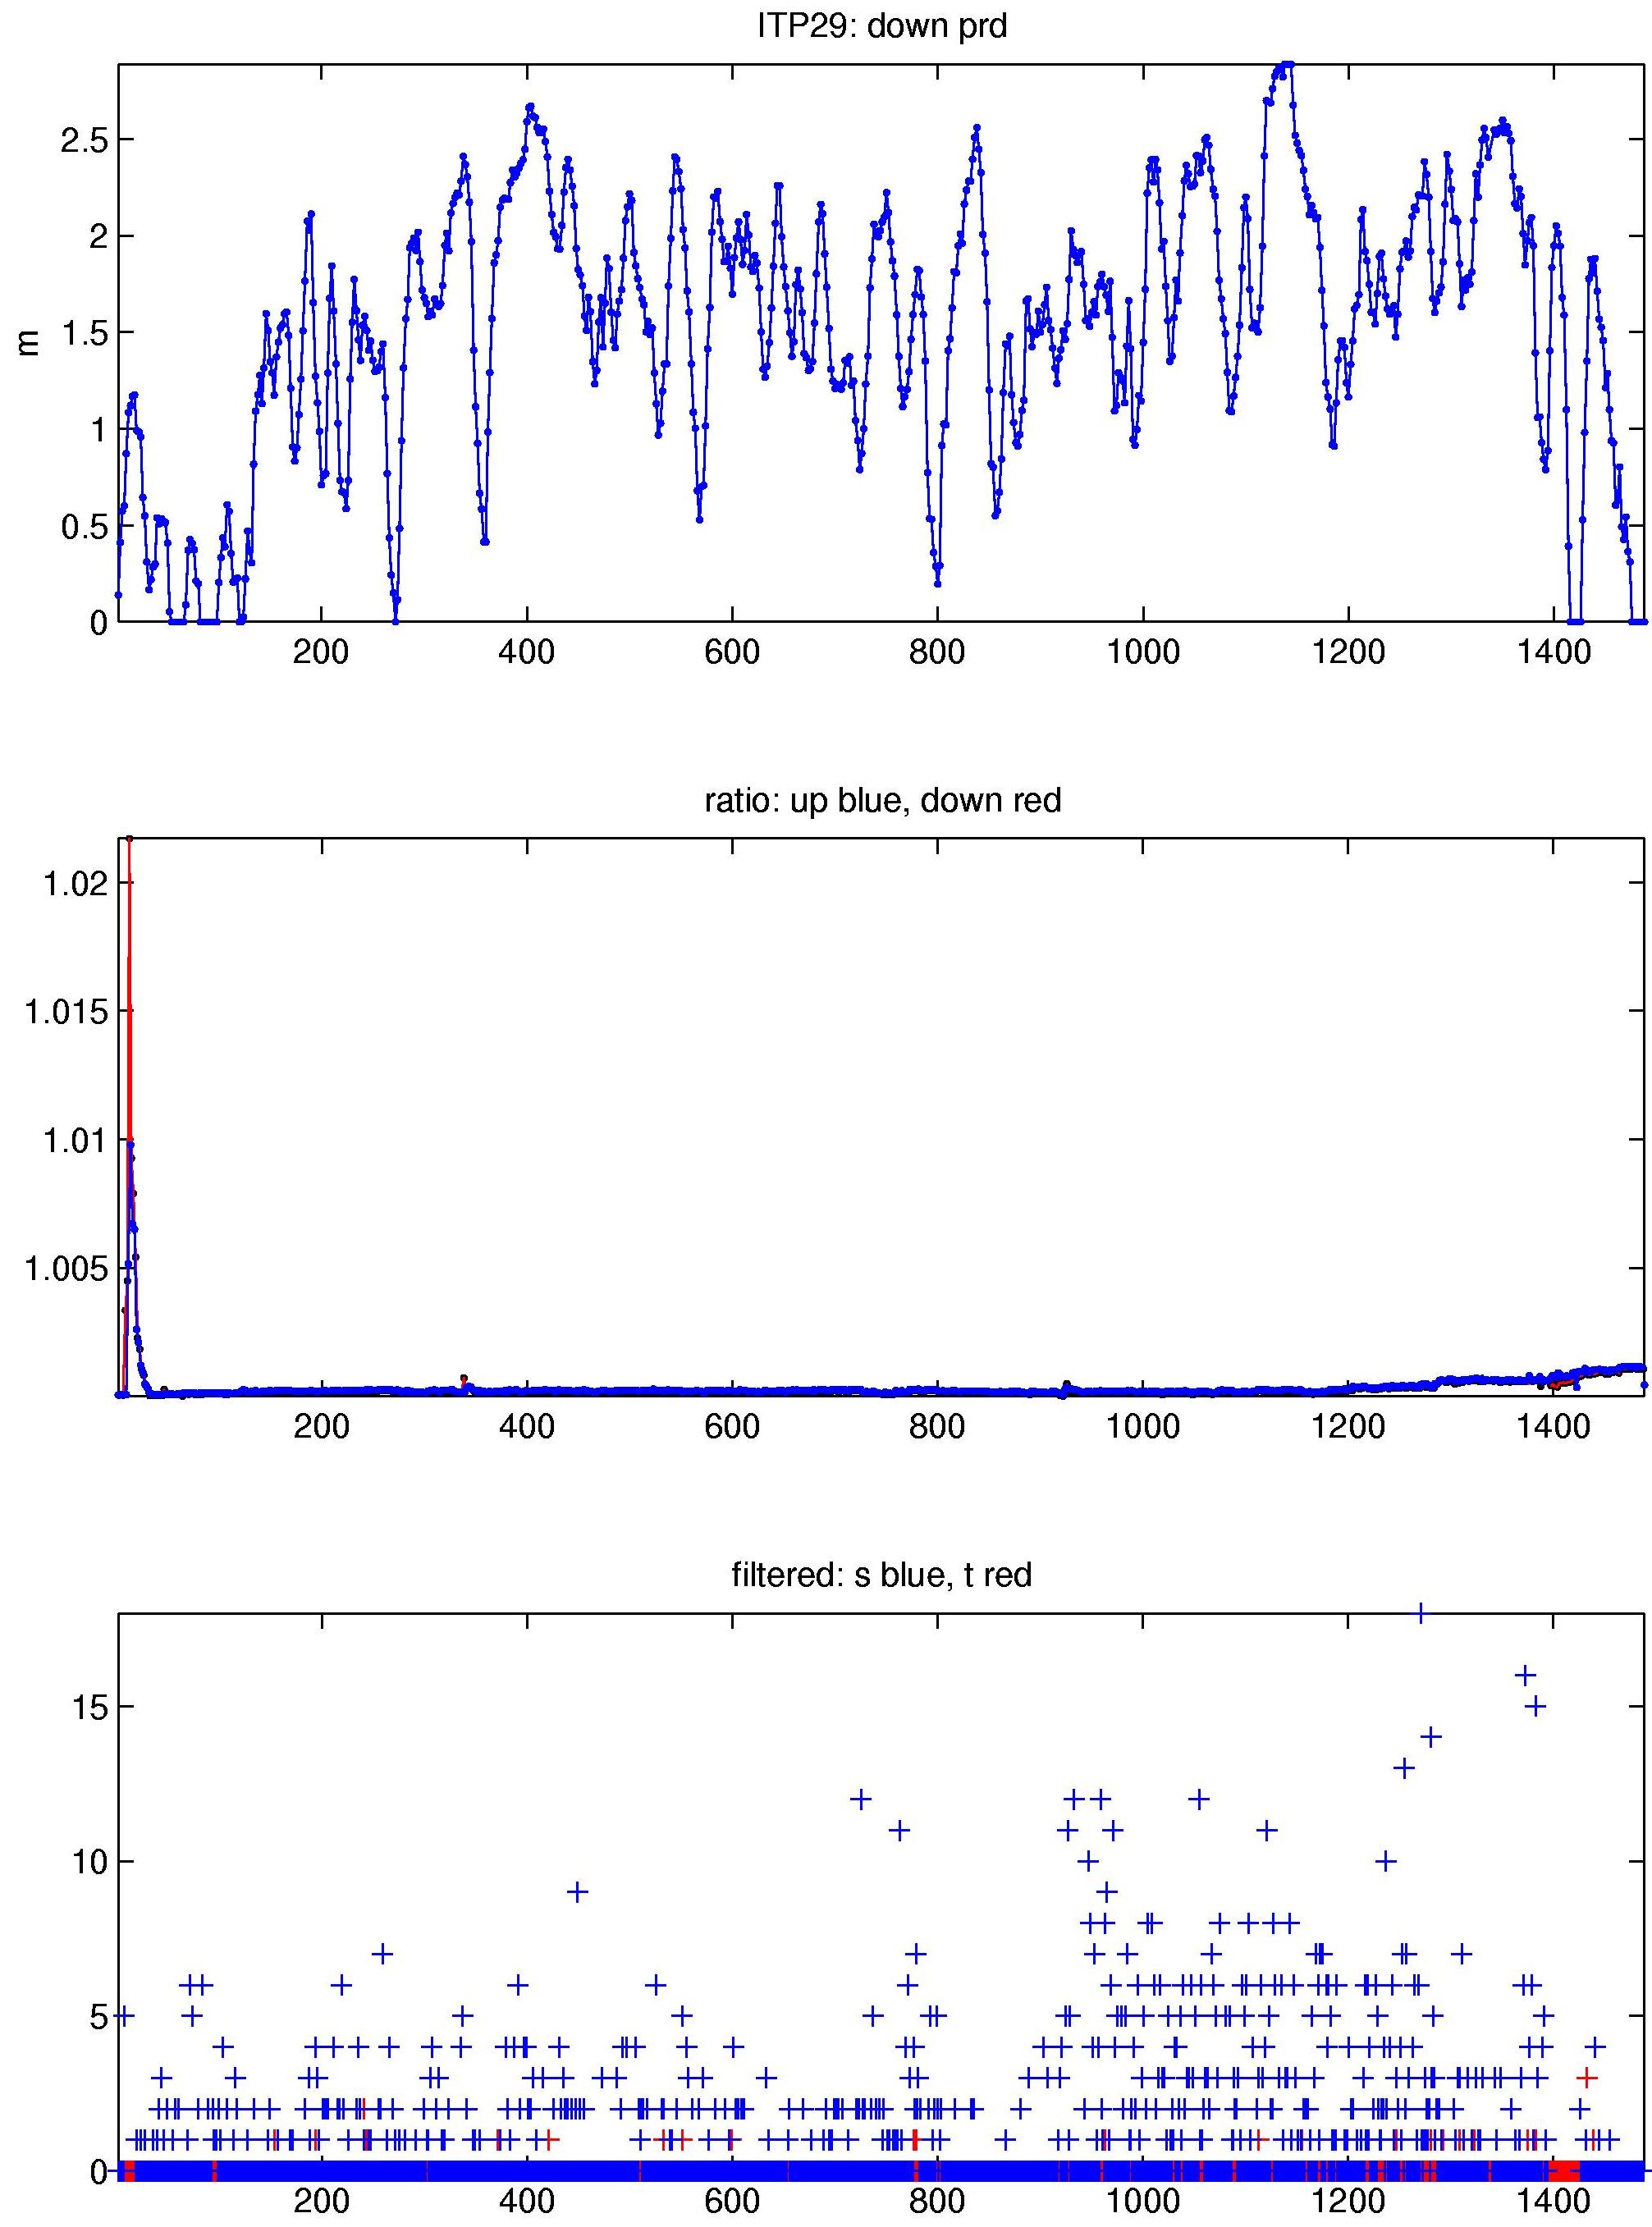
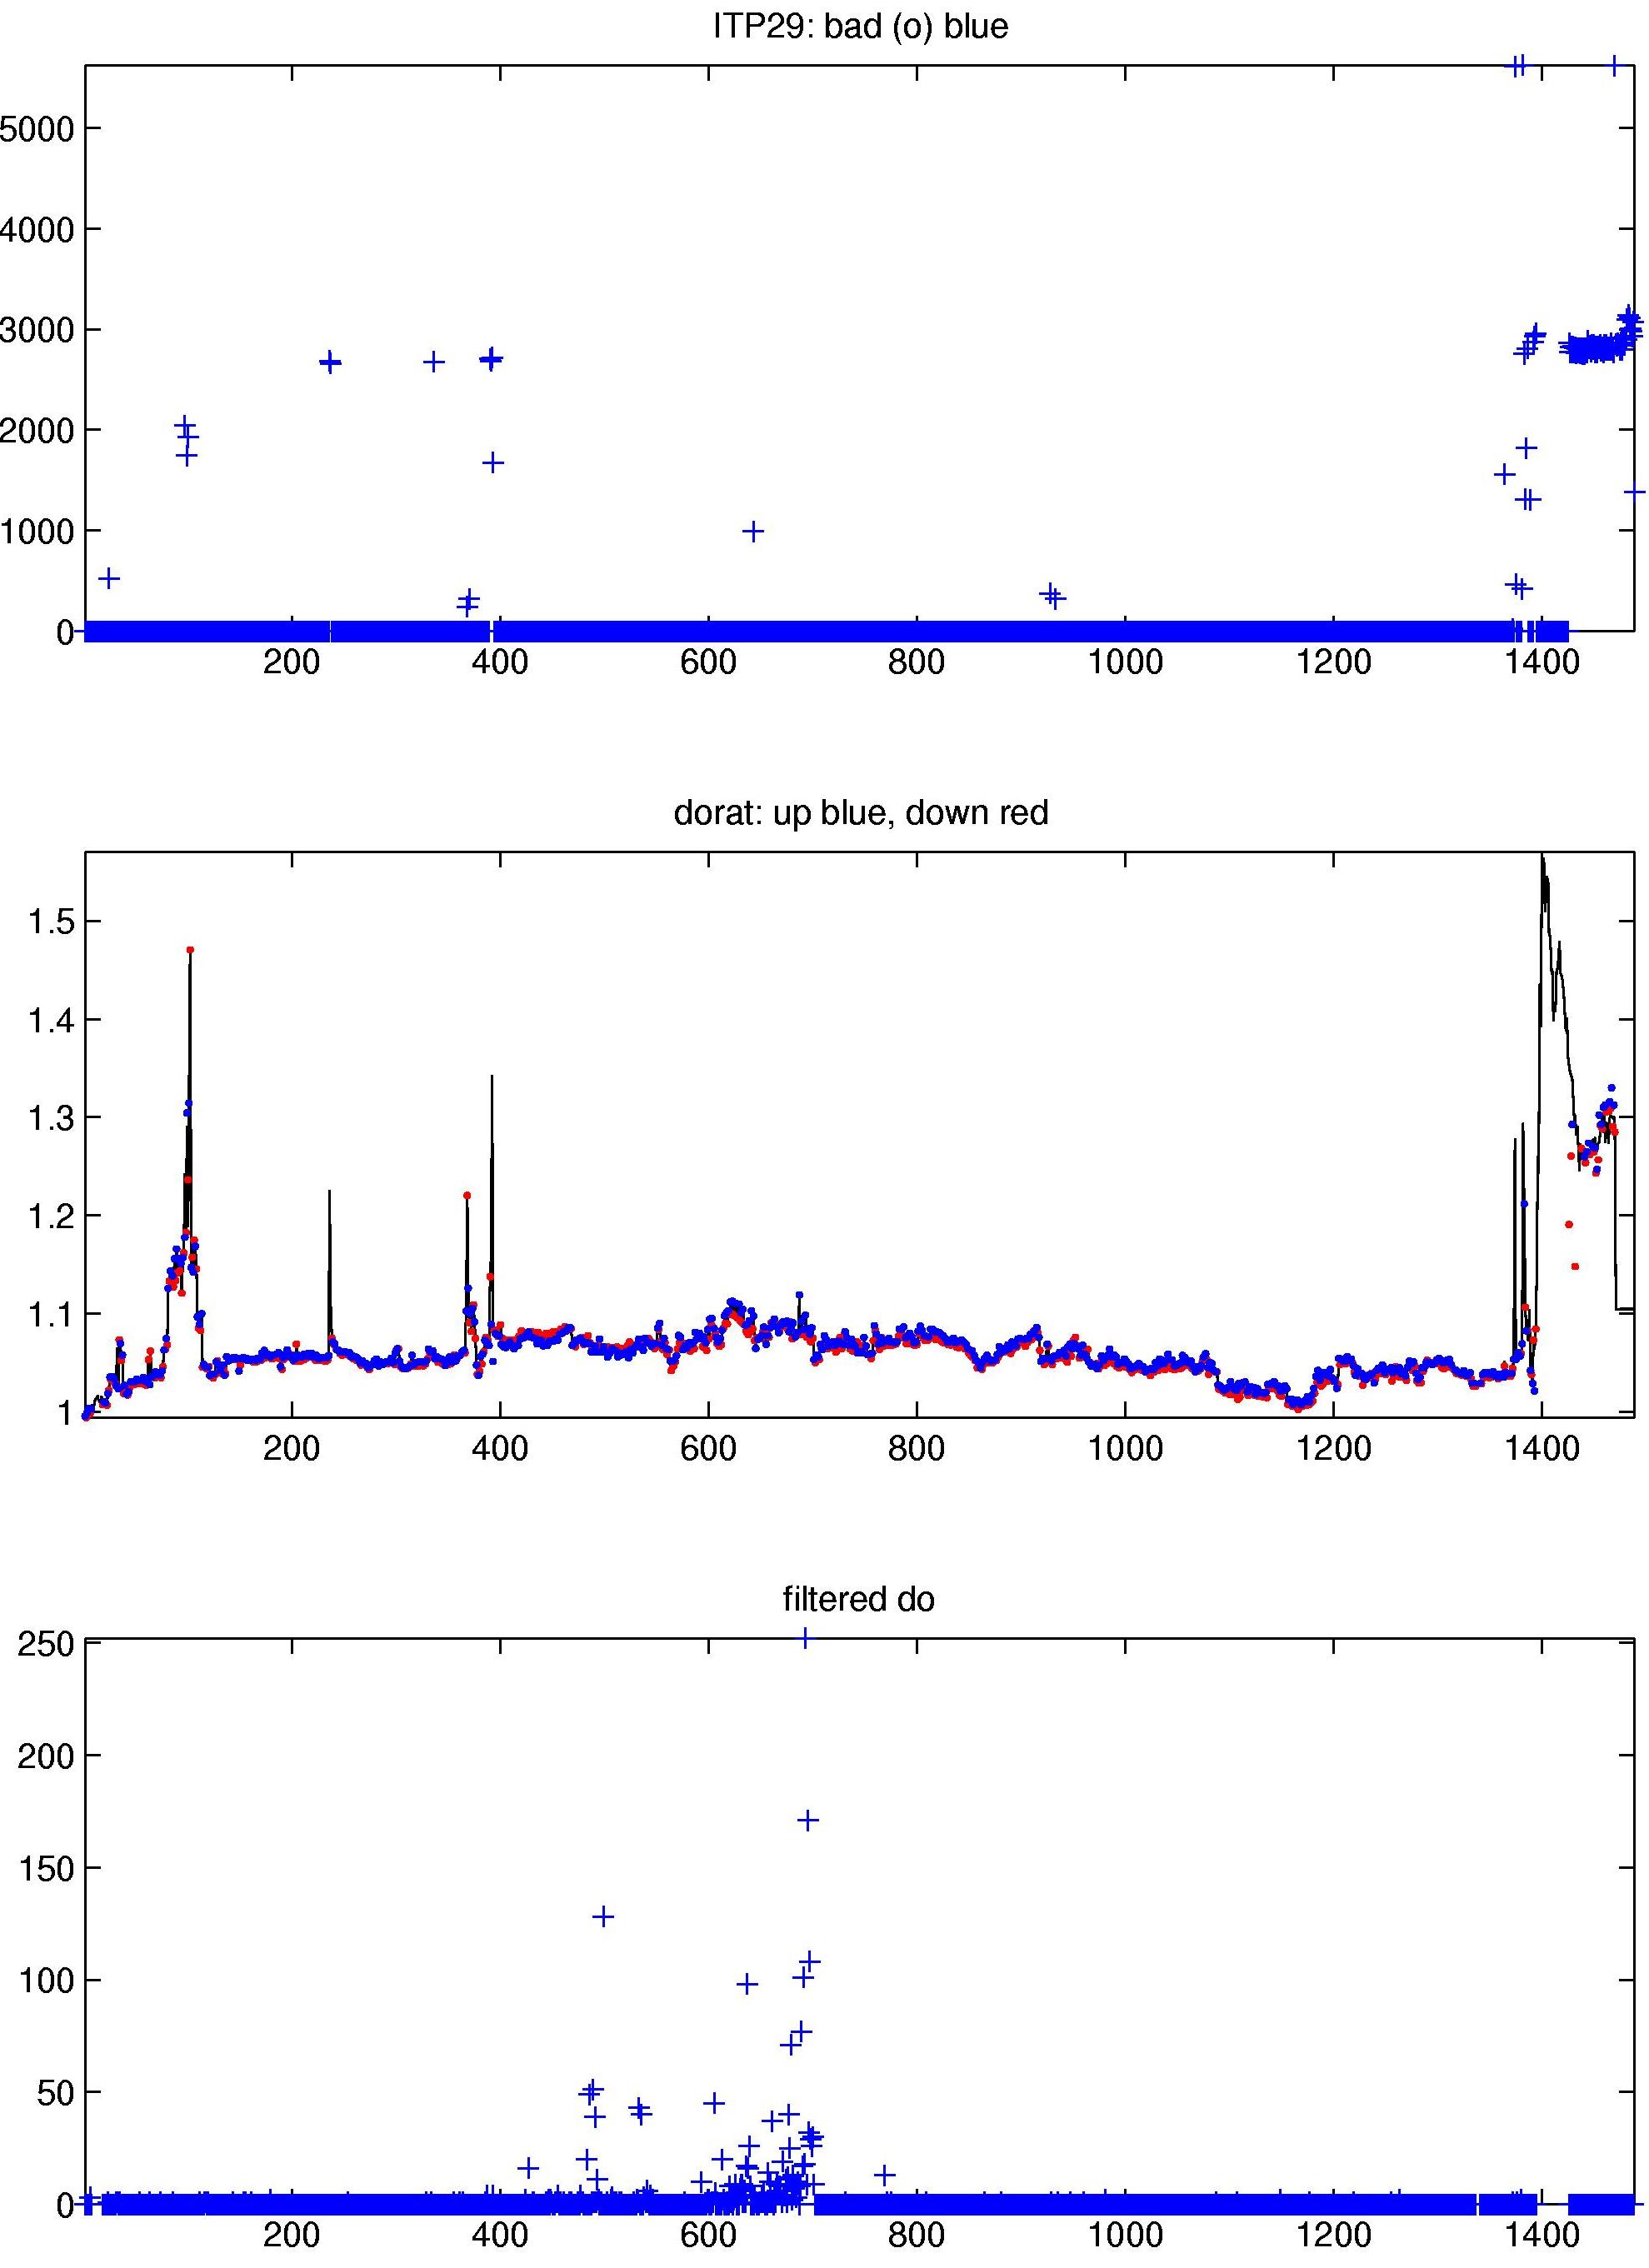
The 1489 profiles that were transmitted from ITP 29 were processed according to the procedures described in the ITP Updated Data Processing Procedures. The processing parameters for ITP 29 are shown in the figures to the right. The processing parameters for this ITP are shown in the figures to the right.
As usual, some conductivity (salinity) data were affected by biofouling or similar glitches. Aside from a few minor glitches, major biofouling was concentrated around two events: one soon after launch (starting with profile 7), the second towards the end of the record (starting around prof 1336). The first event was very short, while the second, related to the ITP drifting into waters shallower than 750m, was more spread out. Both were associated with major calibration changes as well.
Thermohaline staircases were present for a large portion of the time series, enabling CTD lag corrections. The lags were in the typical range found for previous systems. During manual editing, thermal lag corrections were dialed back somewhat to remove overcompensation. The combination of Alpha = 0.11 and Tao = 4.5 worked well in most cases. A few instances of the thermistor lag corrections ("tlag" in the code) as well as the conductivity - temperature time offsets ("cshift") were modified to better adjust sharp spikes at the top/bottom of stair cases.
For most of the record, the conductivity adjustment ("rat") remained fairly flat and close to unity. In fact, from profiles 40 through 1200, this ITP record was remarkably clean. However, there were two periods with large calibration adjustments, presumably triggered by conductivity cell contaminations. The second, longer event was clearly related to the ITP drifting in and out of shallow (<750m) waters near the northern coast of Greenland. After repeated iterations, a significant number of conductivity and oxygen profiles were edited out. For the very last profiles, even temperature showed large up/down hysteresis and was removed. The first event soon after deployment triggered an even larger calibration adjustment. Some conductivity and oxygen profiles right around the largest calibration changes could not be aligned to realistic shapes; it seems likely that the contamination was so severe that calibration changes occurred even within the profile, which our single-factor calibration adjustment can not handle. However, some tens of profiles following the calibration spike still had increased conductivity calibration numbers, yet their data looked very reasonable, suggesting that our calibration mechanism worked well there.
See the Data Products tab to the left for descriptions of the three levels (I, II, III) of data processing and to access all data.
