ITP35 Data Processing
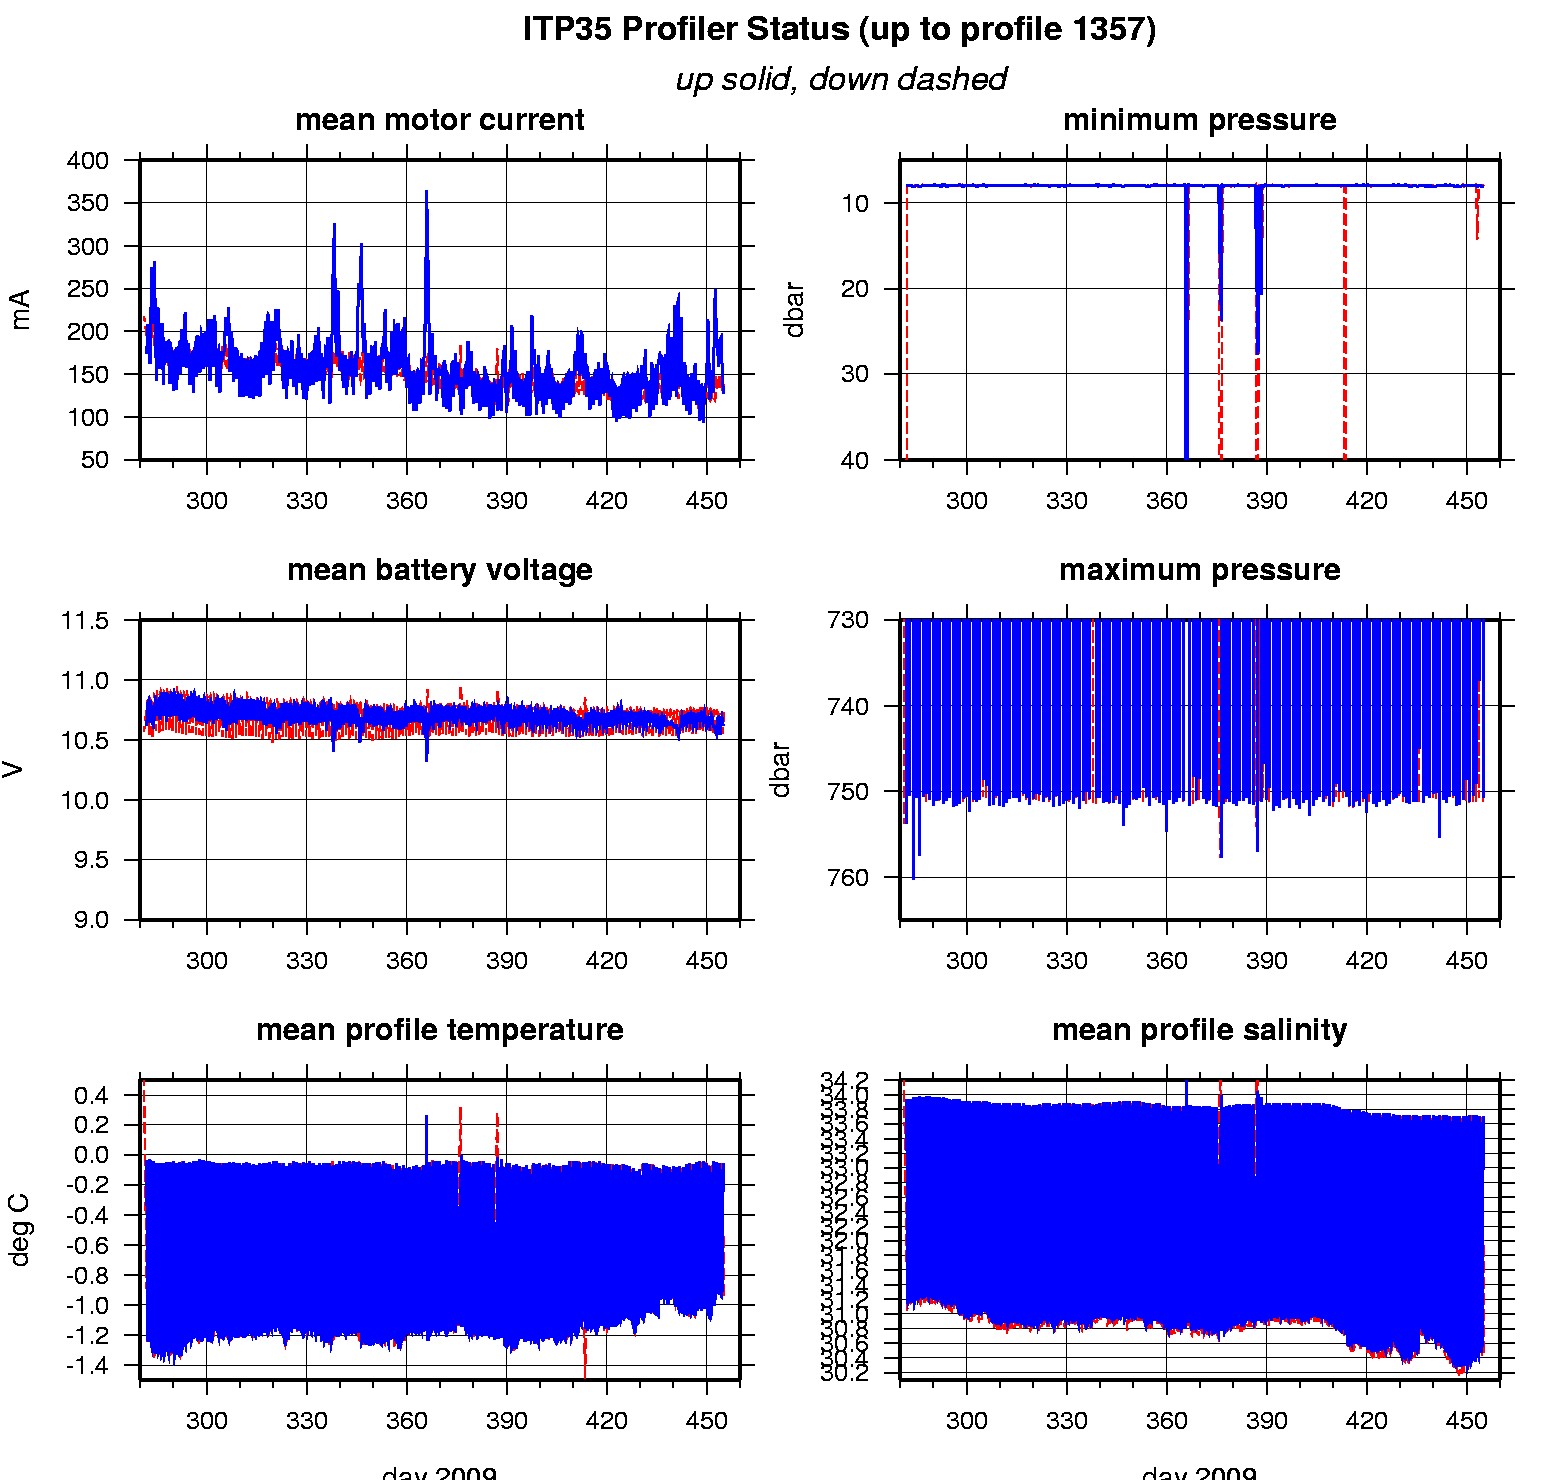
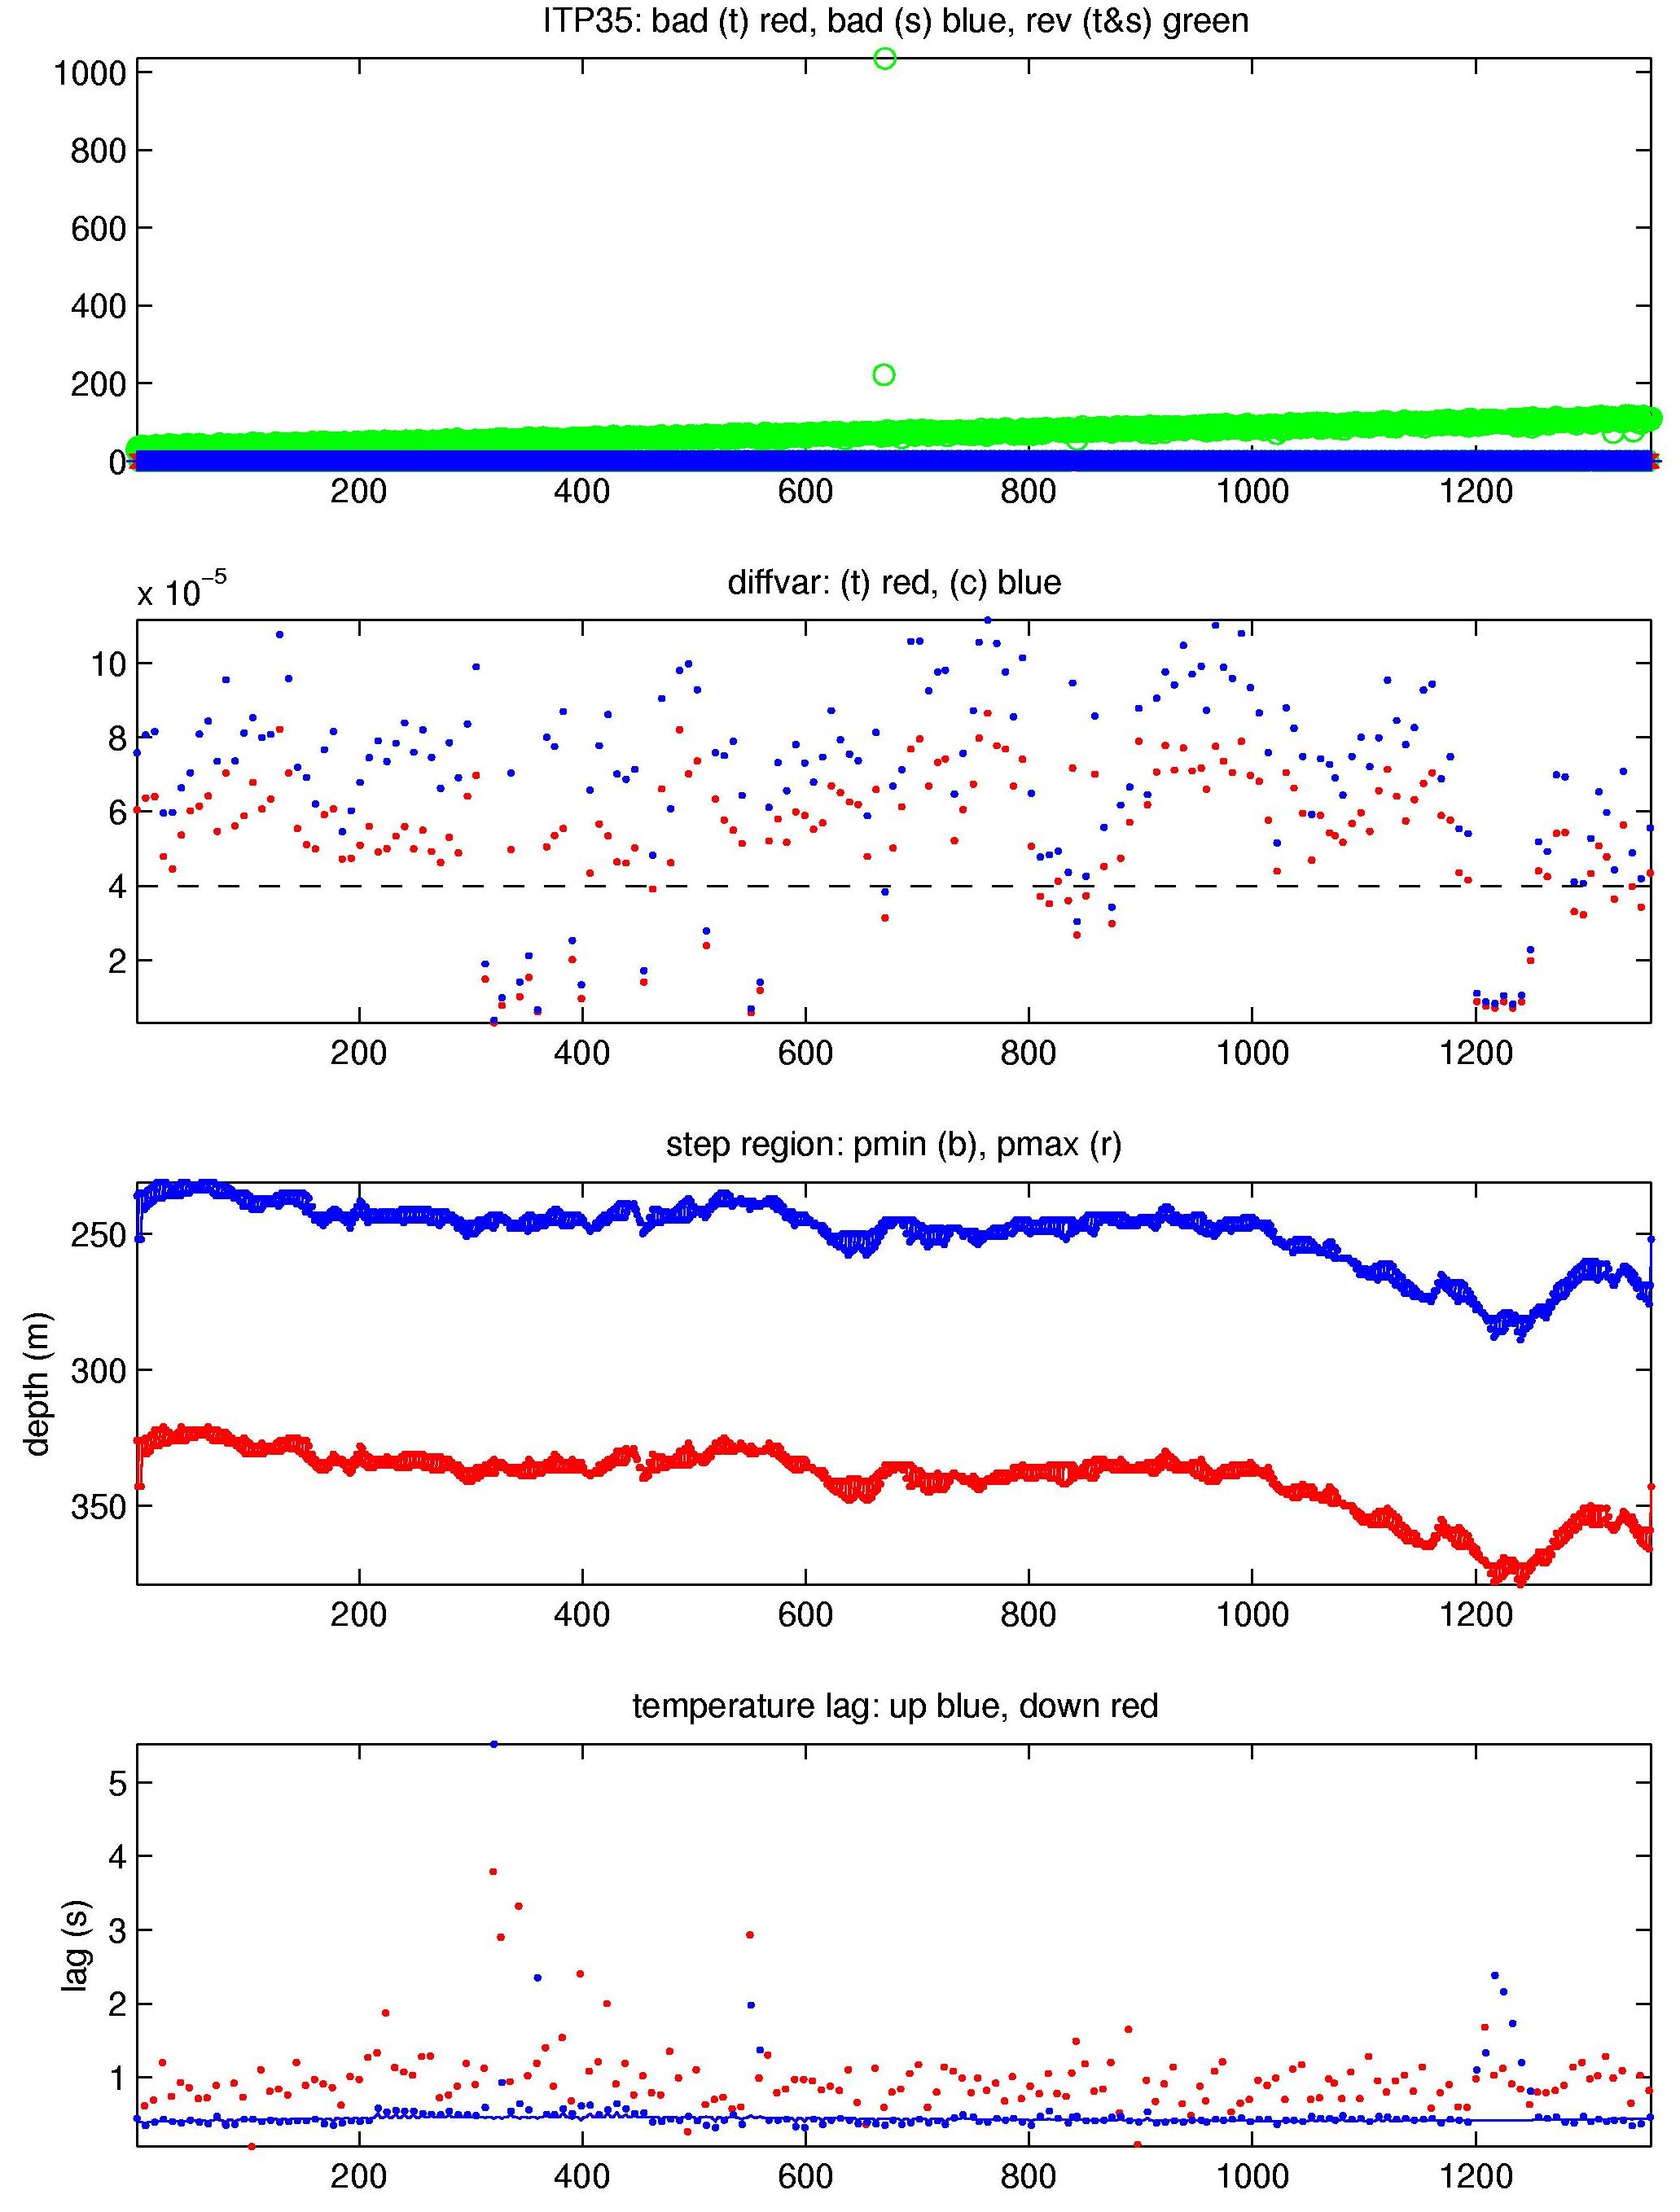
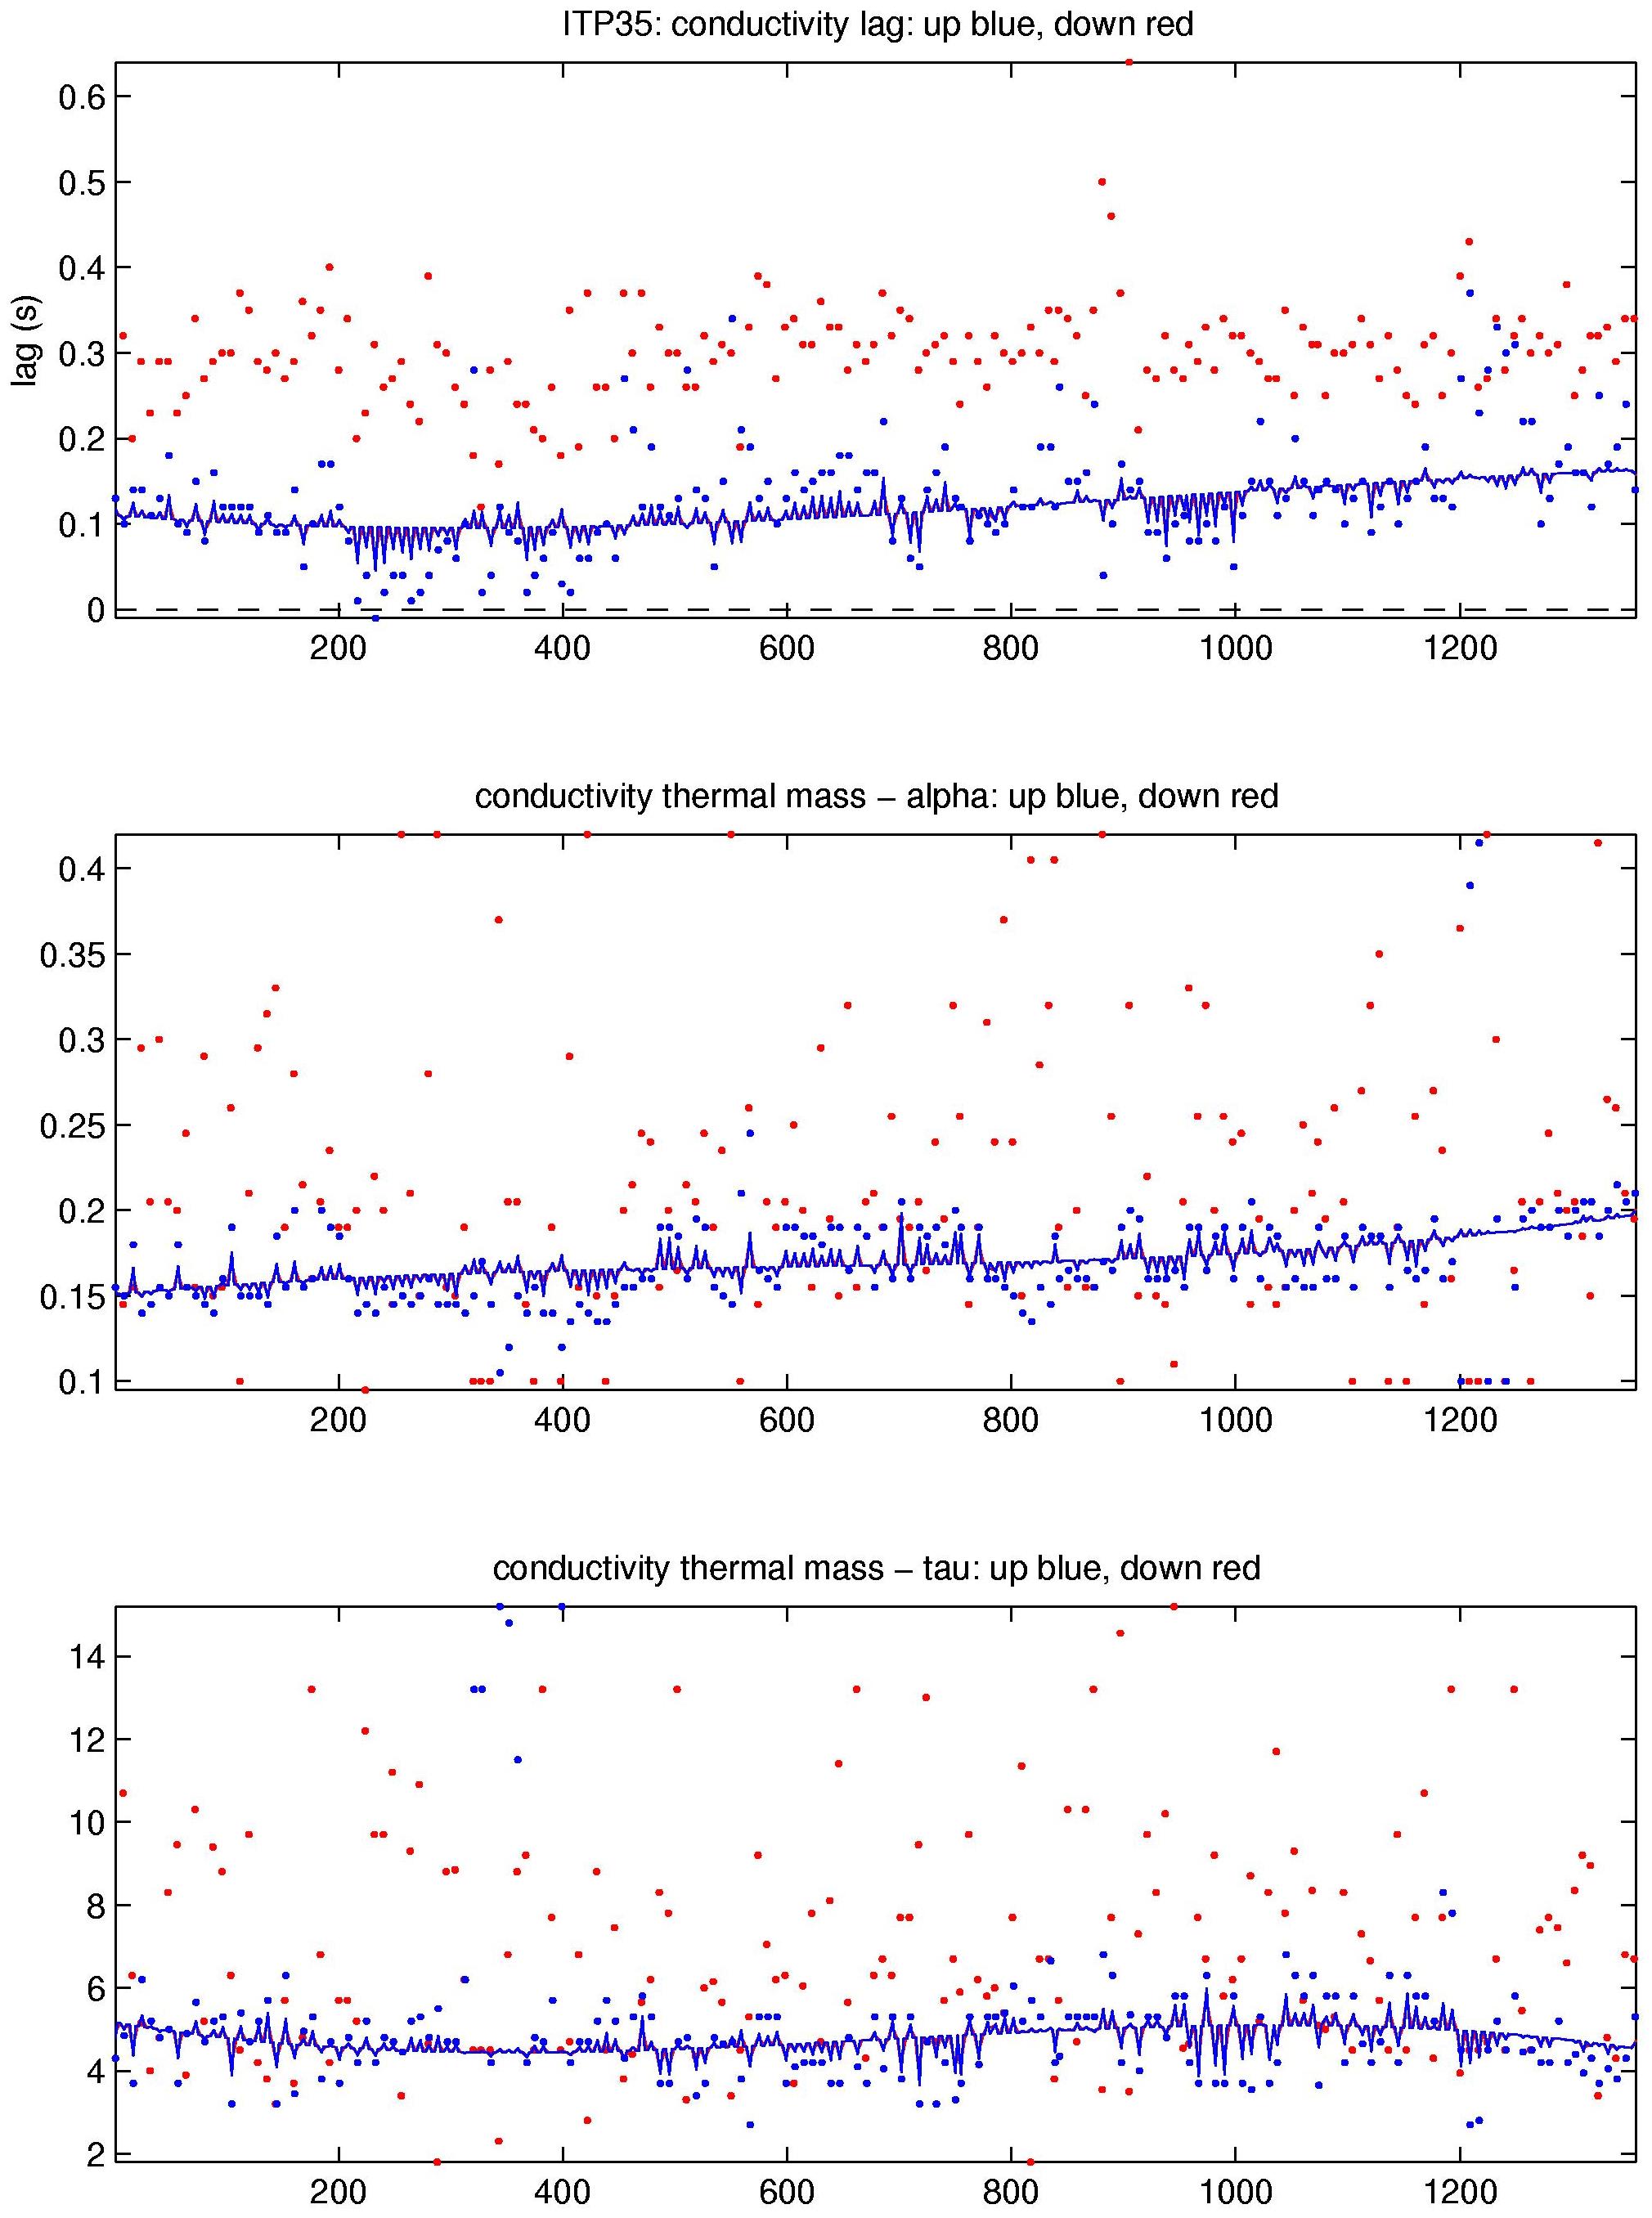
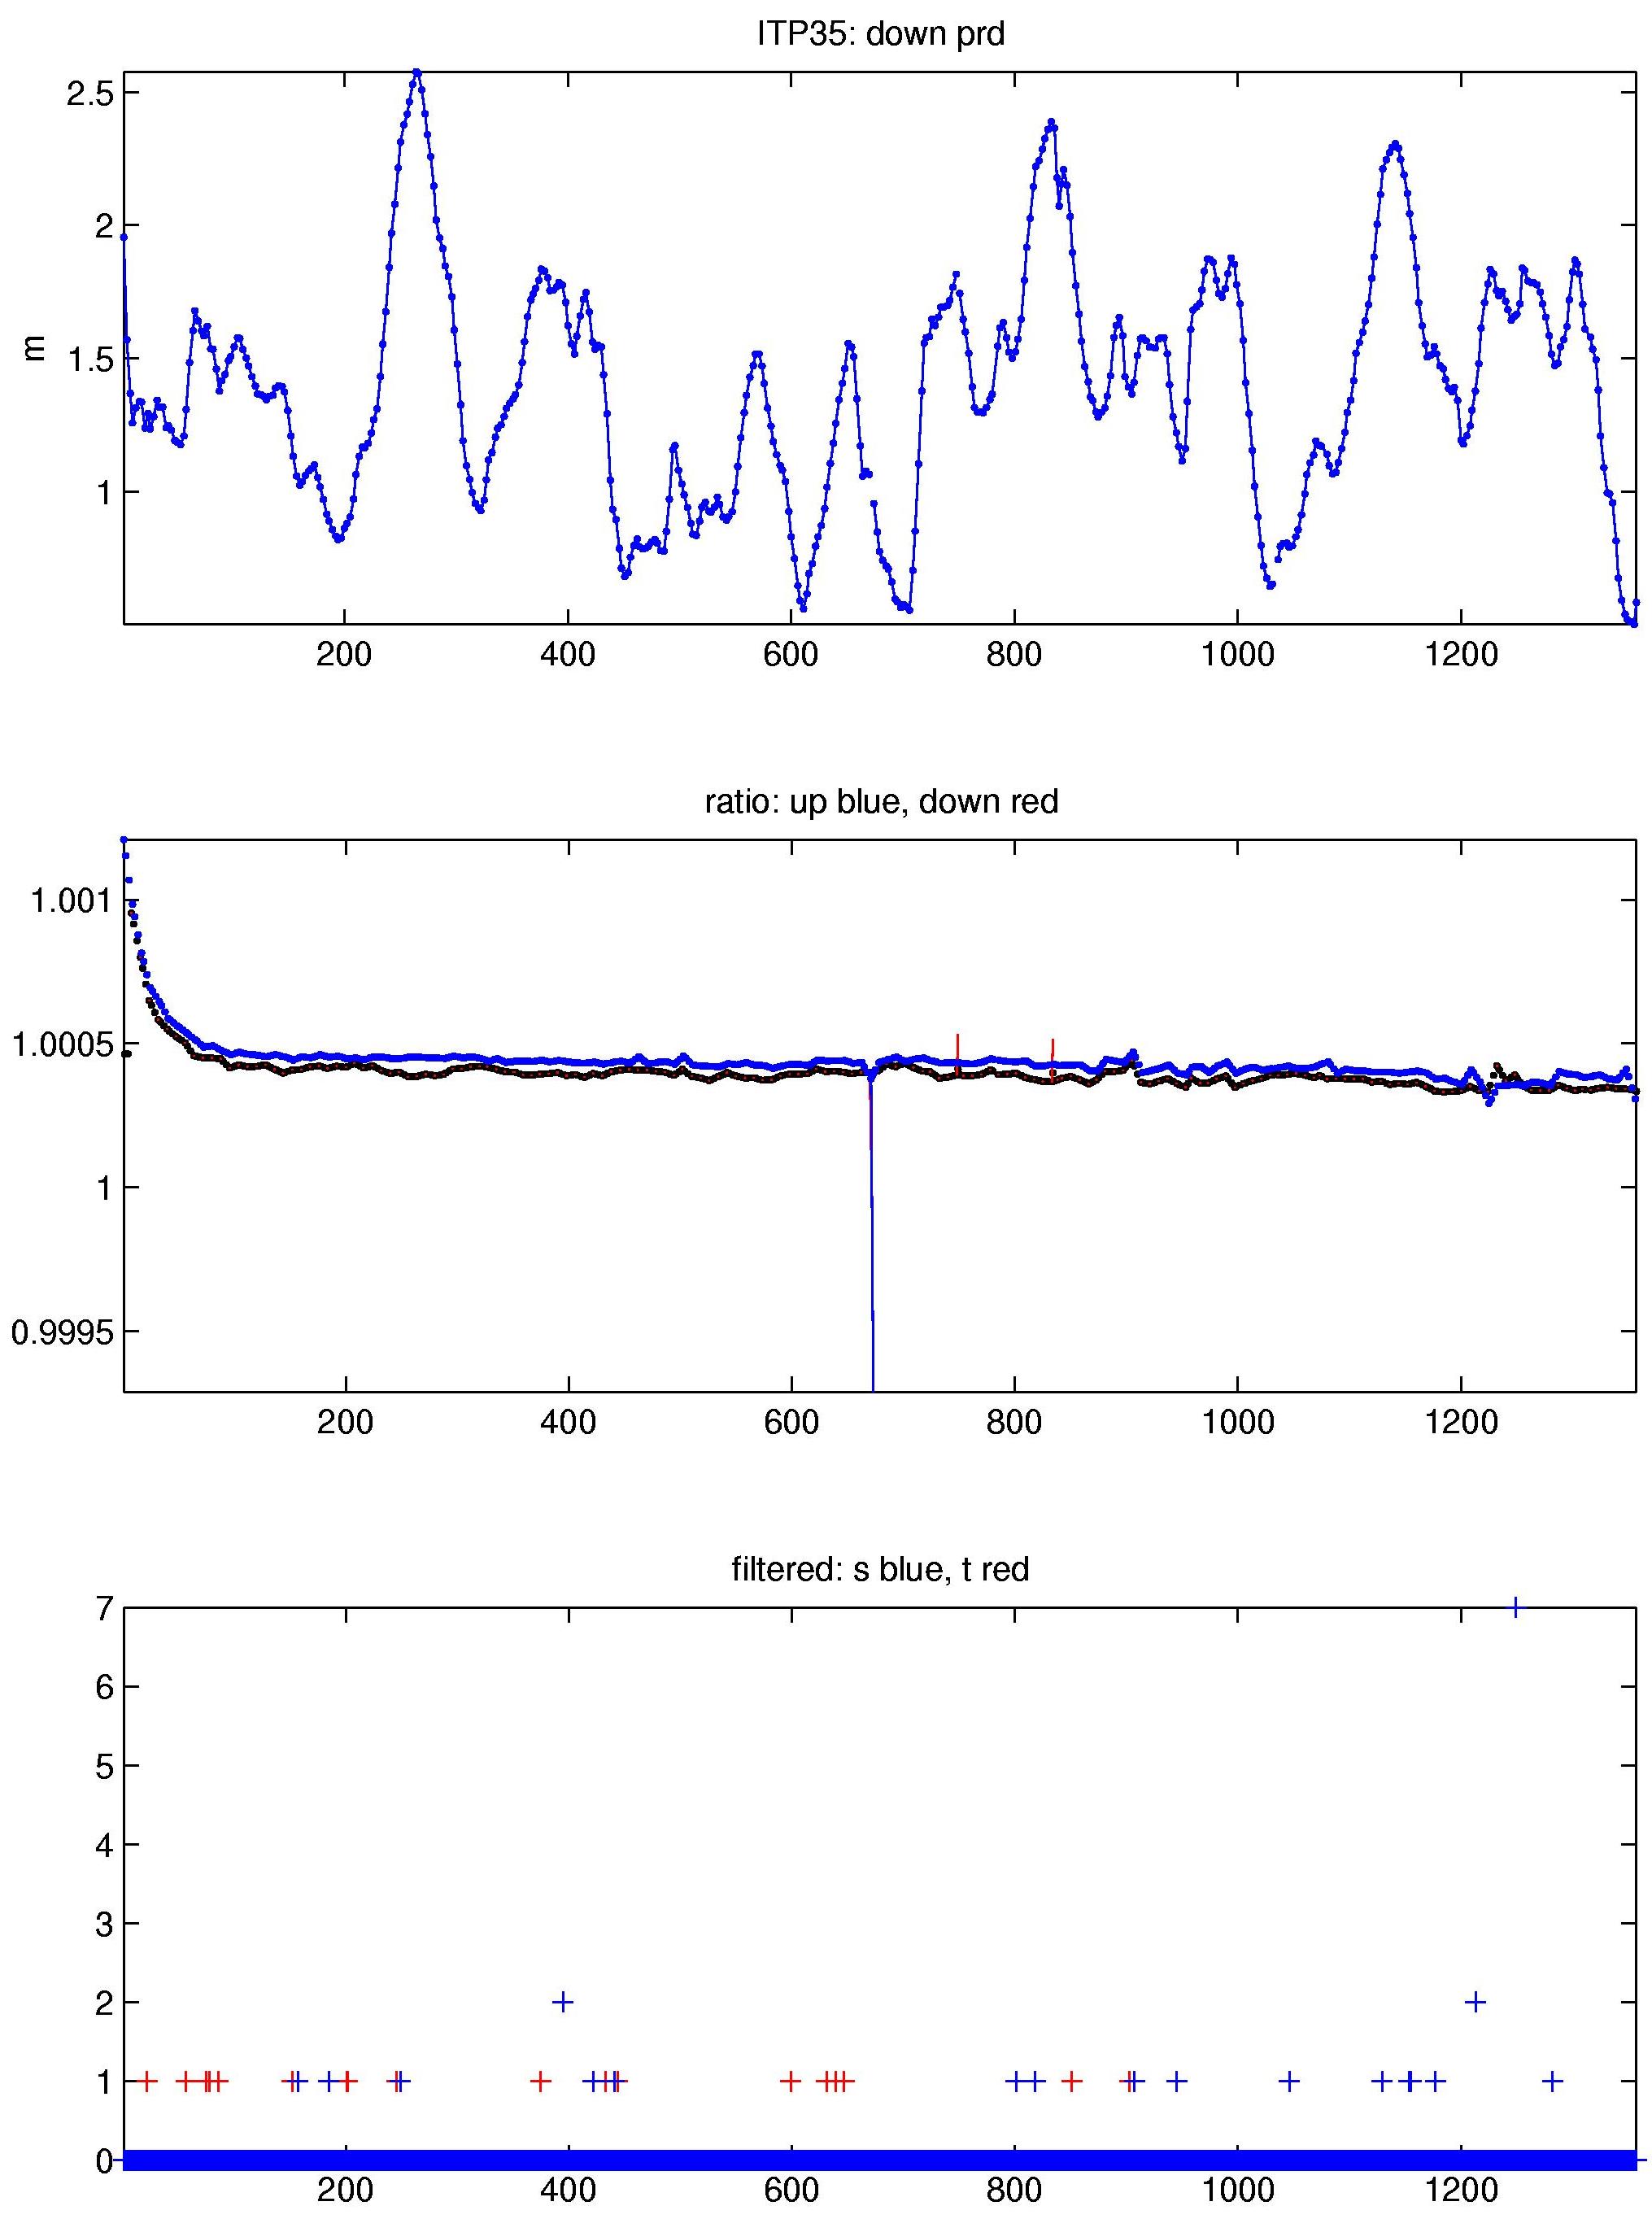
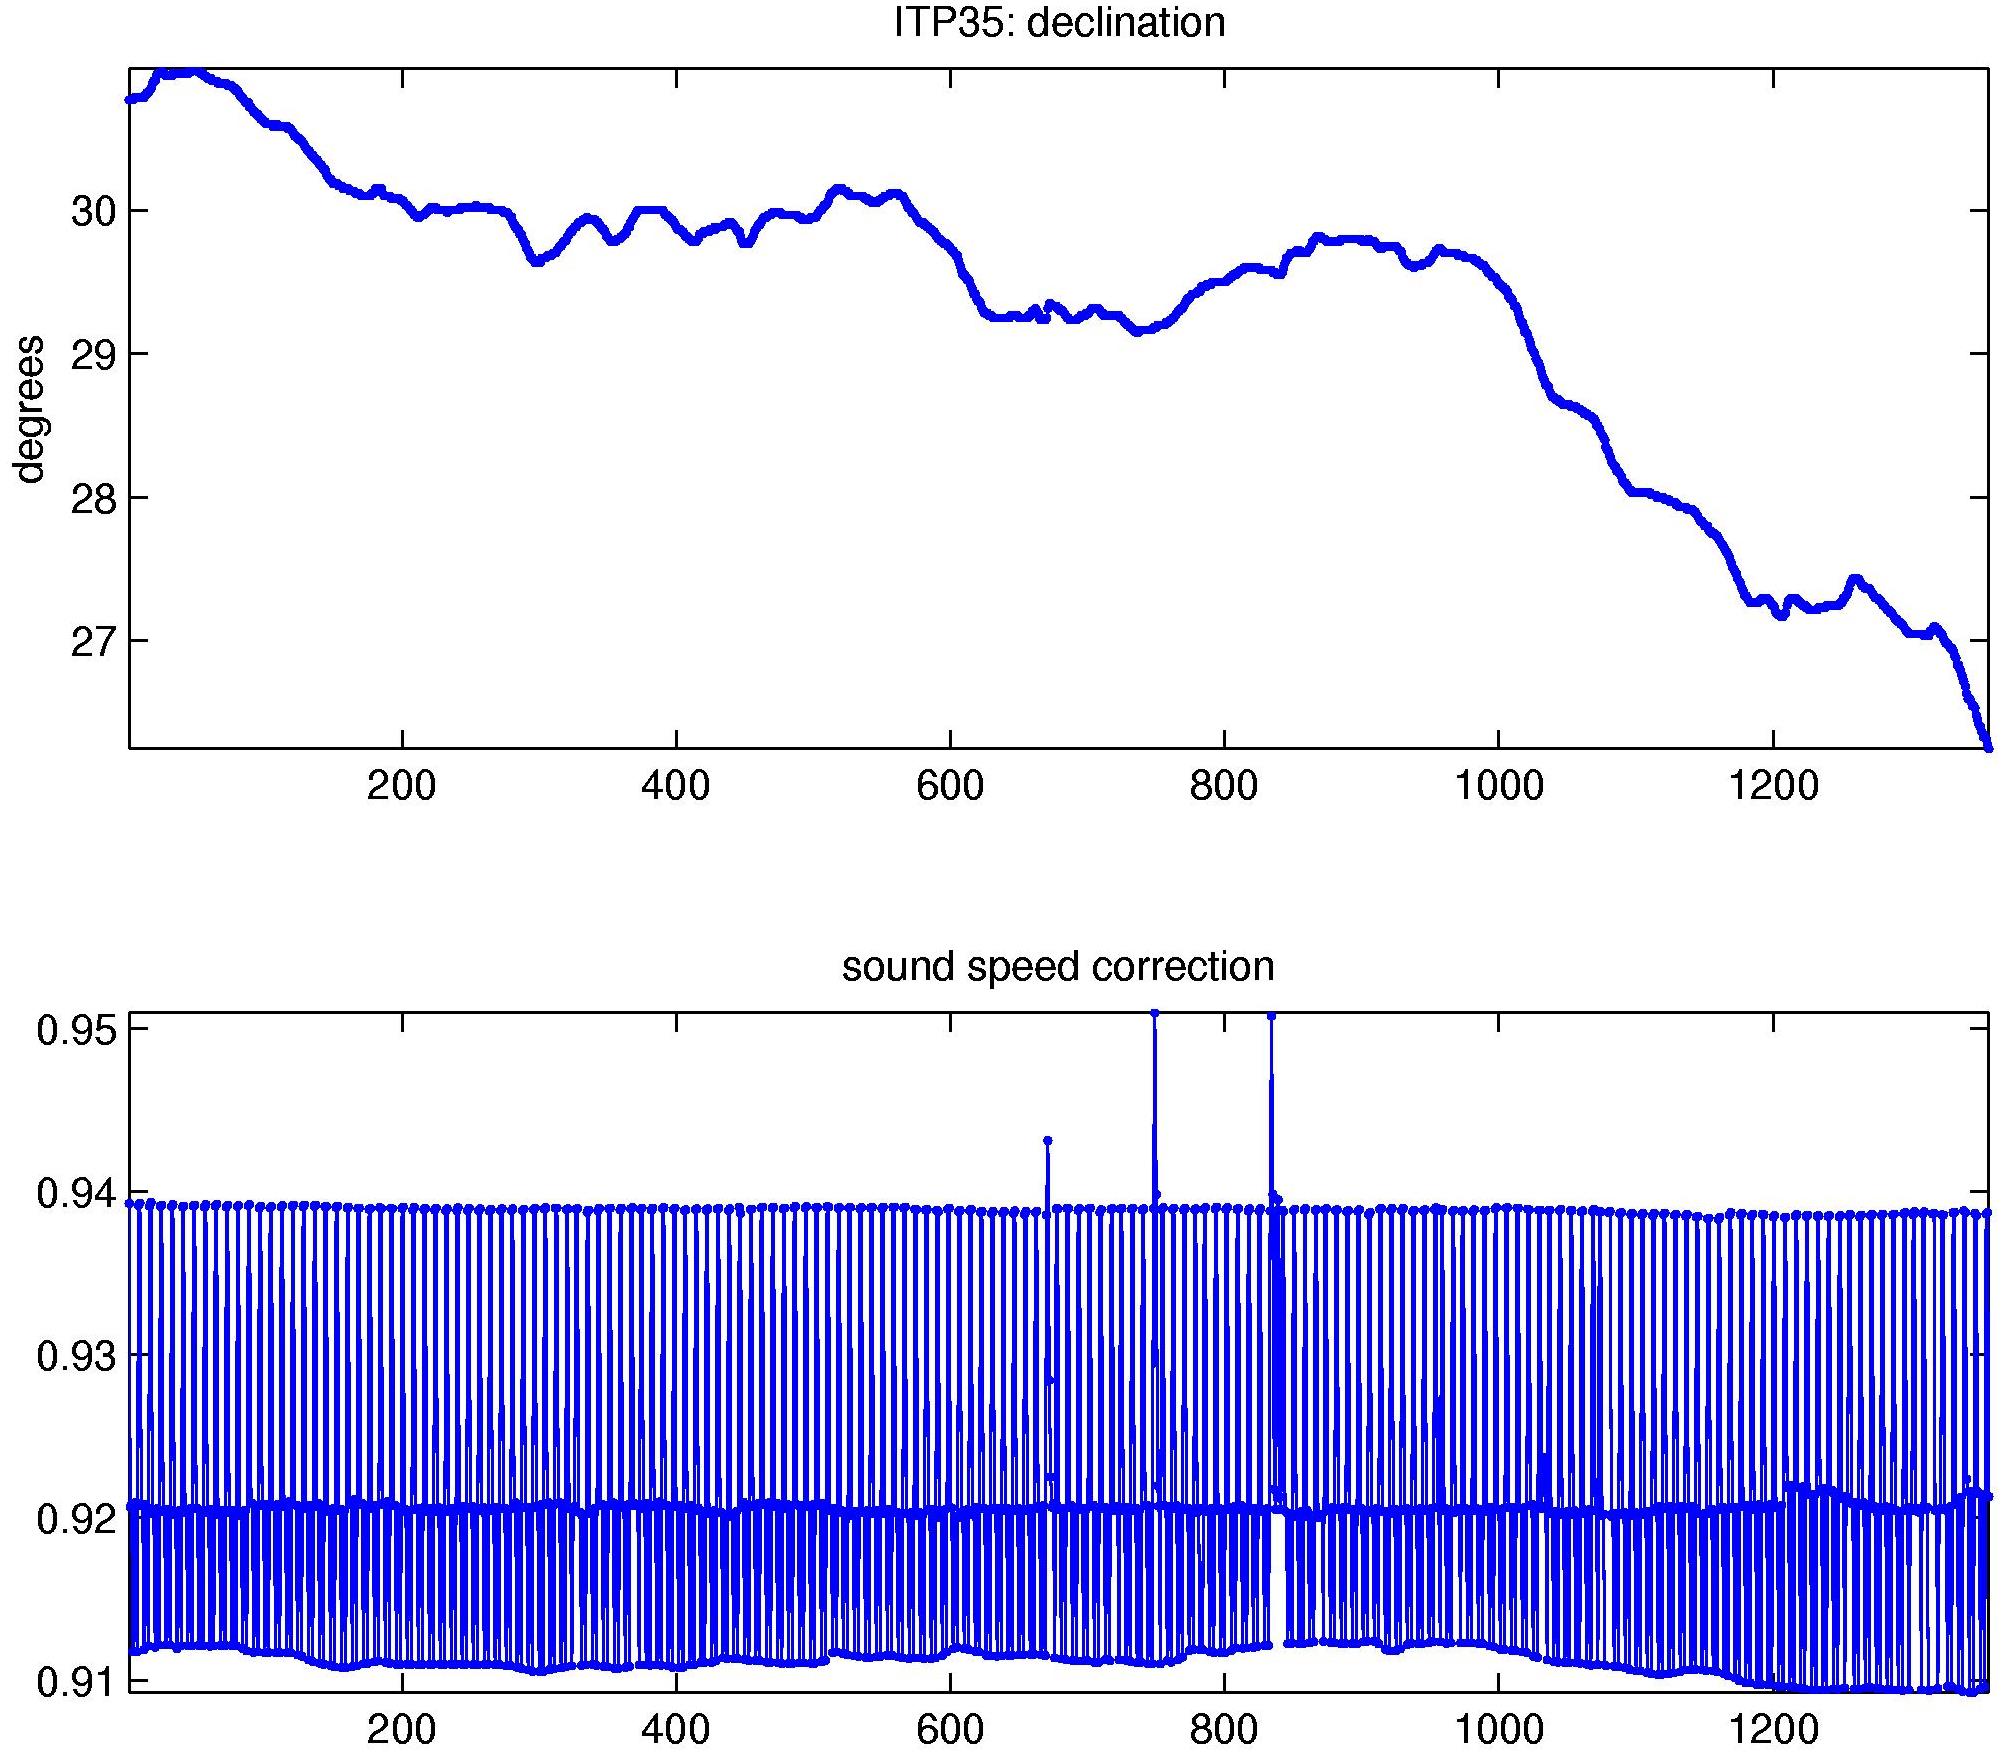
The 1357 CTD profiles that were recovered from the ITP flash card were processed according to the procedures described in the ITP Updated Data Processing Procedures, and velocity as described in Cole et al. (2014). The processing parameters for ITP 35 are shown in the figures to the right. The profiler had only a few instances where it had trouble covering the full vertical extent of the profile and the CTD data were largely free of icing and biofouling.
Thermohaline staircases were present throughout the time series, enabling CTD lag corrections. The CTD sensors appeared to be very stable throughout the year-long deployment, all of the lags were in the typical range as previous systems, and varied little over time. The potential conductivity adjustment began and took about a week to stabilize with only one significant deviation thereafter.
See the Data Products tab to the left for descriptions of the three levels (I, II, III) of data processing and to access all data.
References:
Cole, S., M.-L. Timmermans, J. Toole, R. Krishfield, F. Thwaites, 2014. Ekman veering, internal waves, and turbulence observed under Arctic sea-ice. Journal of Physical Oceanography, Vol. 44, doi:10.1175/JPO-D-12-0191.1.
