ITP64 Data Processing
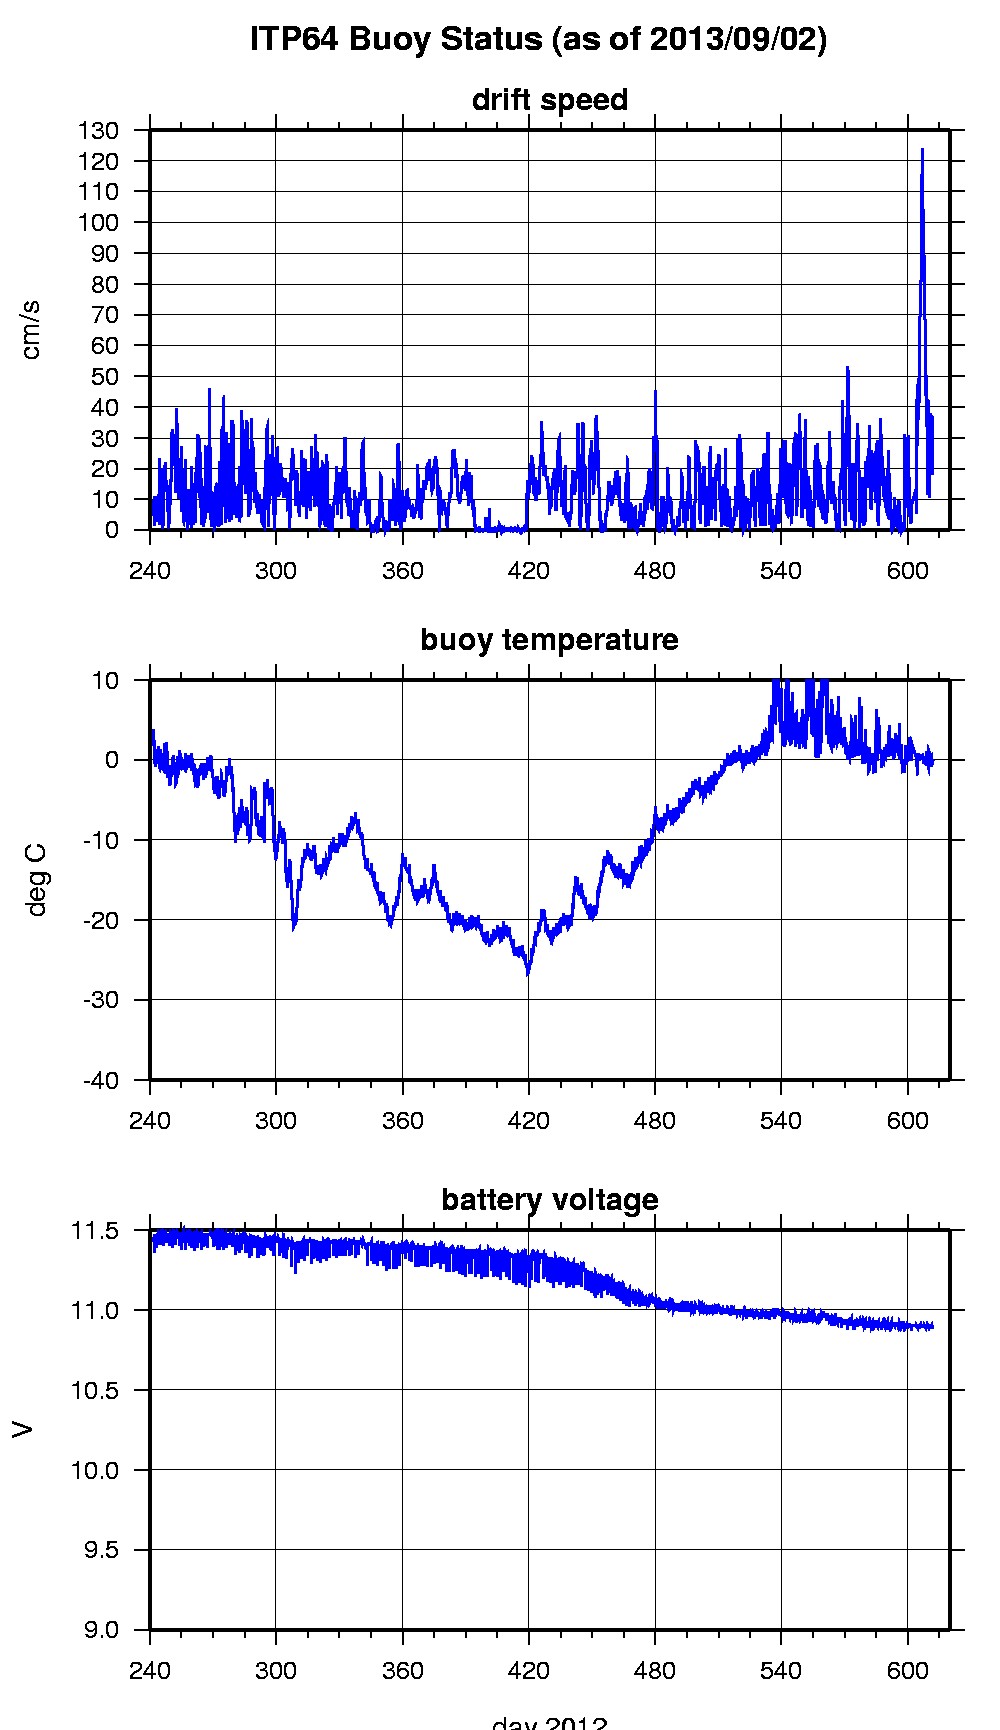
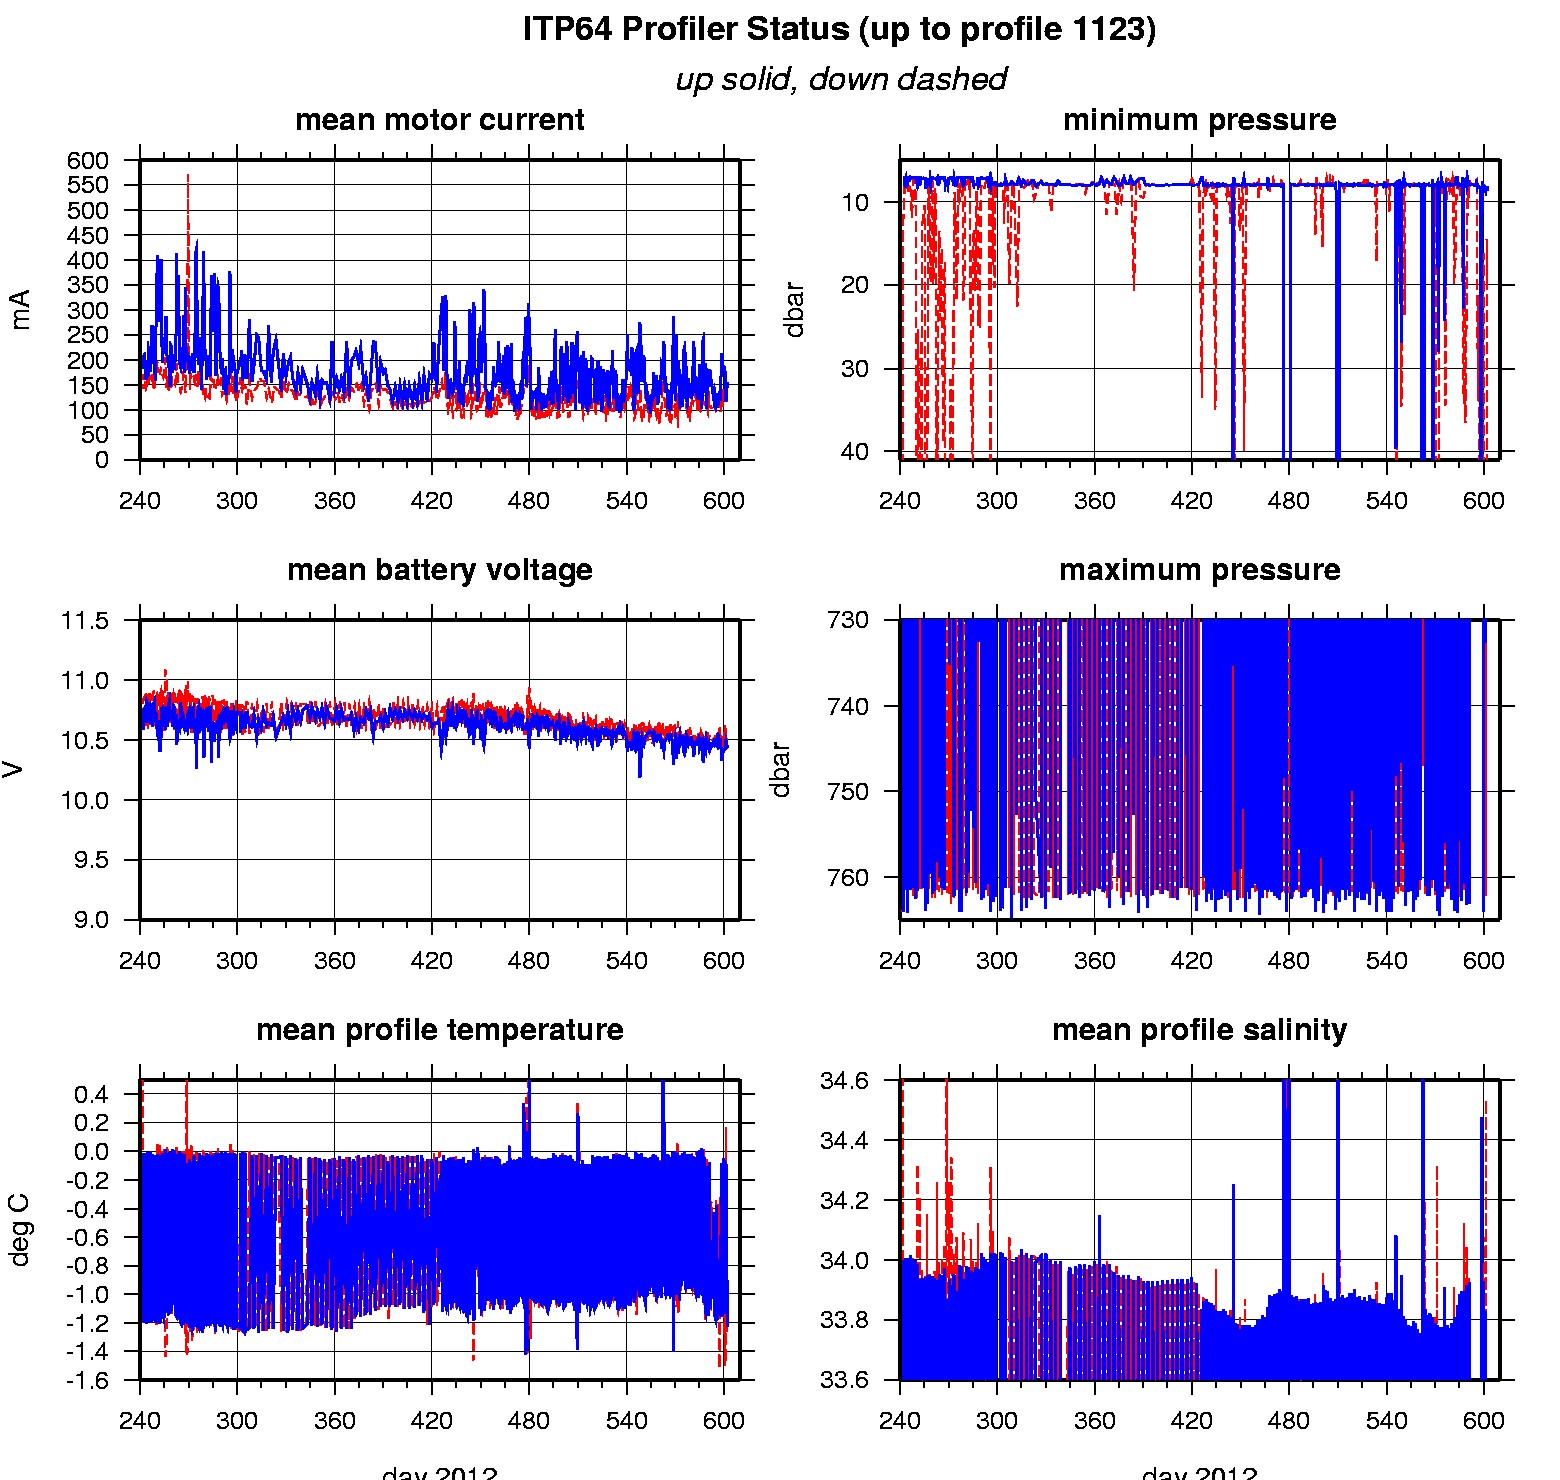
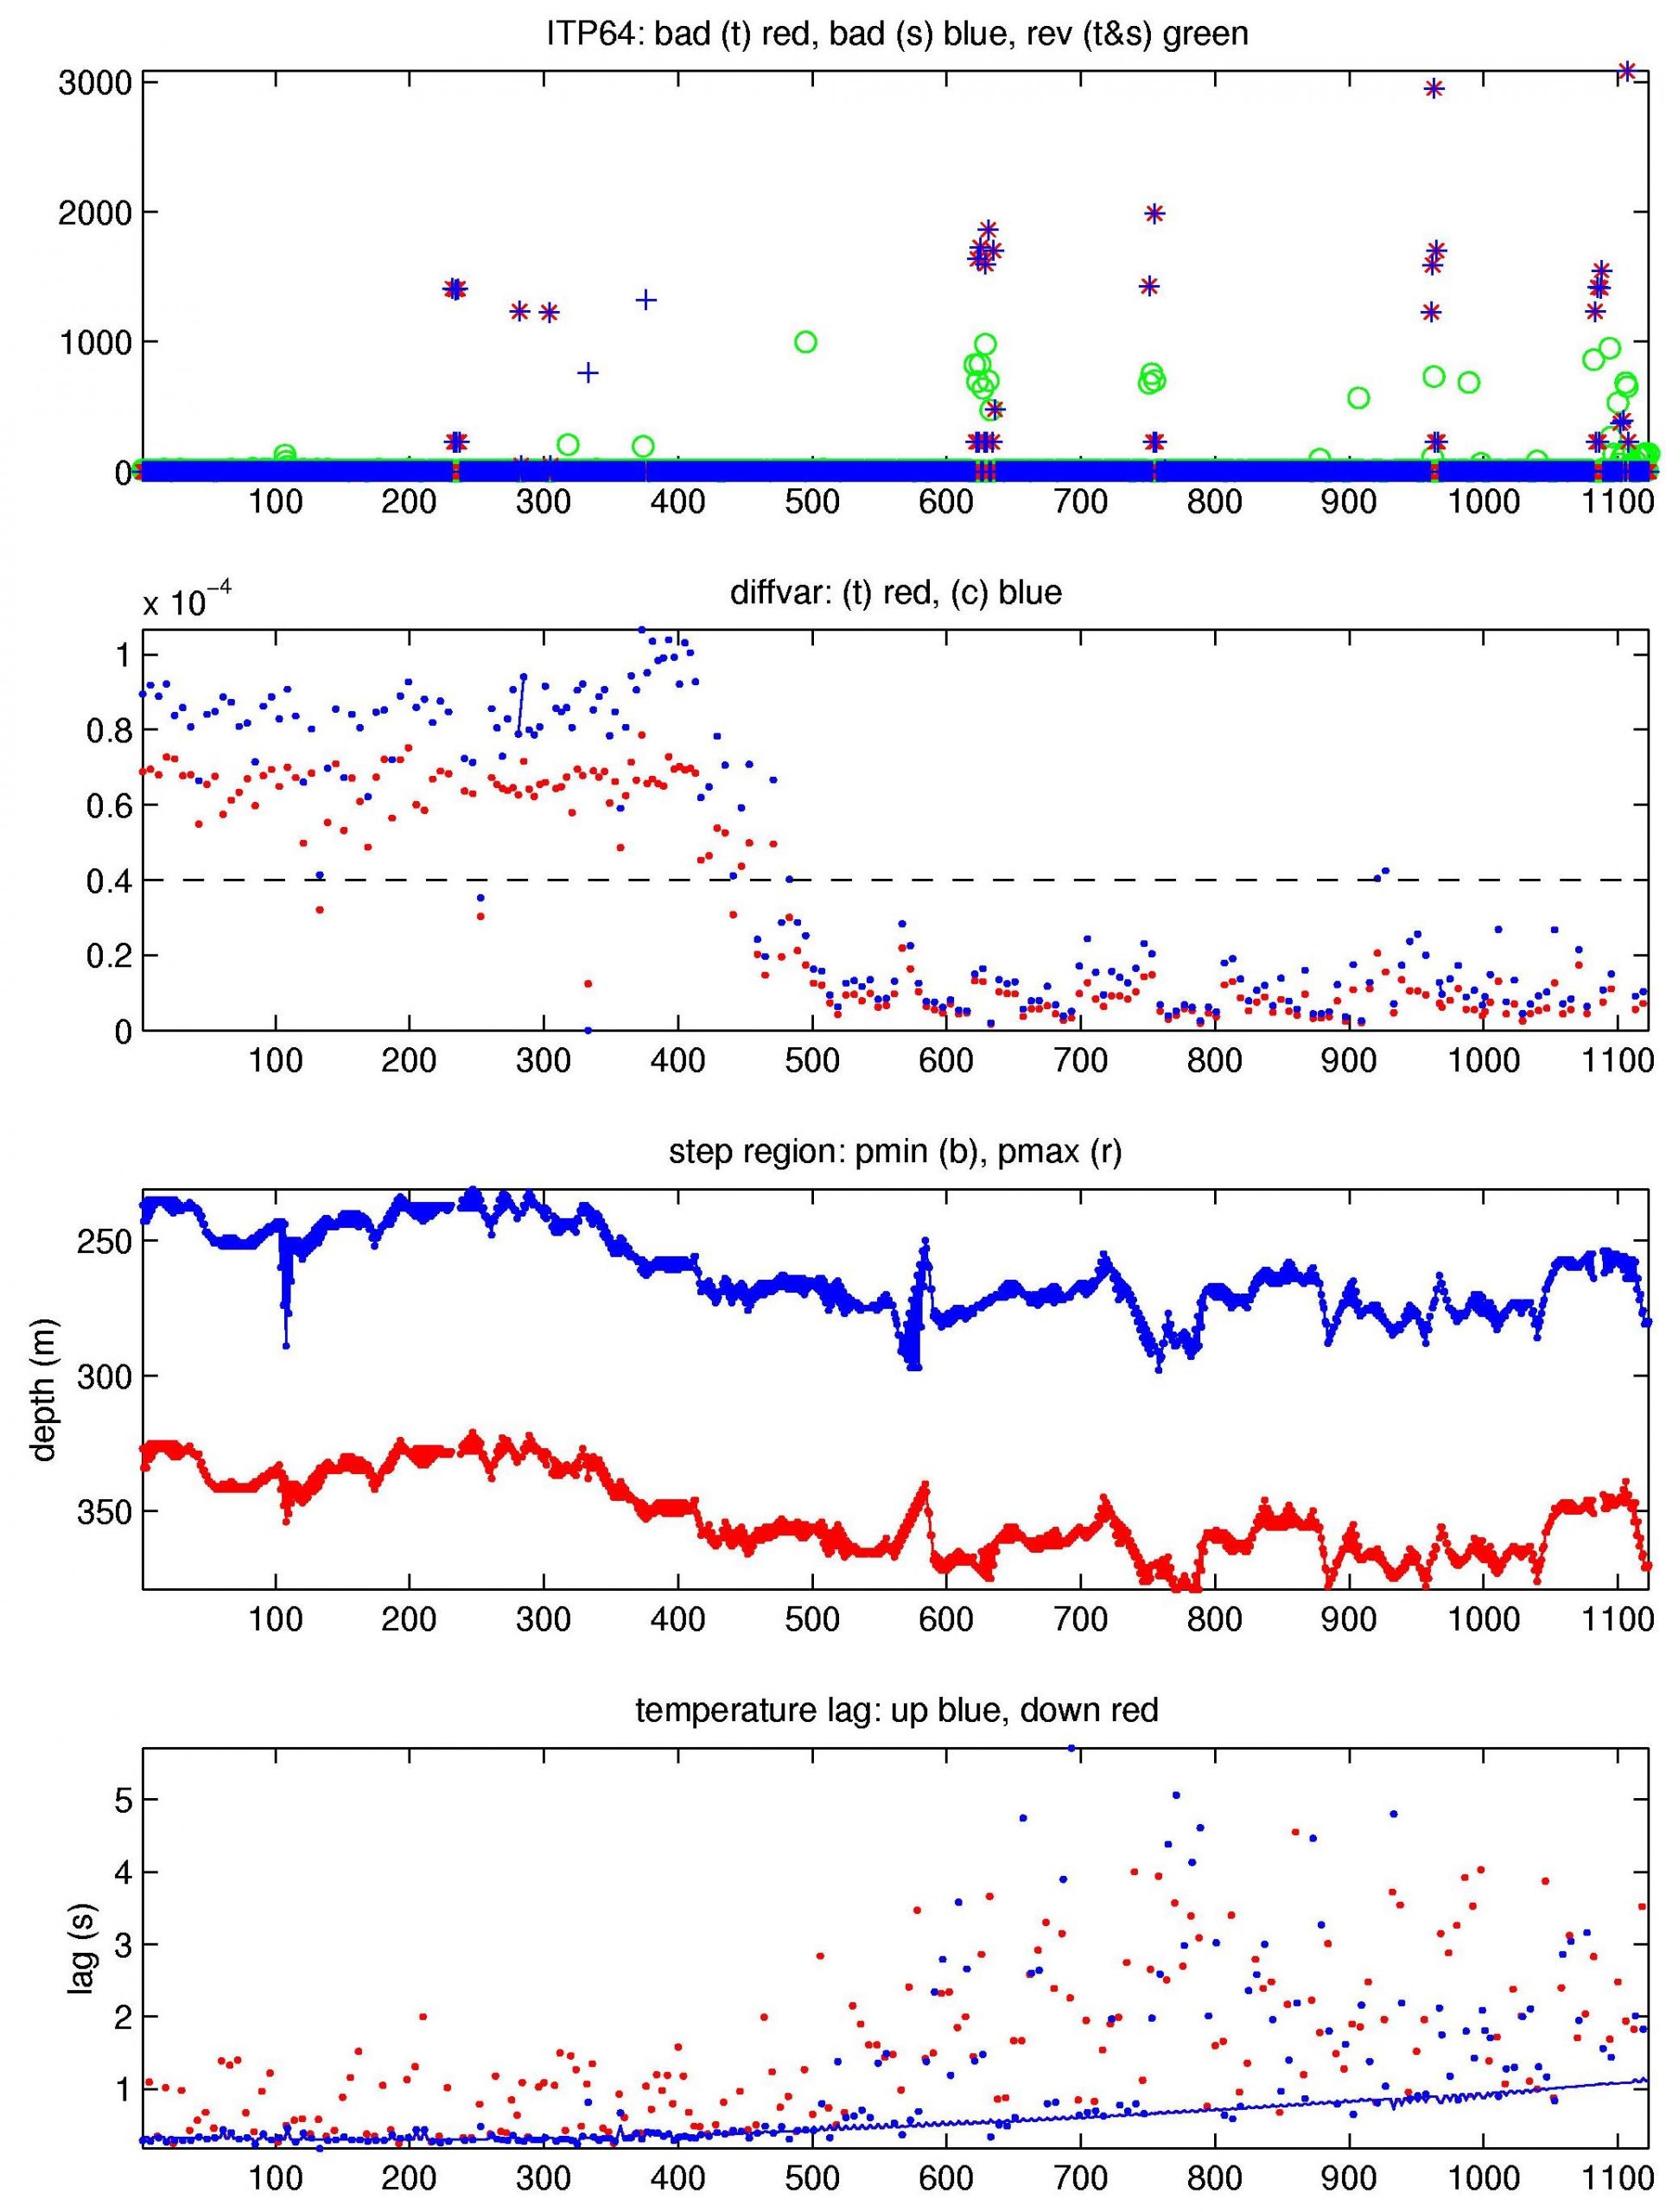
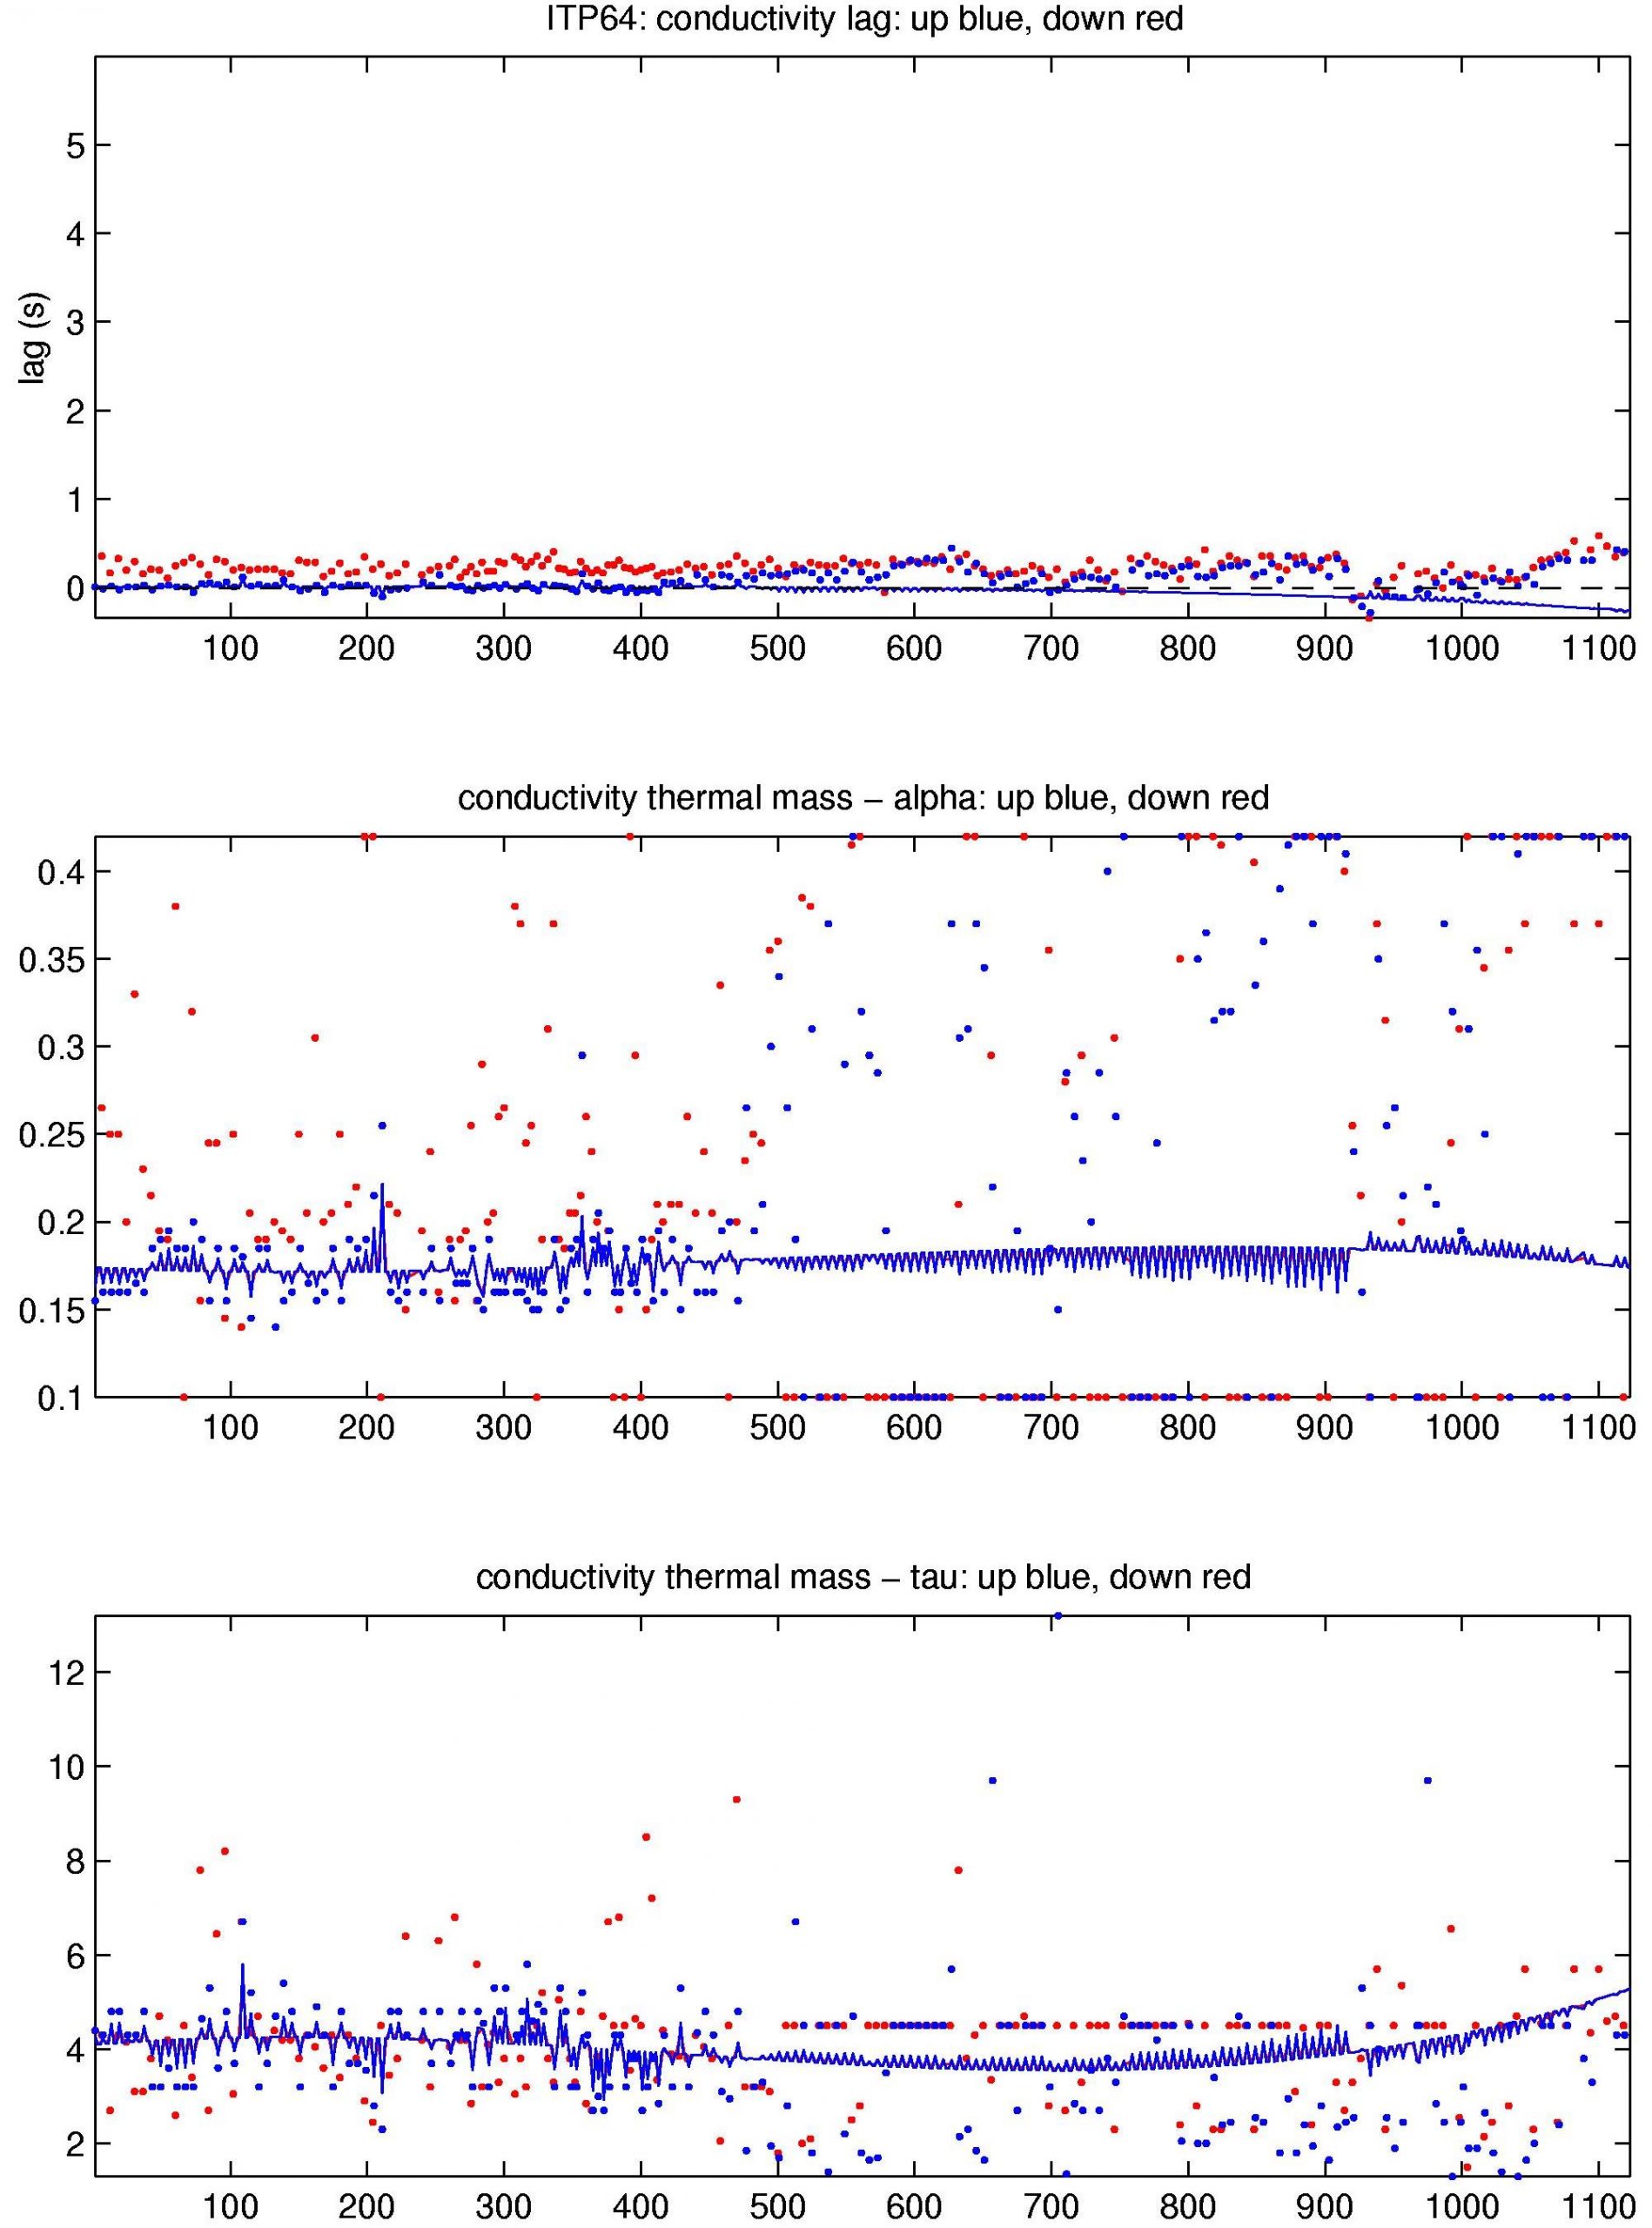
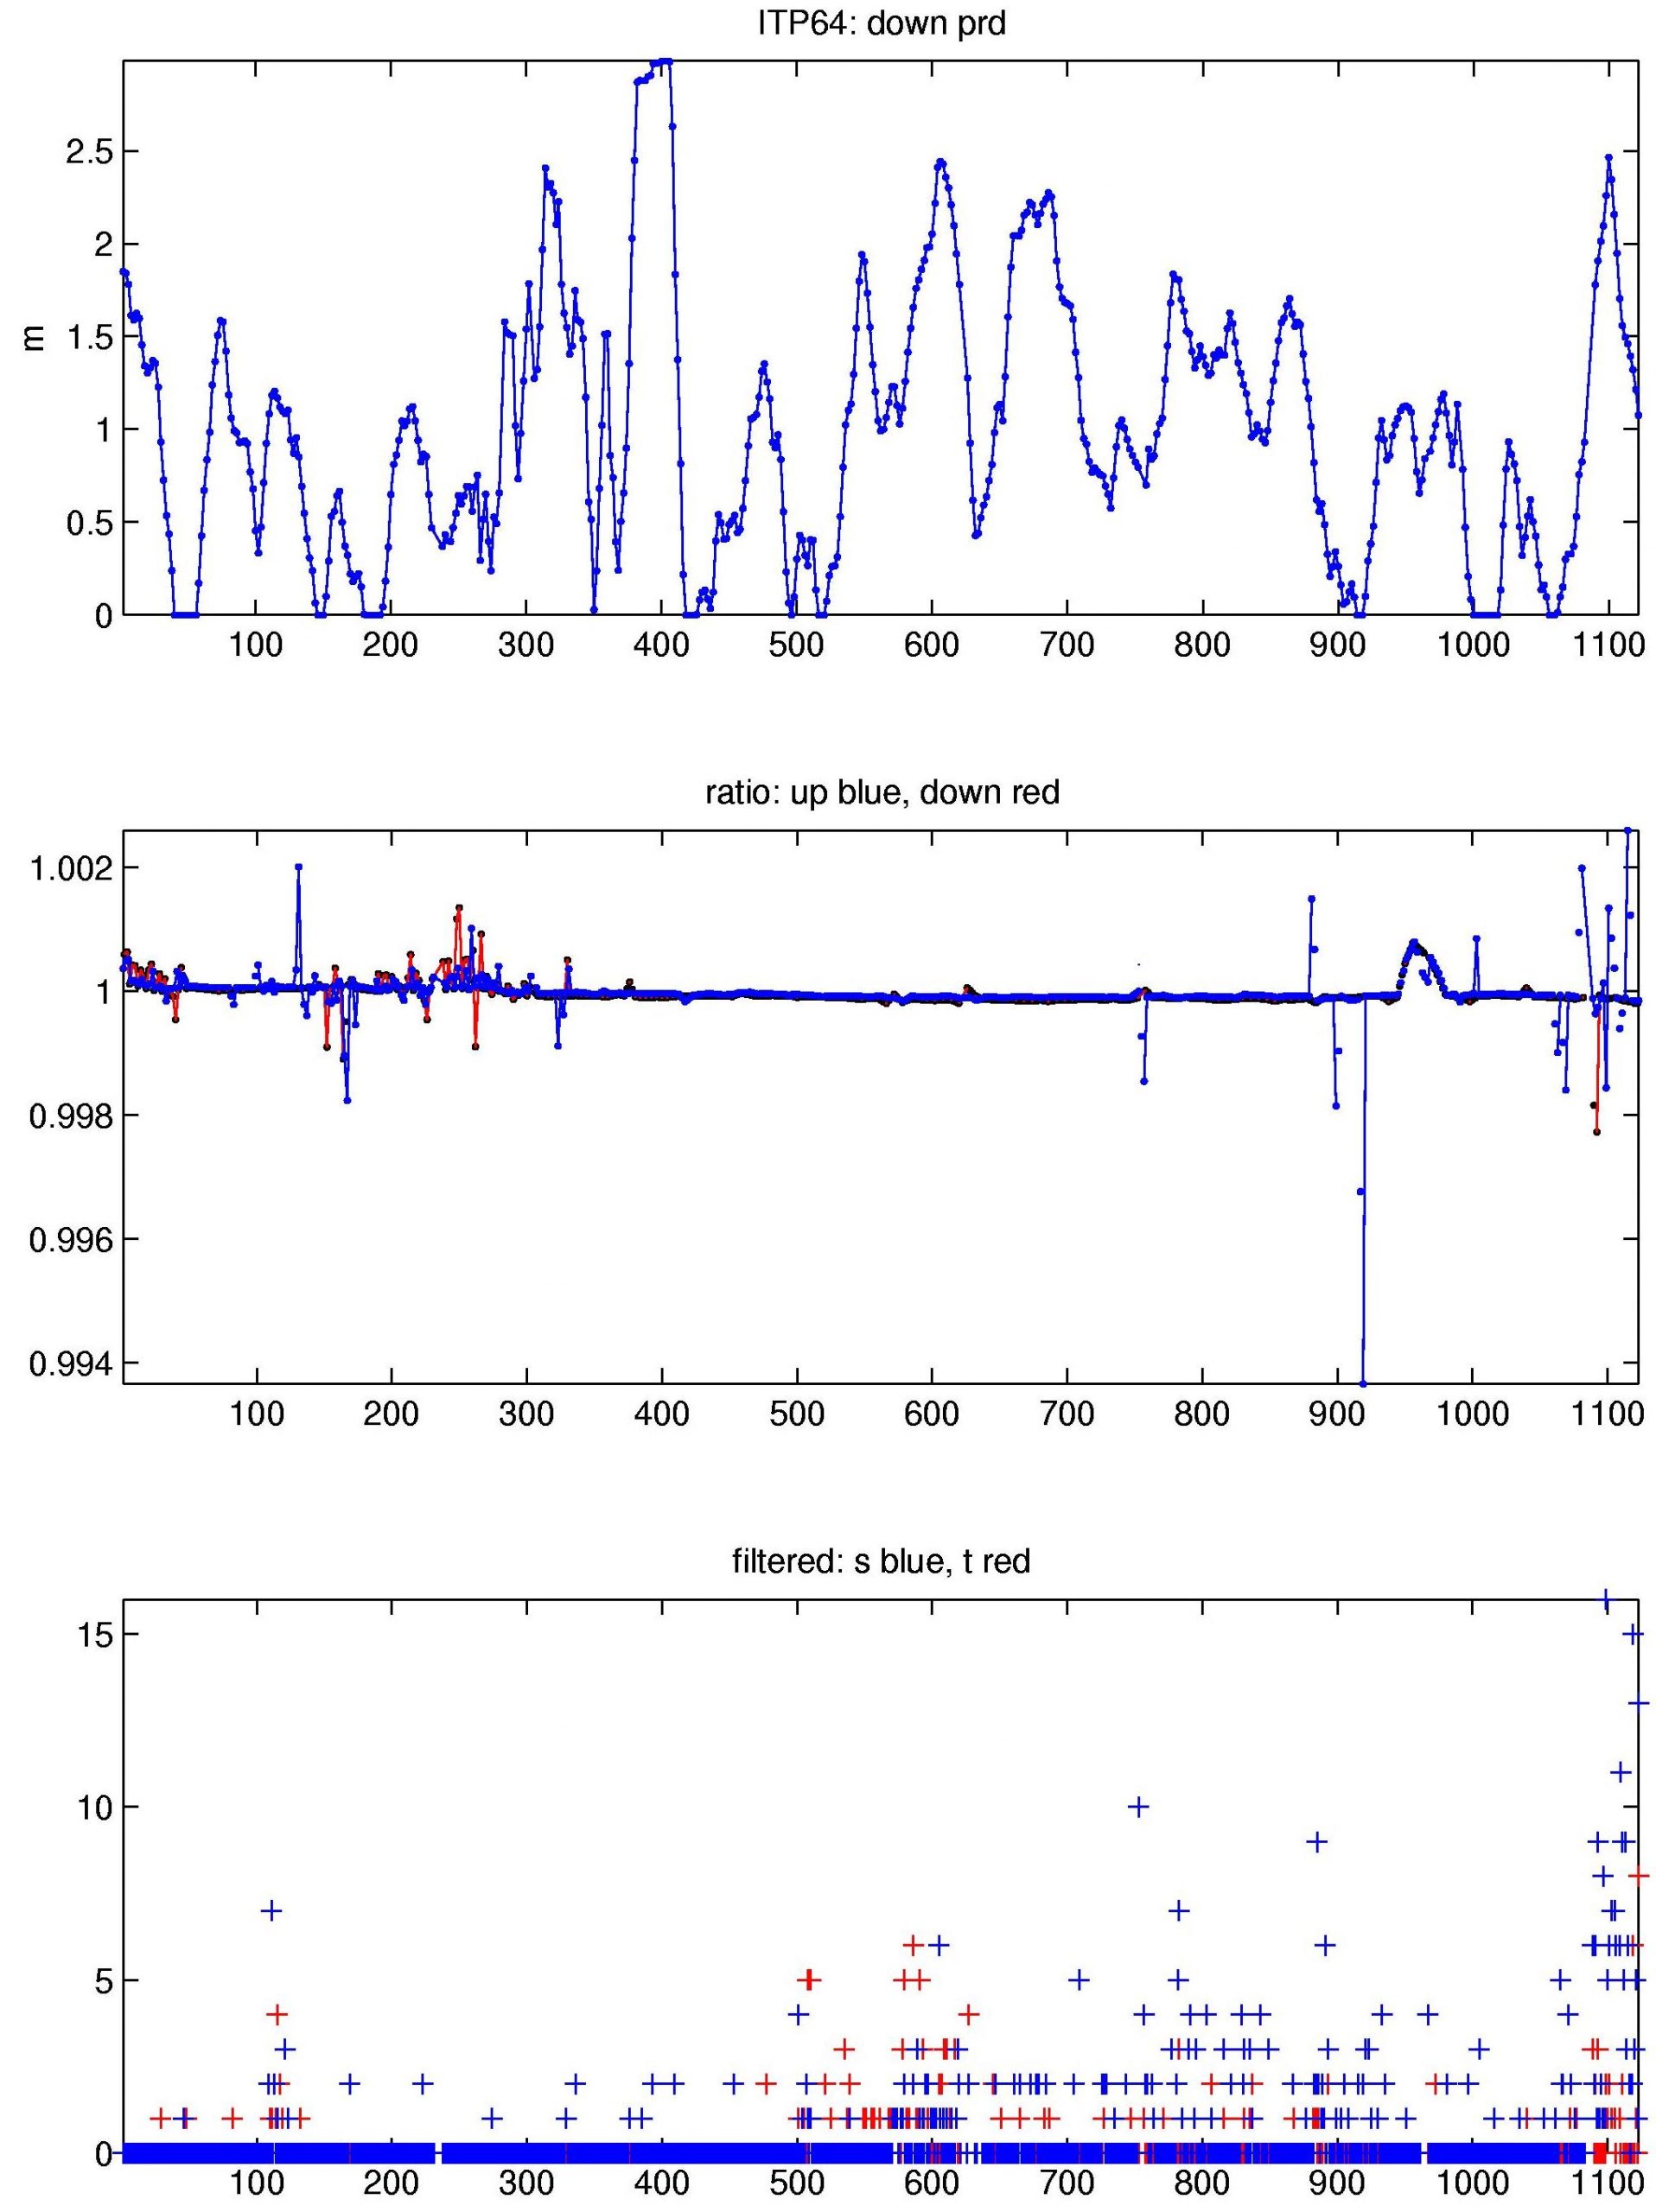
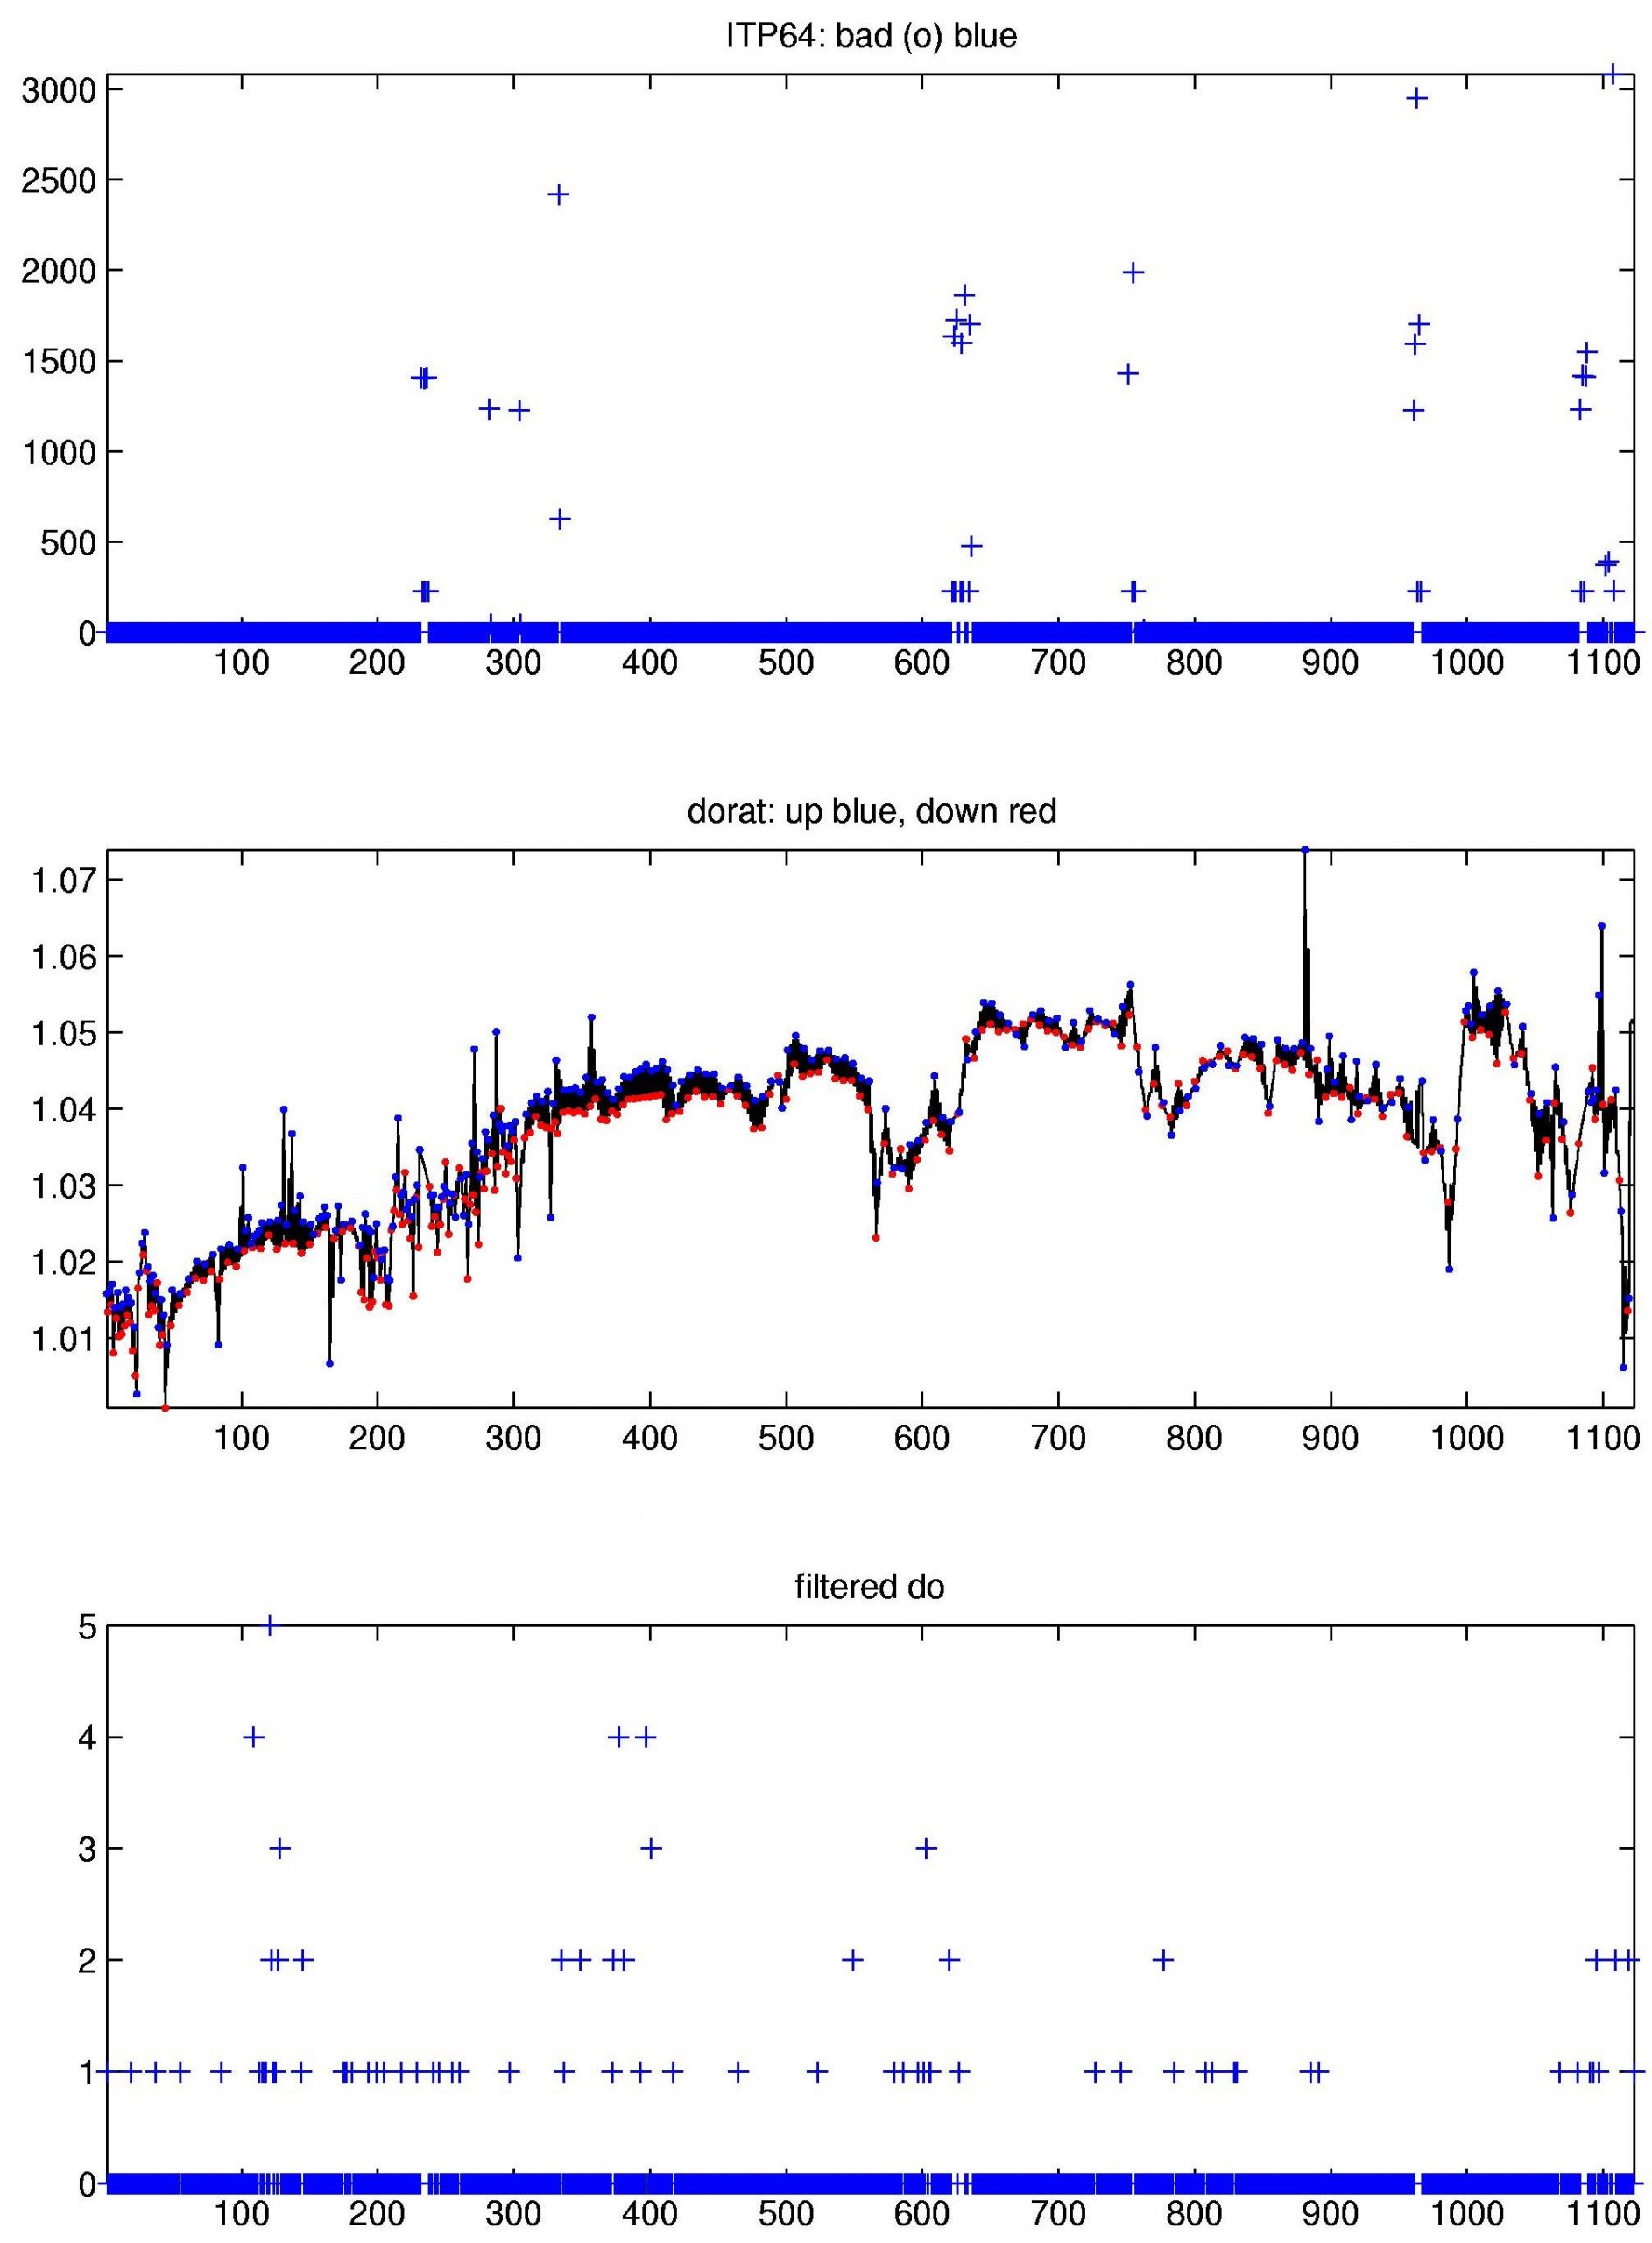
The 1123 profiles that were transmitted from the ITP were processed according to the procedures described in the ITP Updated Data Processing Procedures. The processing parameters for are shown in the figures to the right. The biosuite sensor data handling are described in Laney et al., (2014), while SAMI data validation are described in Islam et al., (2017). Despite being deployed in open water, any wave motion before freezeup did not seem to hamper the vertical motion of the profiler, and buoy drift speeds were usually less than 30 cm/s so the profiler covered nearly the full extent of most profiles that it communicated to the surface package.
Thermohaline staircases were present during the first 4 months of the time series in the deep profiles, and the lag correction estimates were in typical ranges and mostly constant over time. The profile-to-profile potential conductivity corrections were also mostly typical and constant. The dissolved oxygen sensor data were also very clean while the profile-to-profile corrections increased slightly. The biosuite sensors all obtained excellent data over the lifetime of the profiler, as well.
The SAMI pCO2 sensor mounted at 6 m returned excellent data for the first 49 days, but ceased communicating with the surface package on October 19, 2012.
See the Data Products tab to the left for descriptions of the three levels (I, II, III) of data processing and to access all data.
References:
Islam, F., M.D. DeGrandpre, C.M Beatty, M.-L. Timmermans, R.A. Krishfield, J.M Toole, and S.R. Laney, 2017. Sea surface pCO2 and O2 dynamics in the partially ice-covered Arctic Ocean. Journal of Geophysical Research, Vol. 122, doi:10.1002/2016JC012162.
Laney, S.R., R.A. Krishfield, J.M. Toole, T.R. Hammar, C.J. Ashjian, and M.-L. Timmermans, 2014. Assessing Algal Biomass and Bio-optical Distributions in Perennially Ice-Covered Ocean Ecosystems. Polar Science, Vol. 8, http://dx.doi.org/10.1016/j.polar.2013.12.003.
