ITP66 Data Description
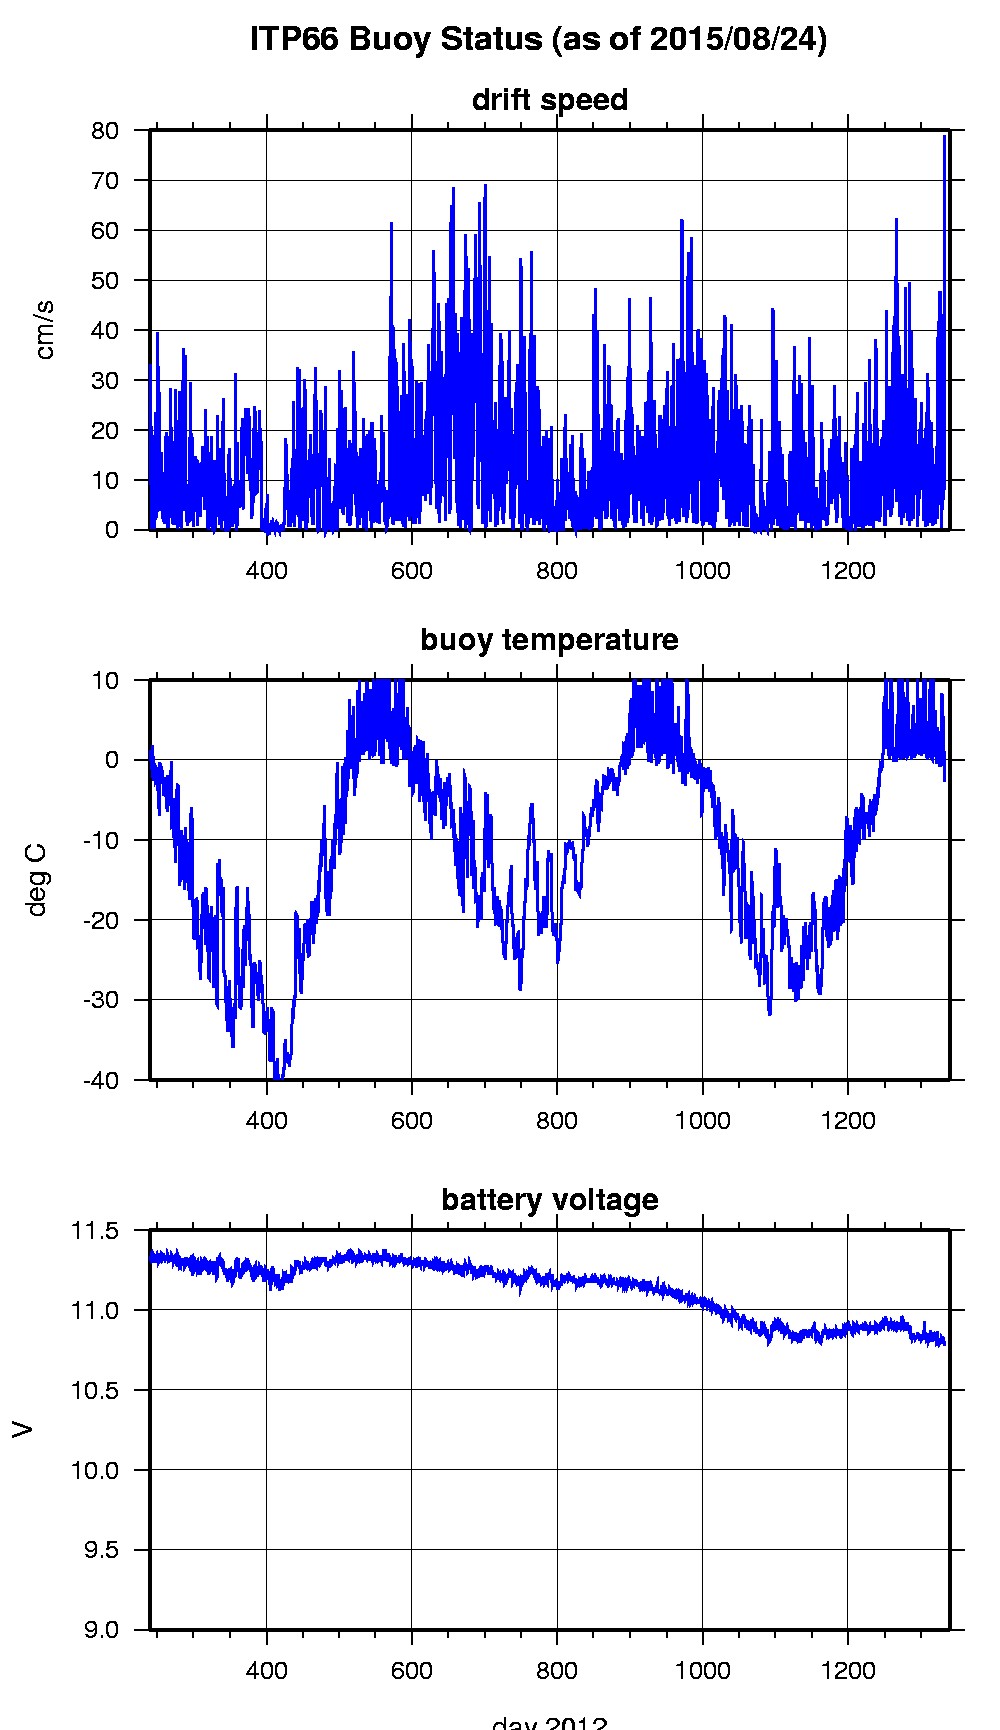
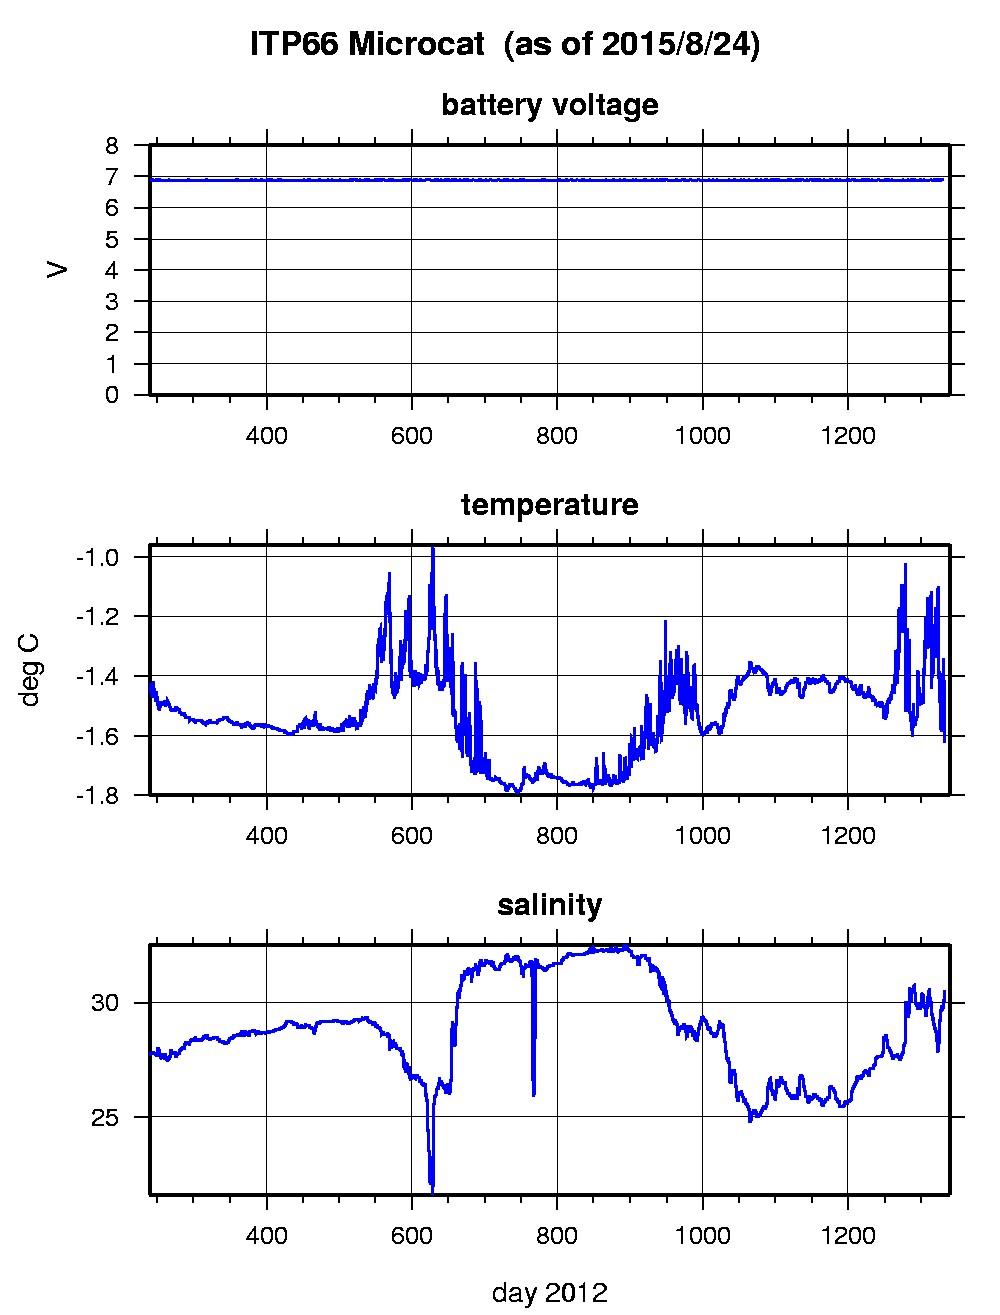
The ITP profiler was configured to operate with a pattern profiling schedule, but communications between the underwater profiler and surface unit were never established after deployment. However, the microcat attached on the tether at 6 m was able to communicate hourly data successfully over the same inductive modem circuit for the entire 1092 day duration of the buoy. In the surface package, the GPS receiver was powered hourly to obtain locations, and buoy temperature and battery voltage status were recorded.
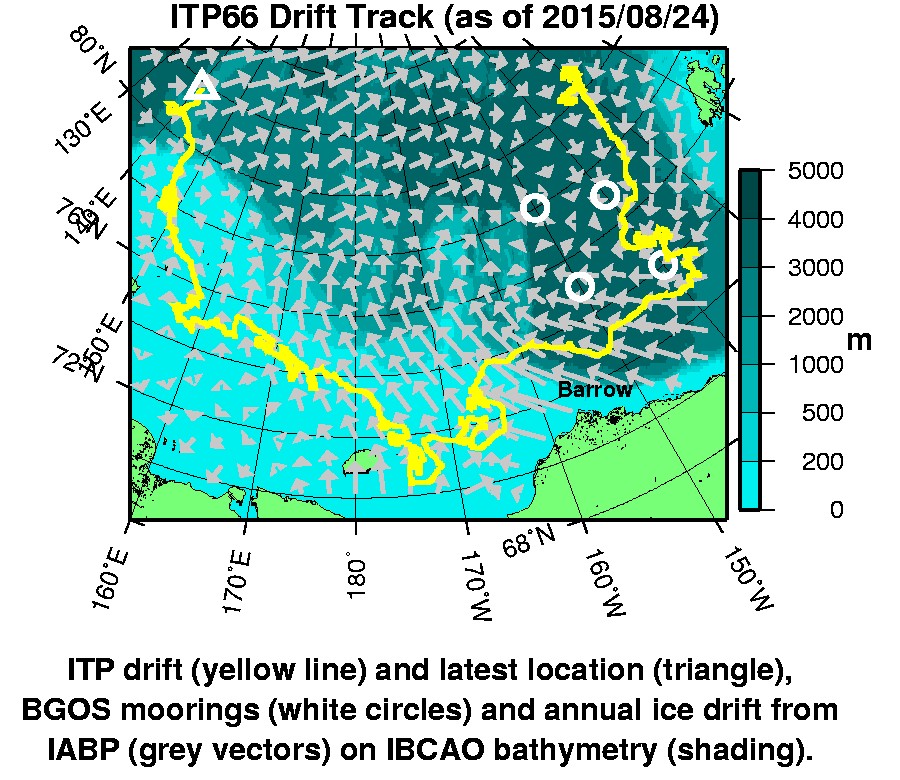
The ITP drifted generally in a large clockwise pattern southward along 135 W longitude for the first year, then westward out of the Canada Basin and over the Chuckchi and East Siberian shelves for the next 1.5 years, and finally northward to nearly 82° for the remainder of its 3 year drift until the surface package ceased Iridium transmissions.
The plots to the right are of the final location and status data from the surface package, and subsurface microcat data.
See the Data Products tab to the left to access all data.
ITP 66 data can also be found at the links below:
Level II hourly buoy location data in ASCII format: itp66rawlocs.dat
Microcat data in MATLAB format: itp66final.mat
Microcat data in ASCII format: itp66final.tar.Z and itp66final.zip


