ITP 12 Data Description
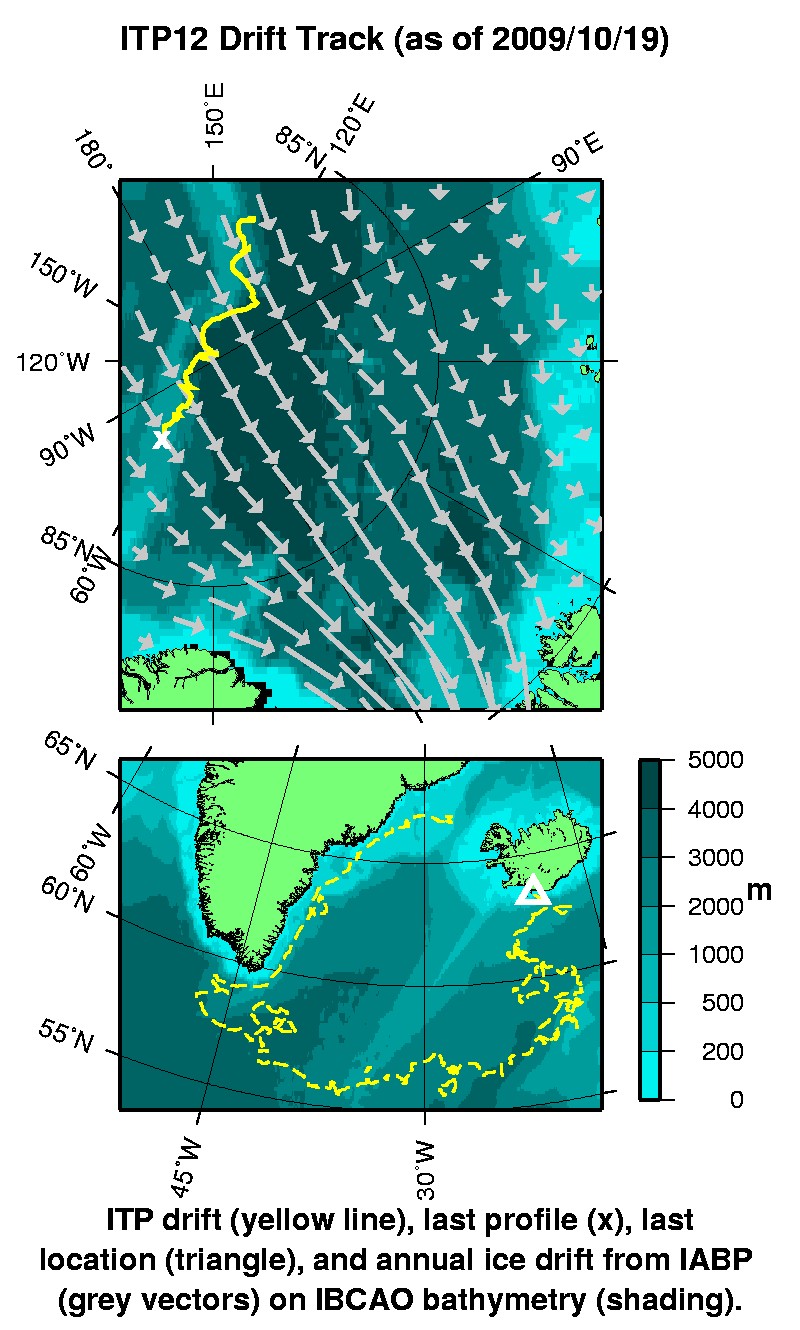
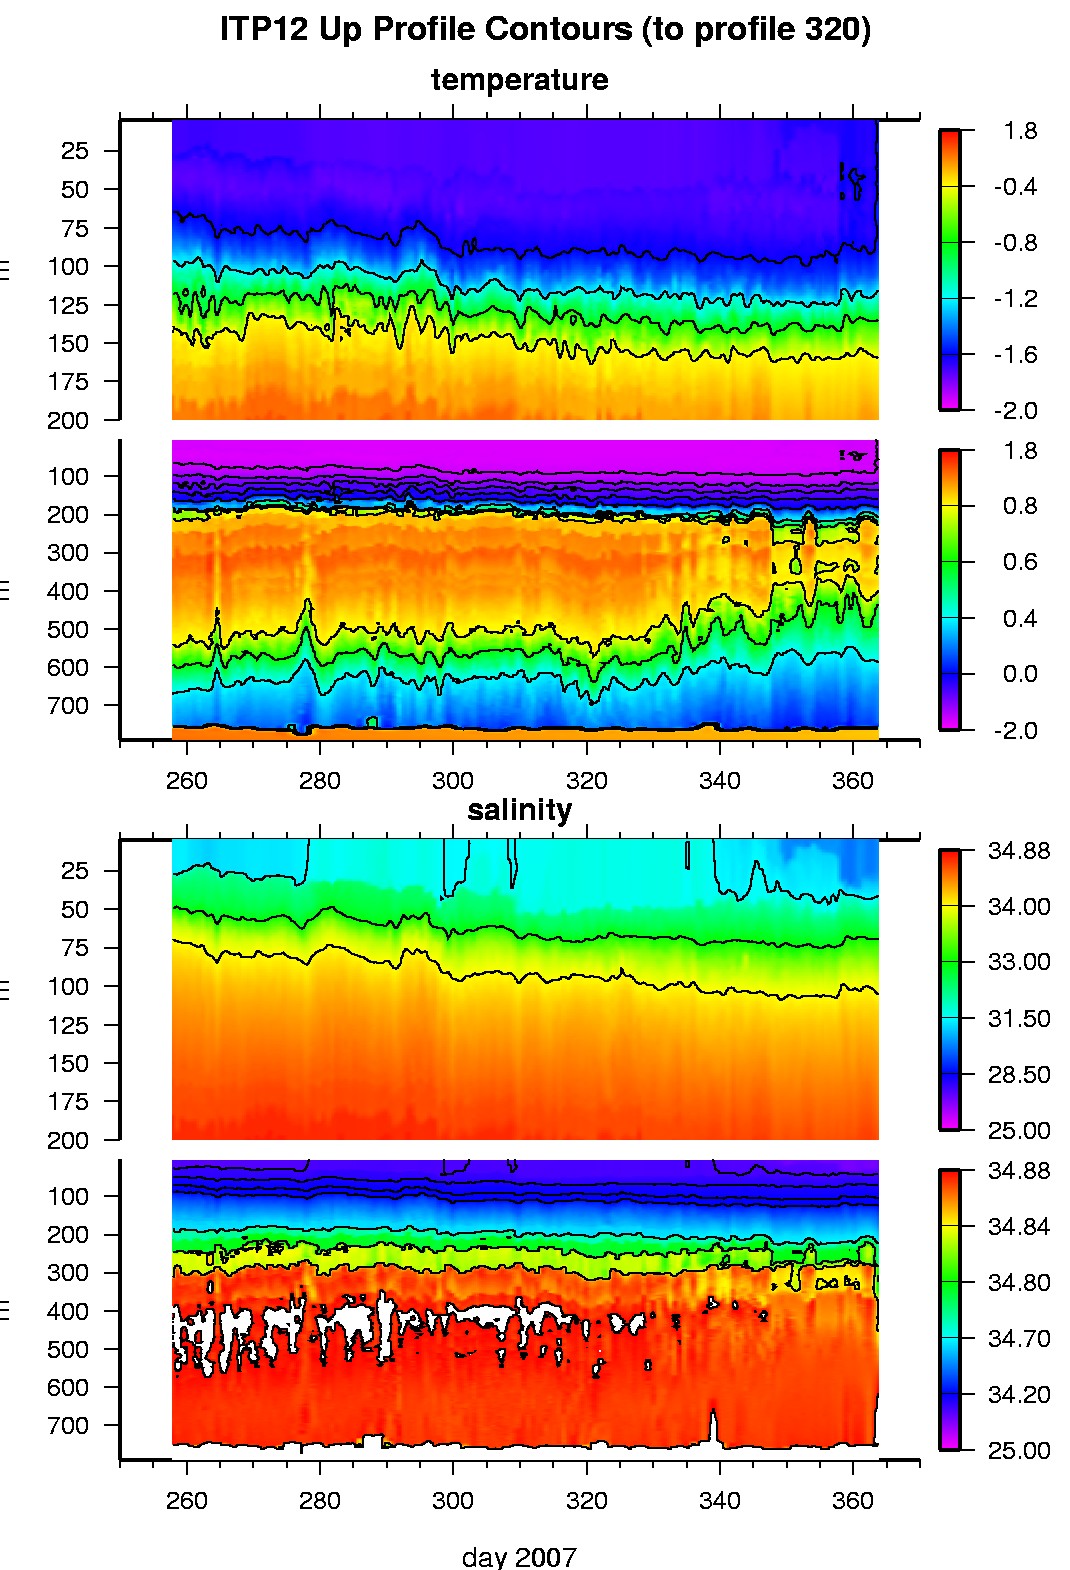
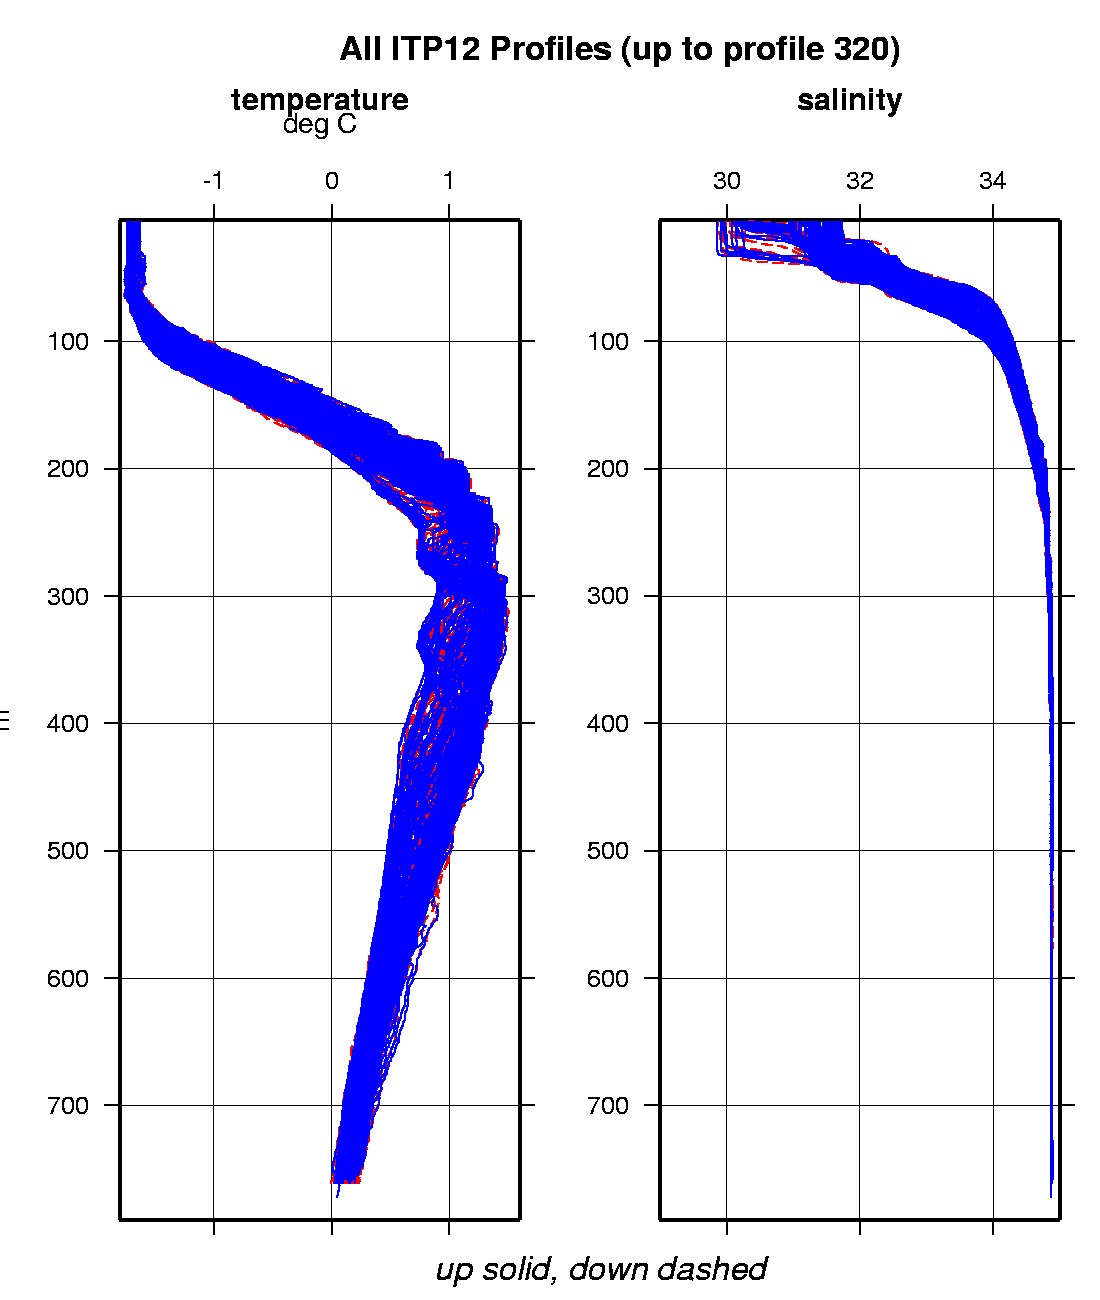
The ITP profiler was configured to operate with a rapid sampling schedule of 3 one-way profiles between 10 and 750 m depth each day as it was expected to exit the Arctic in less than 2 years based on its deployment location . In the surface package, the GPS receiver was powered every hour to obtain locations, and buoy temperature and battery voltage status were recorded. After 106 days of reliable operation and data telemetry, the ITP (and rest of “Super Buoy Array”) appear to have been ridged in ice of pushed beneath the ice. At that point, no more information was received from the ITP profiler (possibly the tether could have parted), the surface package temperature hovered in the range of the ice rather than atmosphere, and status data from the surface package ceased. Eleven months later (late November 2008) the surface package resurfaced in the Denmark Strait between Greenland and Iceland and relayed all of the stored status data (but no new profiler information). Now in the open ocean, the drifter completed a wide cyclonic loop and developed a severe operating problem in the surface package which terminated the mission in October 2009 after 739 days.
The plots to the right are of the final, calibrated, edited data (as opposed to the raw data presented on the active instrument pages).
See the Data Products tab to the left for descriptions of the three levels (I, II, III) of data processing and to access all data.
ITP 12 data can also be found at the links below:
Level II hourly buoy location data in ASCII format: itp12rawlocs.dat
Level III 1-Hz processed profile data in MATLAB format: itp12cormat.tar.Z and itp12cormat.zip
Level III 1-db bin-averaged processed profile data in MATLAB format: itp12final.mat
Level III 1-db bin-averaged processed profile data in ASCII format: itp12final.tar.Z and itp12final.zip


