ITP 15 Data Description
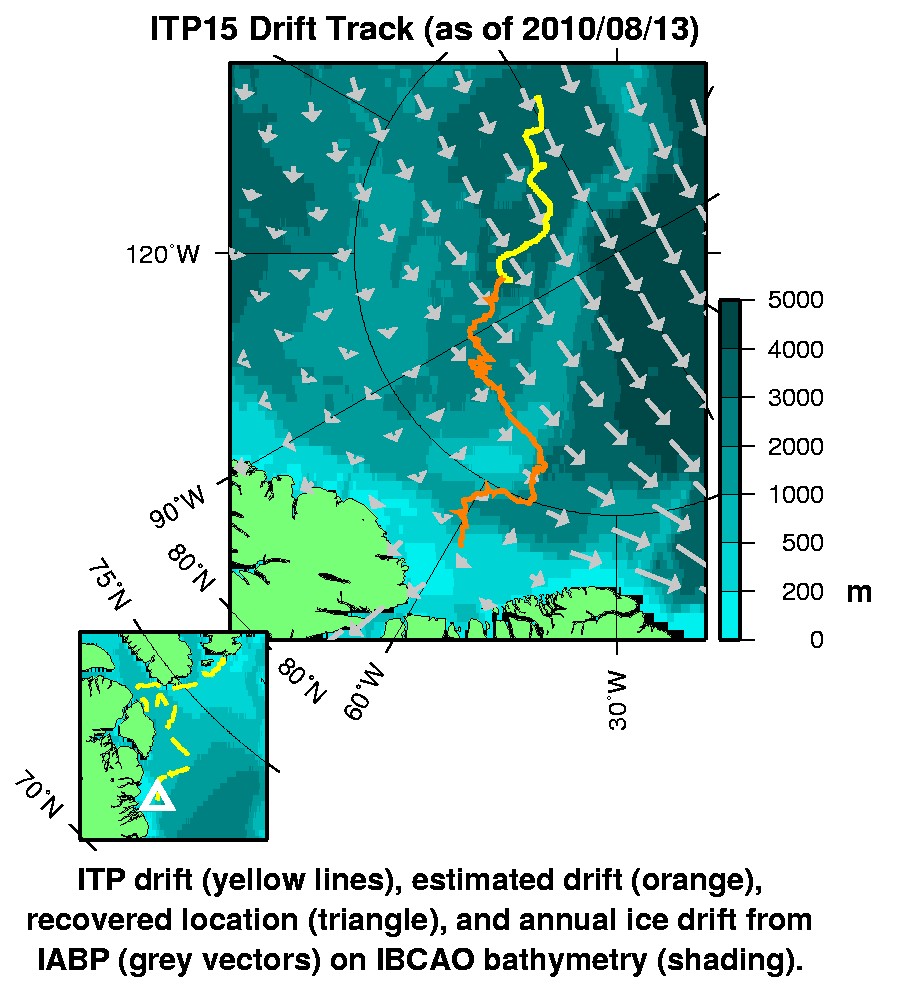
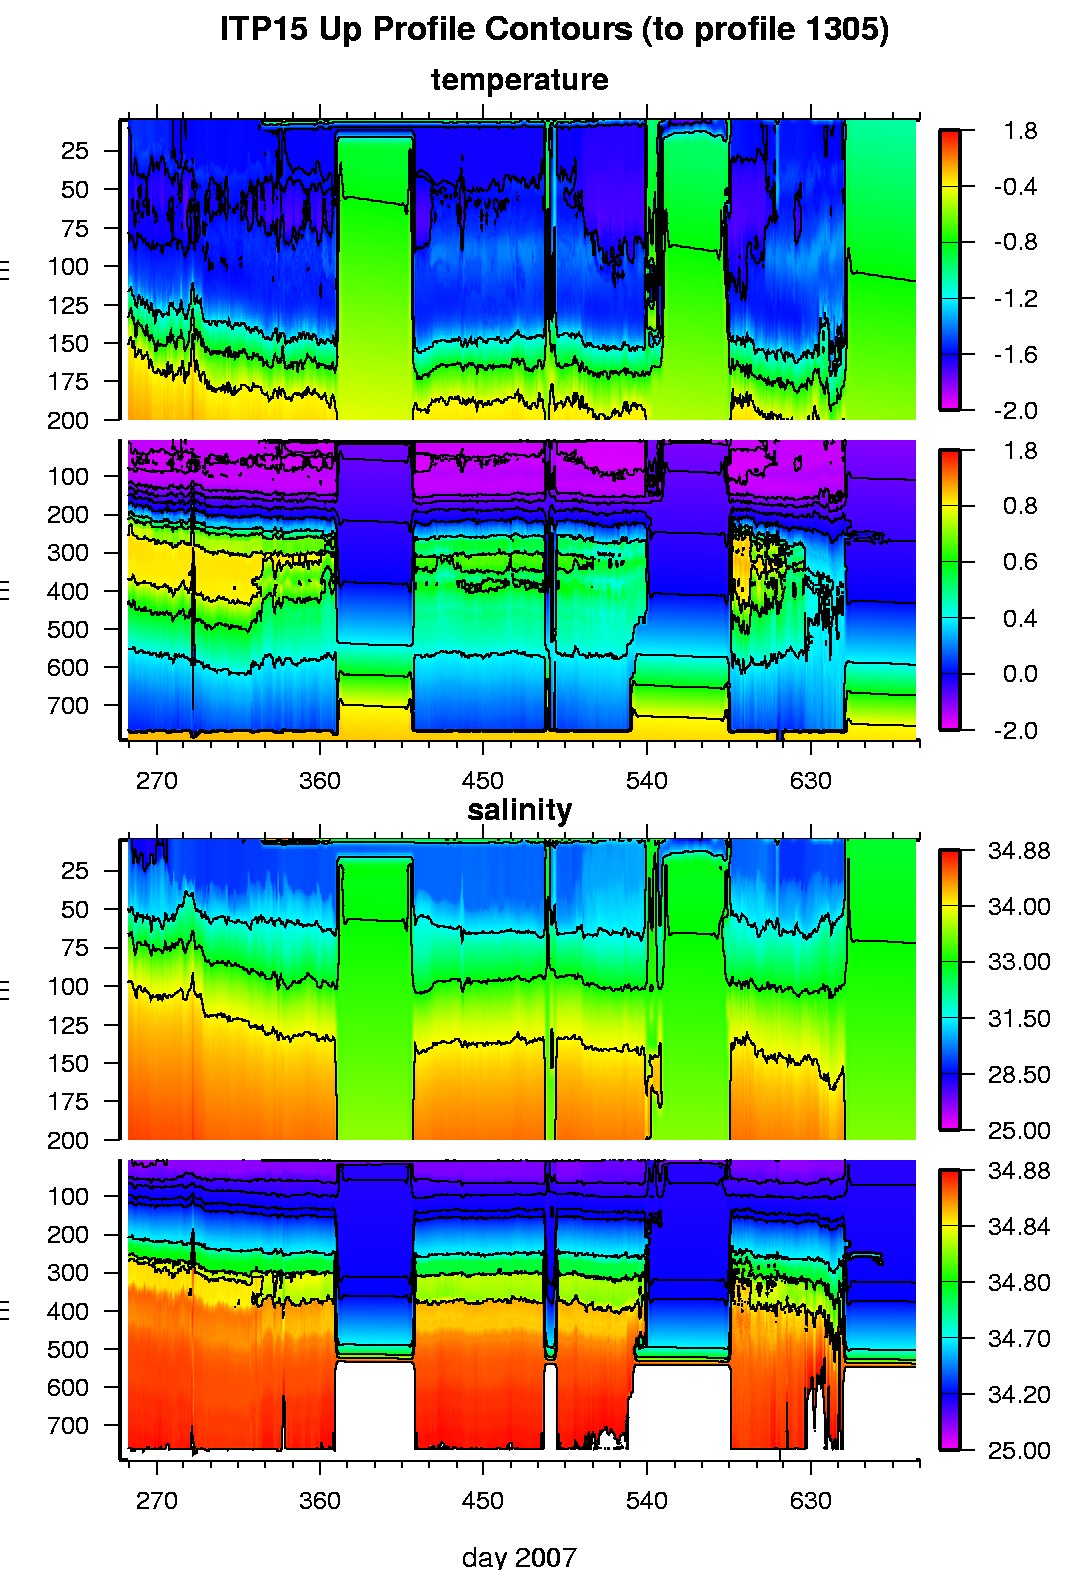
In the surface package, the GPS receiver obtained locations, and buoy temperature and battery voltage every hour for 55 days until the surface package was apparently pushed beneath the ice surface. While the Iridium and GPS antennae lost access to the sky and could not communicate or locate, the ITP profiler continued to operate and send data to the surface unit for another 379 days. During this time, the reconstructed drift track indicates that the system crossed from the Makarov Basin over the Lomonosov Ridge and entered the Lincoln Sea. After data collection ceased, the ITP apparently drifted through Nares Strait and resurfaced 995 days in Baffin Bay.
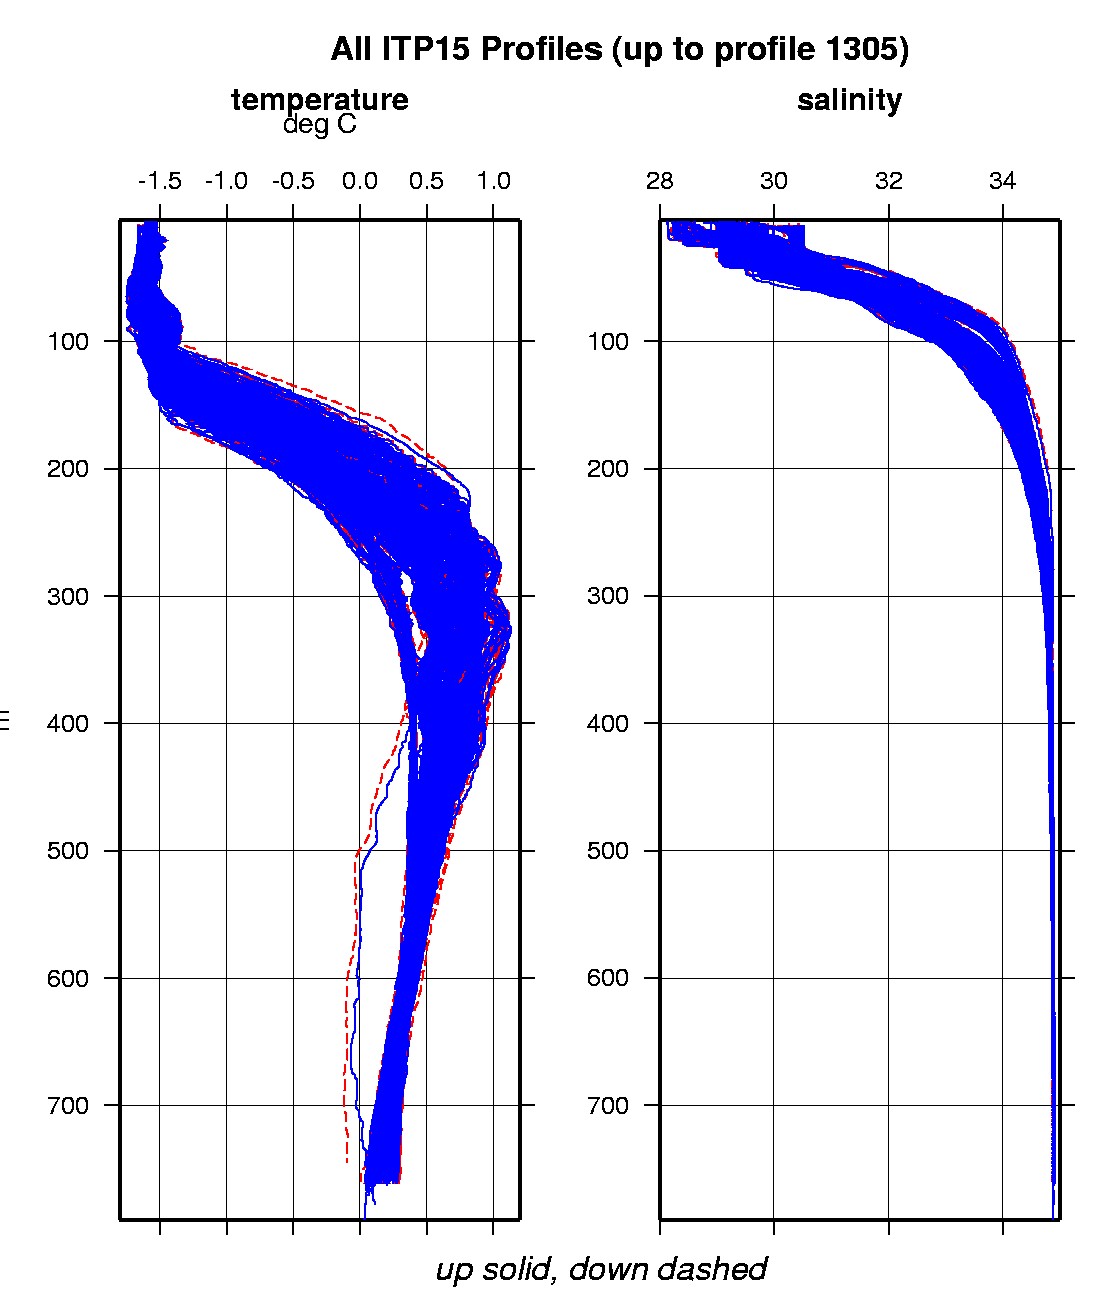
The plots to the right are of the final, calibrated, edited data (as opposed to the raw data presented on the active instrument pages).
See the Data Products tab to the left for descriptions of the three levels (I, II, III) of data processing and to access all data.
ITP 15 data can also be found at the links below:
Level II hourly buoy location data in ASCII format: itp15rawlocs.dat
Level III 1-Hz processed profile data in MATLAB format: itp15cormat.tar.Z and itp15cormat.zip
Level III 1-db bin-averaged processed profile data in MATLAB format: itp15final.mat
Level III 1-db bin-averaged processed profile data in ASCII format: itp15final.tar.Z and itp15final.zip


