ITP 24 Data Processing
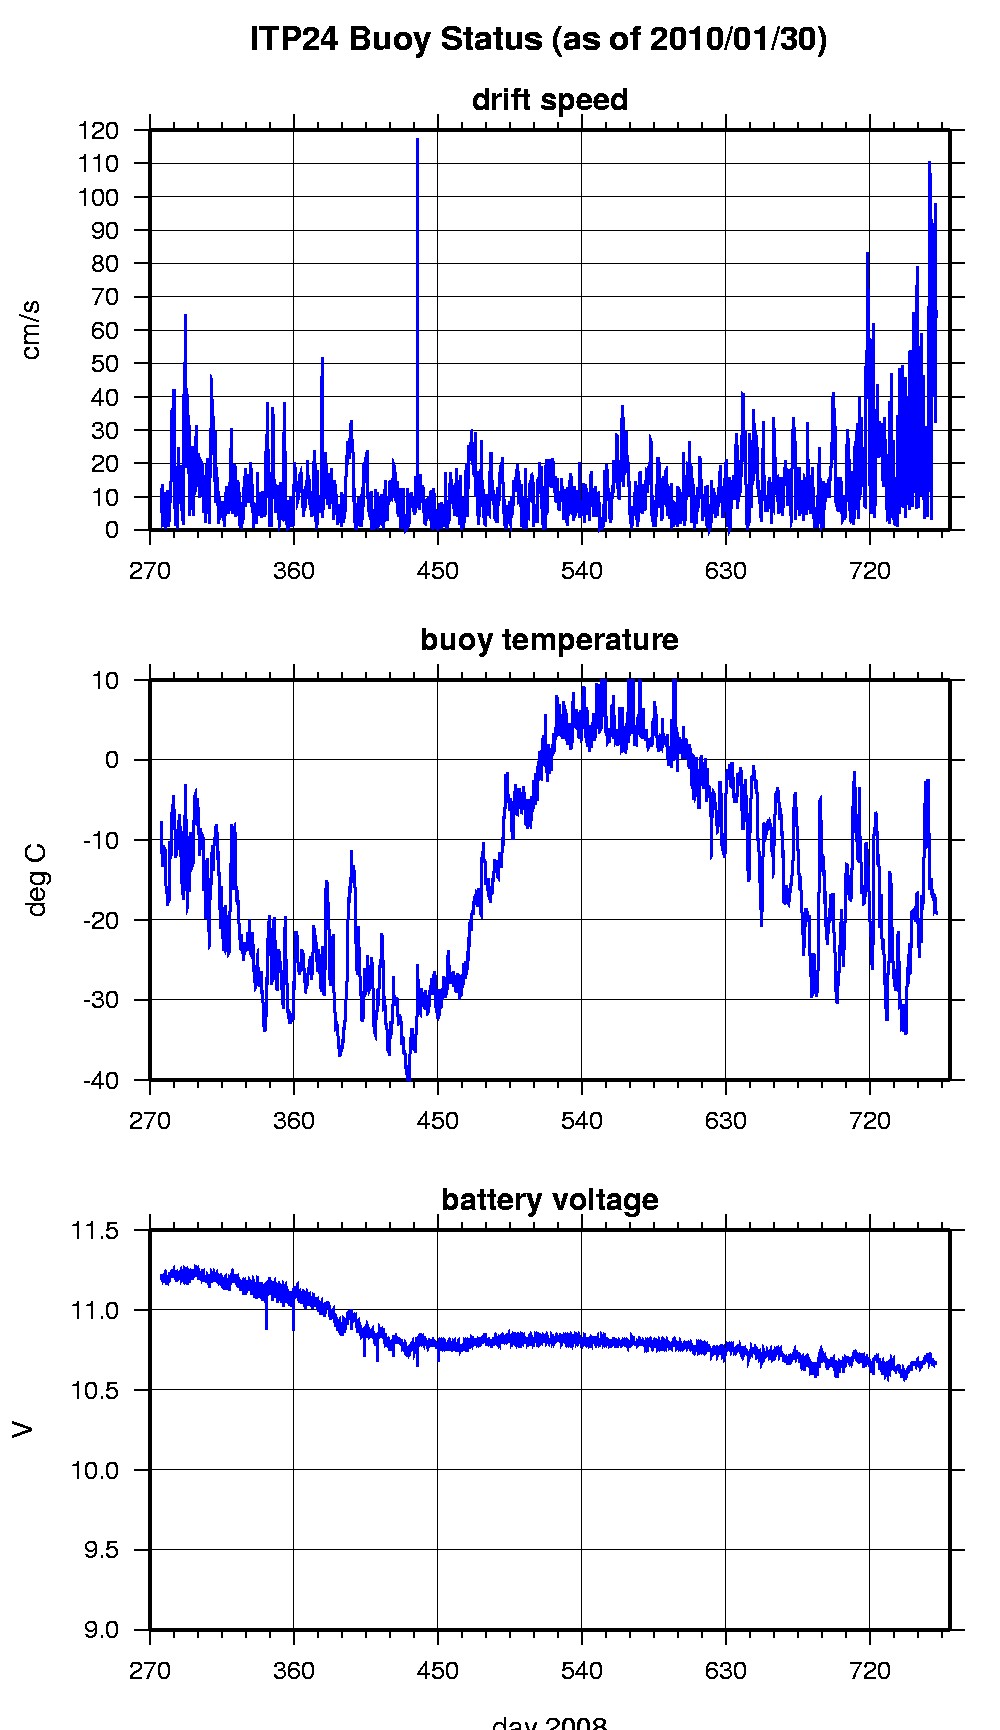
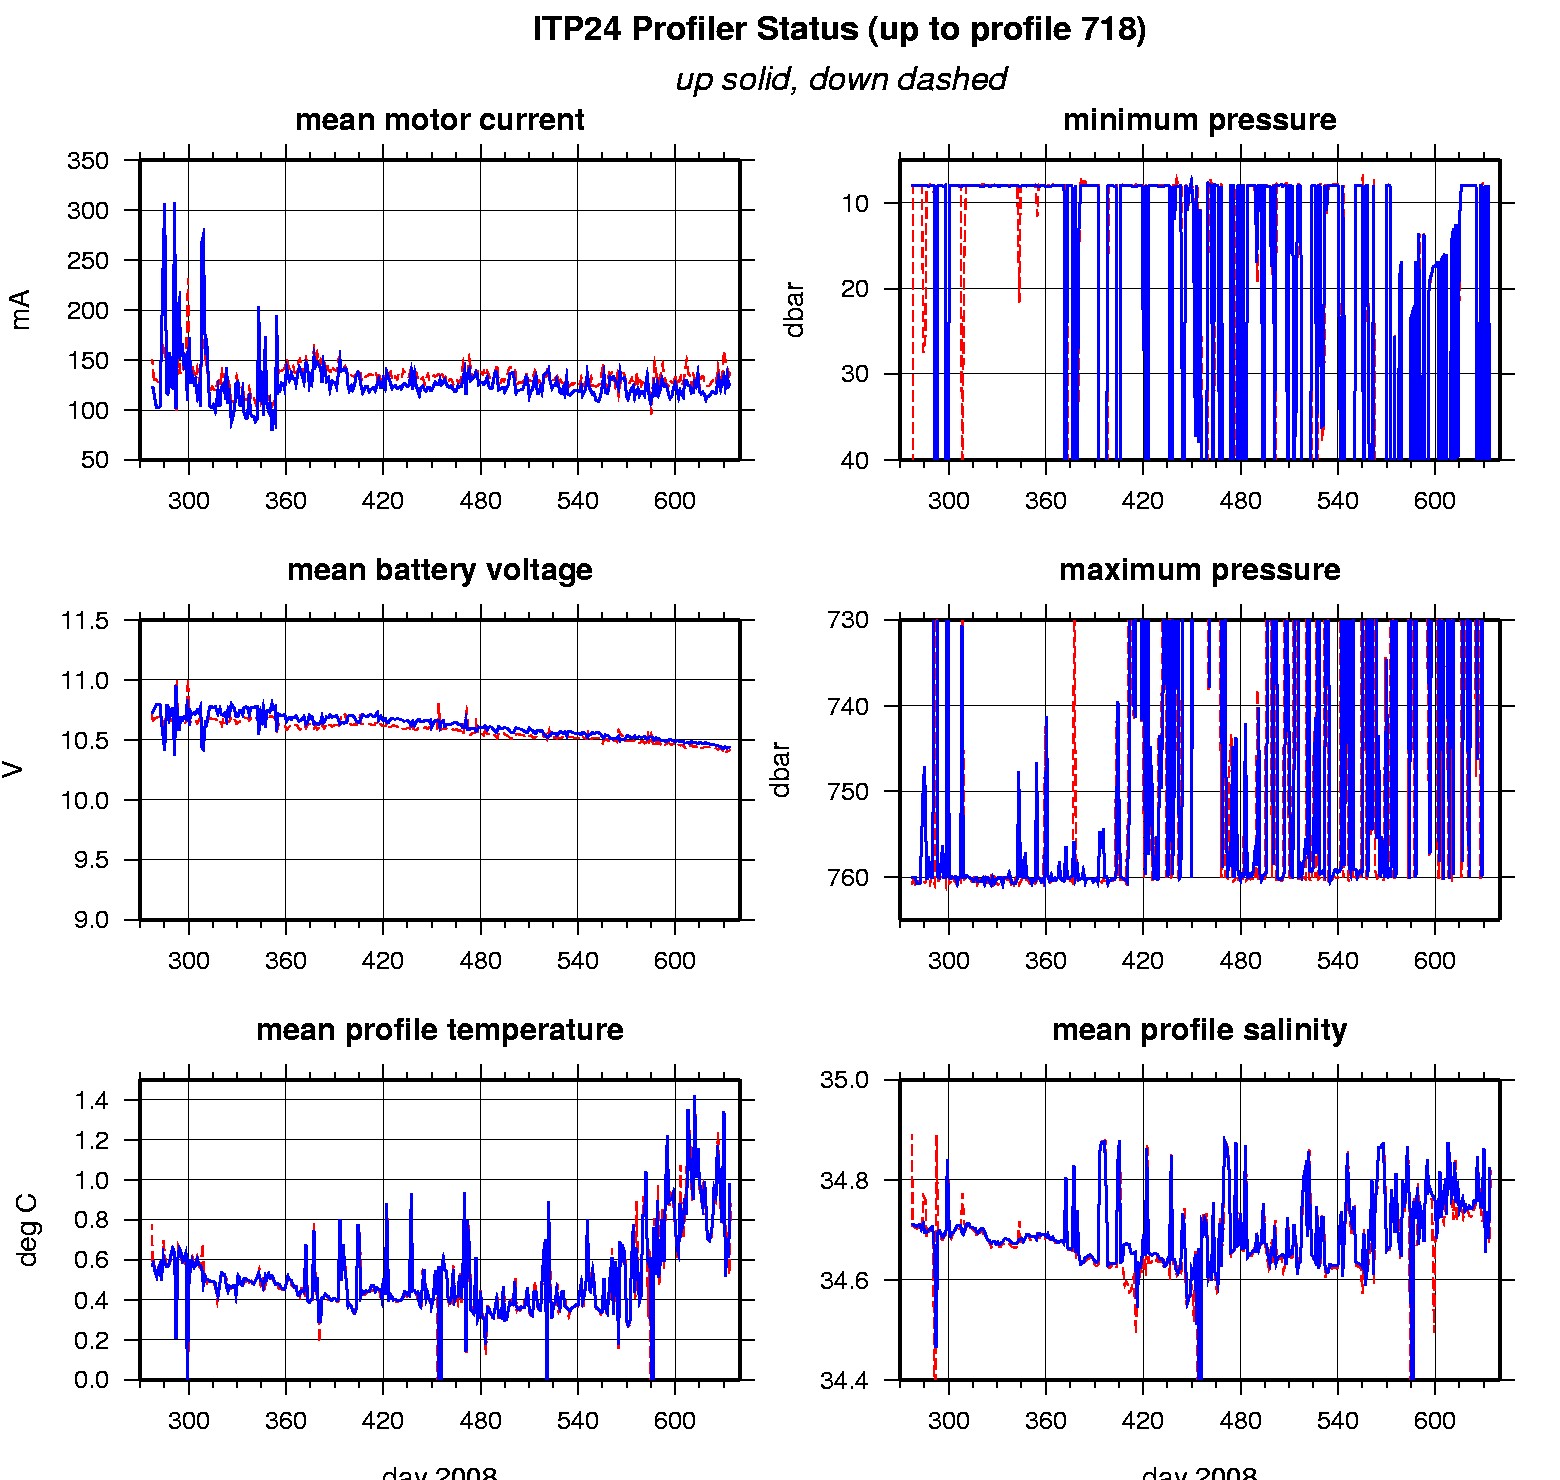
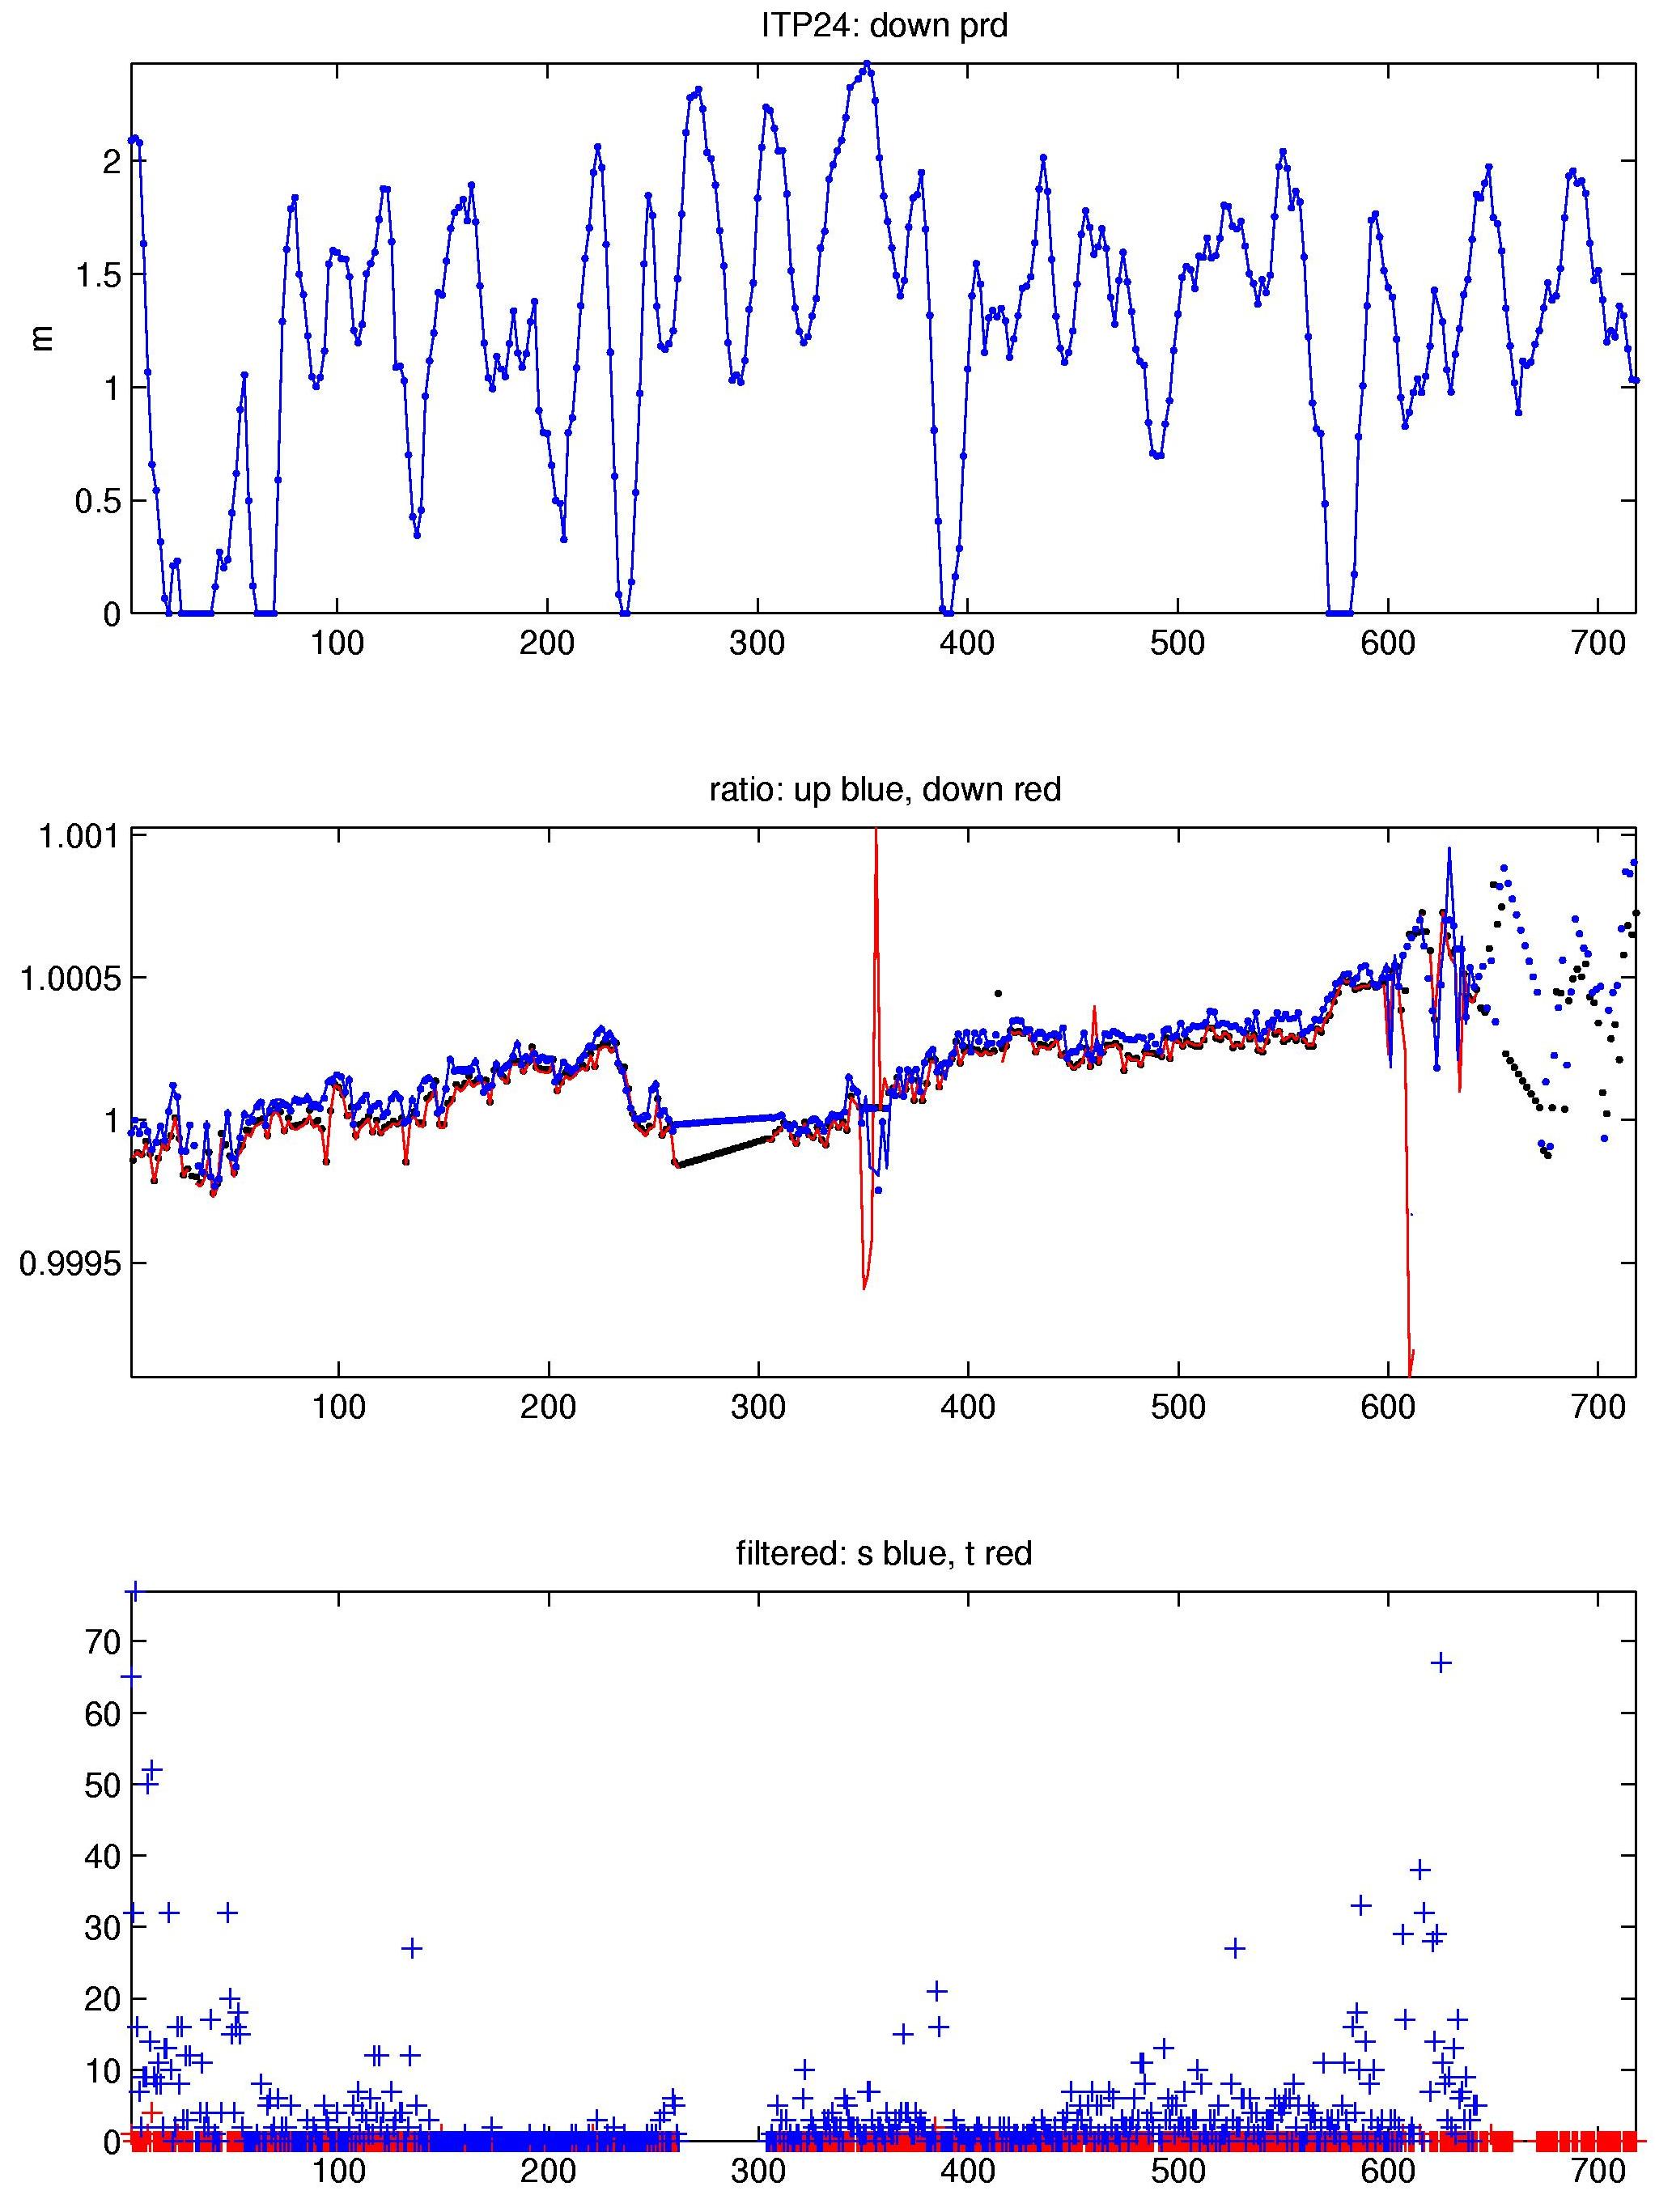
ITP 24 transmitted data for the first 538 profiles and an additional 180 profiles were retrieved from the surface unit when it was recovered, so that a total of 718 profiles were obtained. They were processed according to the procedures described in the ITP Updated Data Processing Procedures. The processing parameters for this ITP are shown in the figures to the right. Buoy drift speeds stayed mostly below 20 cm/s, with around 10 events at or near 30 cm/s lasting a few days.
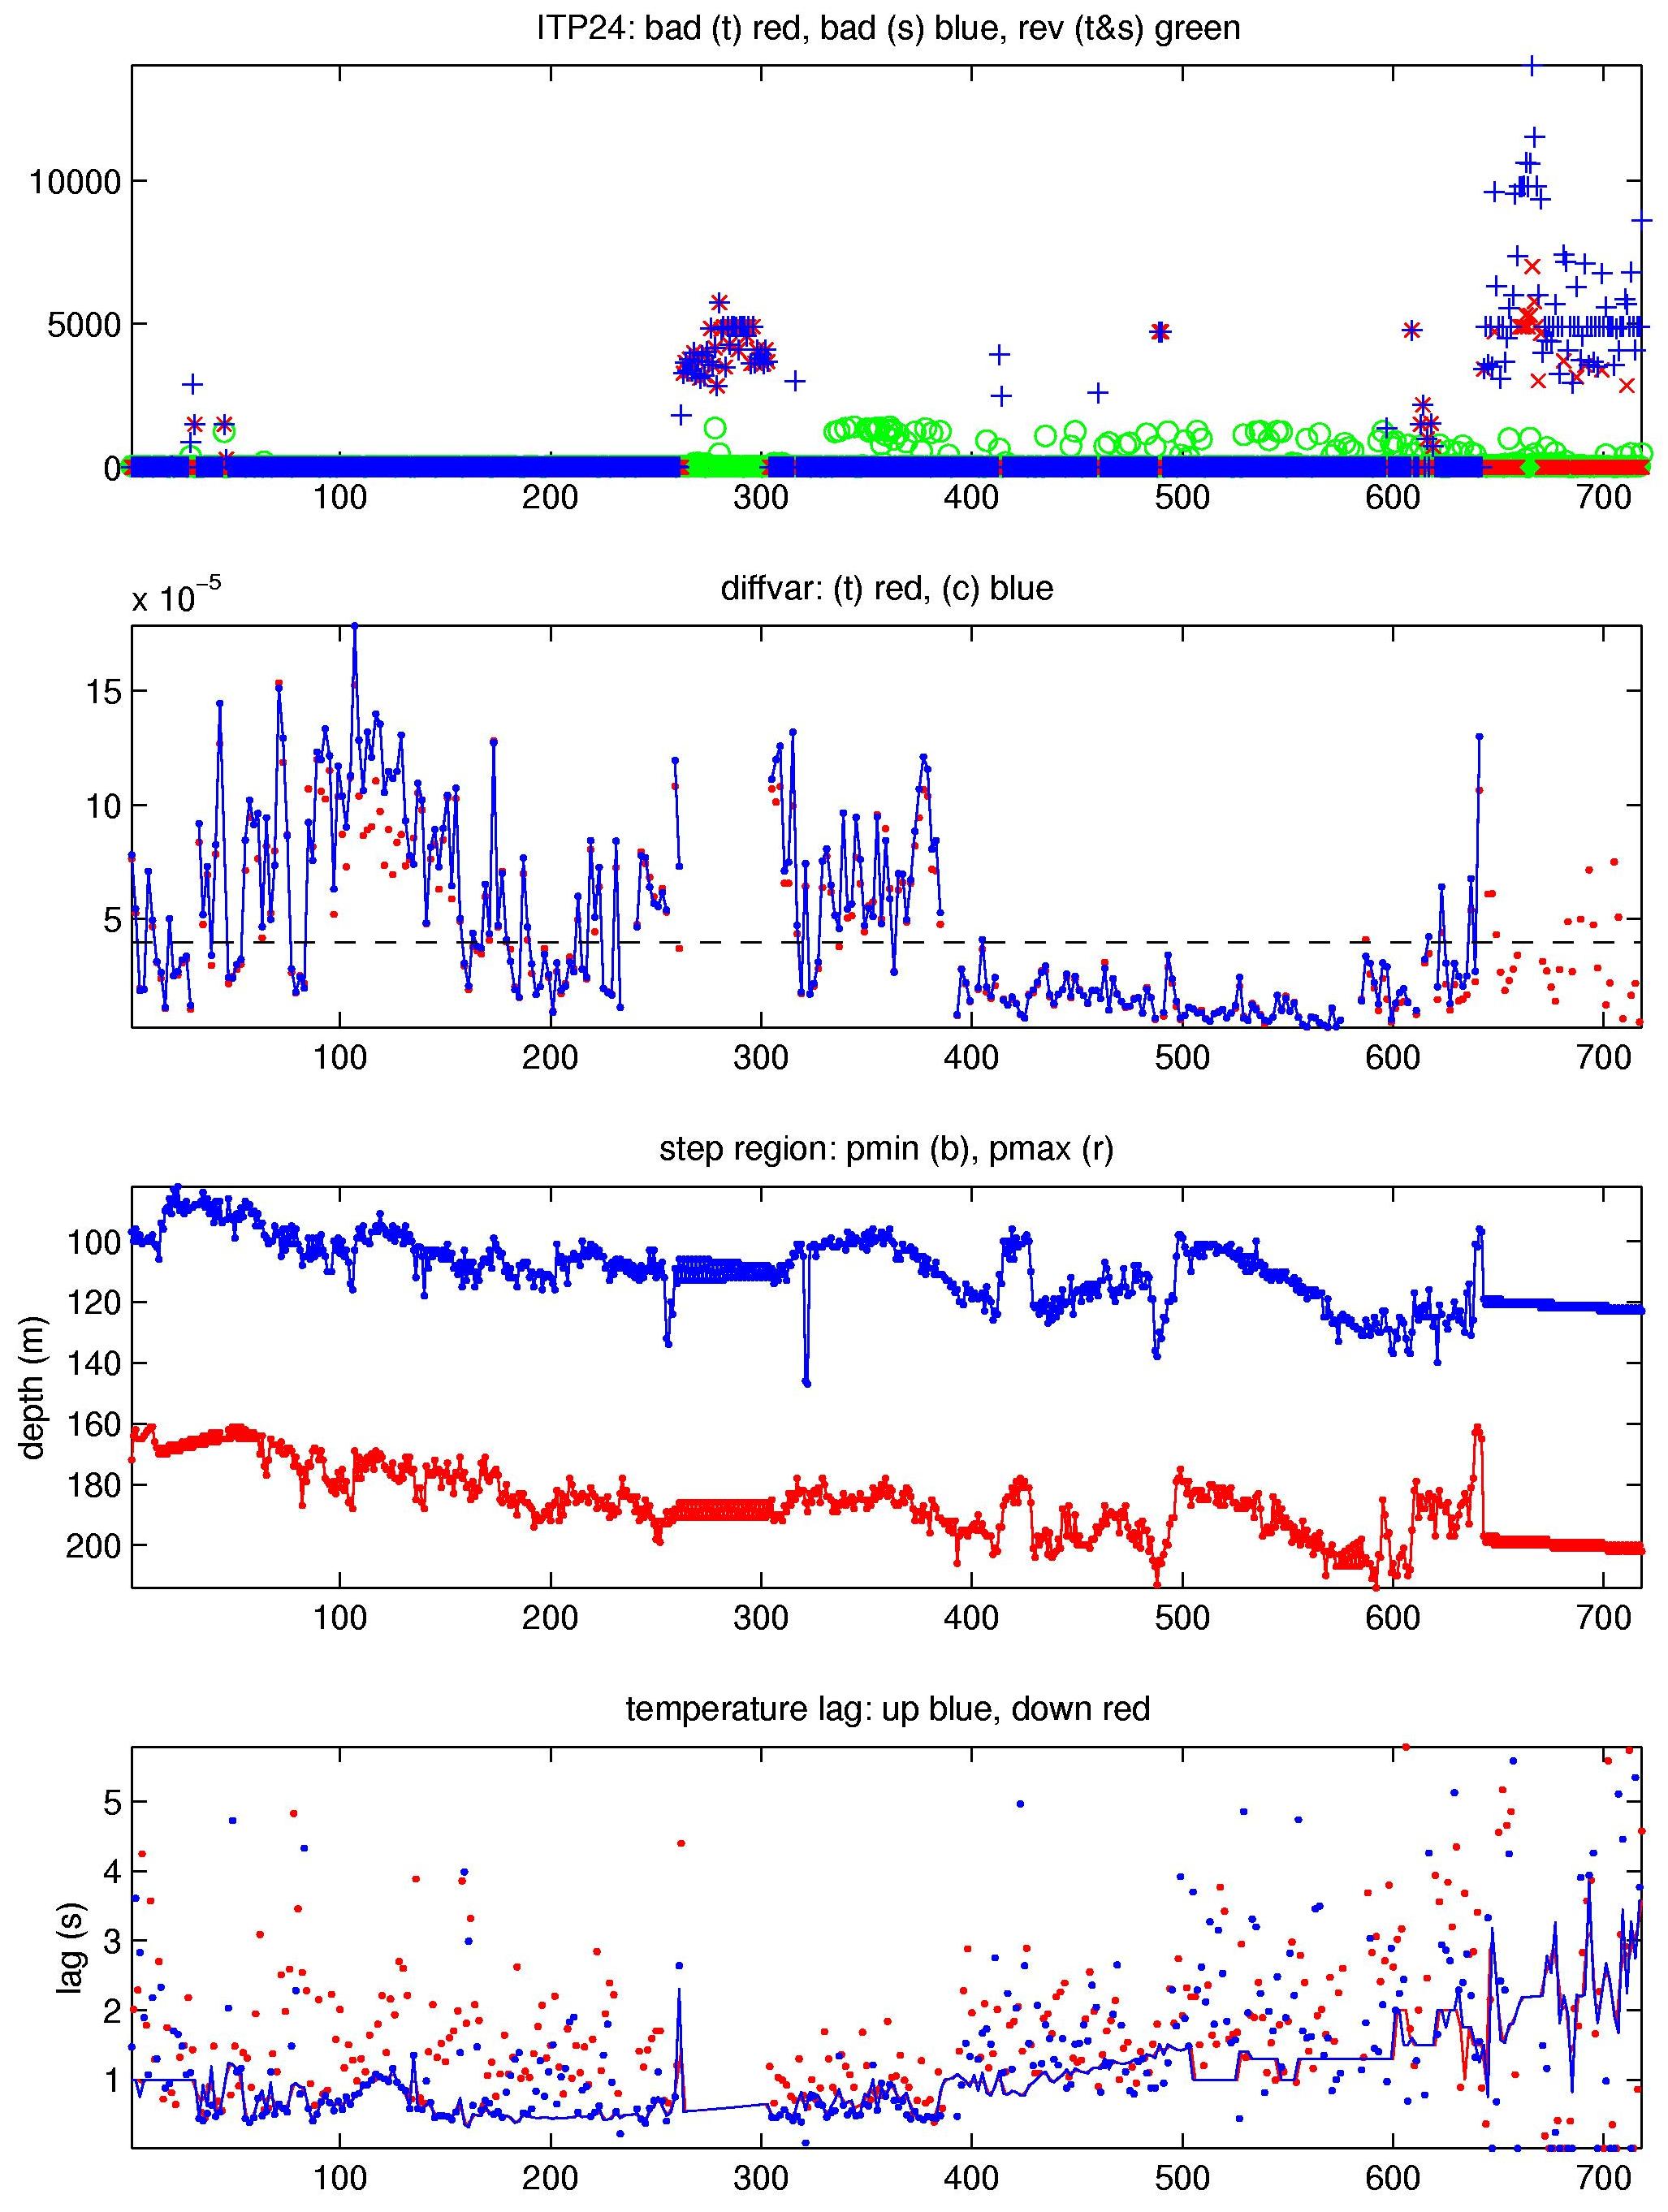
As usual, some conductivity (salinity) data were affected by suspected biofouling or similar glitches. This included a few instances of the typical short-term spikes that affected only one or a few vertical bins. A small number of cases where complete individual profiles or small groups showed contaminations were also edited out. In addition, however, there were two longer series of profiles with large differences between subsequent climb- and dive profiles. For the first set, profiles 263 through 303, the onset of contaminations as well as the return to clean data was very obvious. This was less clear for the second set at the end of the record, where sensor performance appeared to degrade more gradually. When noise started to increase, profiles 577 through 644 were flagged as "questionable" (qflag, see below) after attempts to modify sensor lags resulted in little improvements. Up/down differences became significant starting at 645 and continued to develop until the end of the record. Consequently profiles 645 through 718 were eliminated.
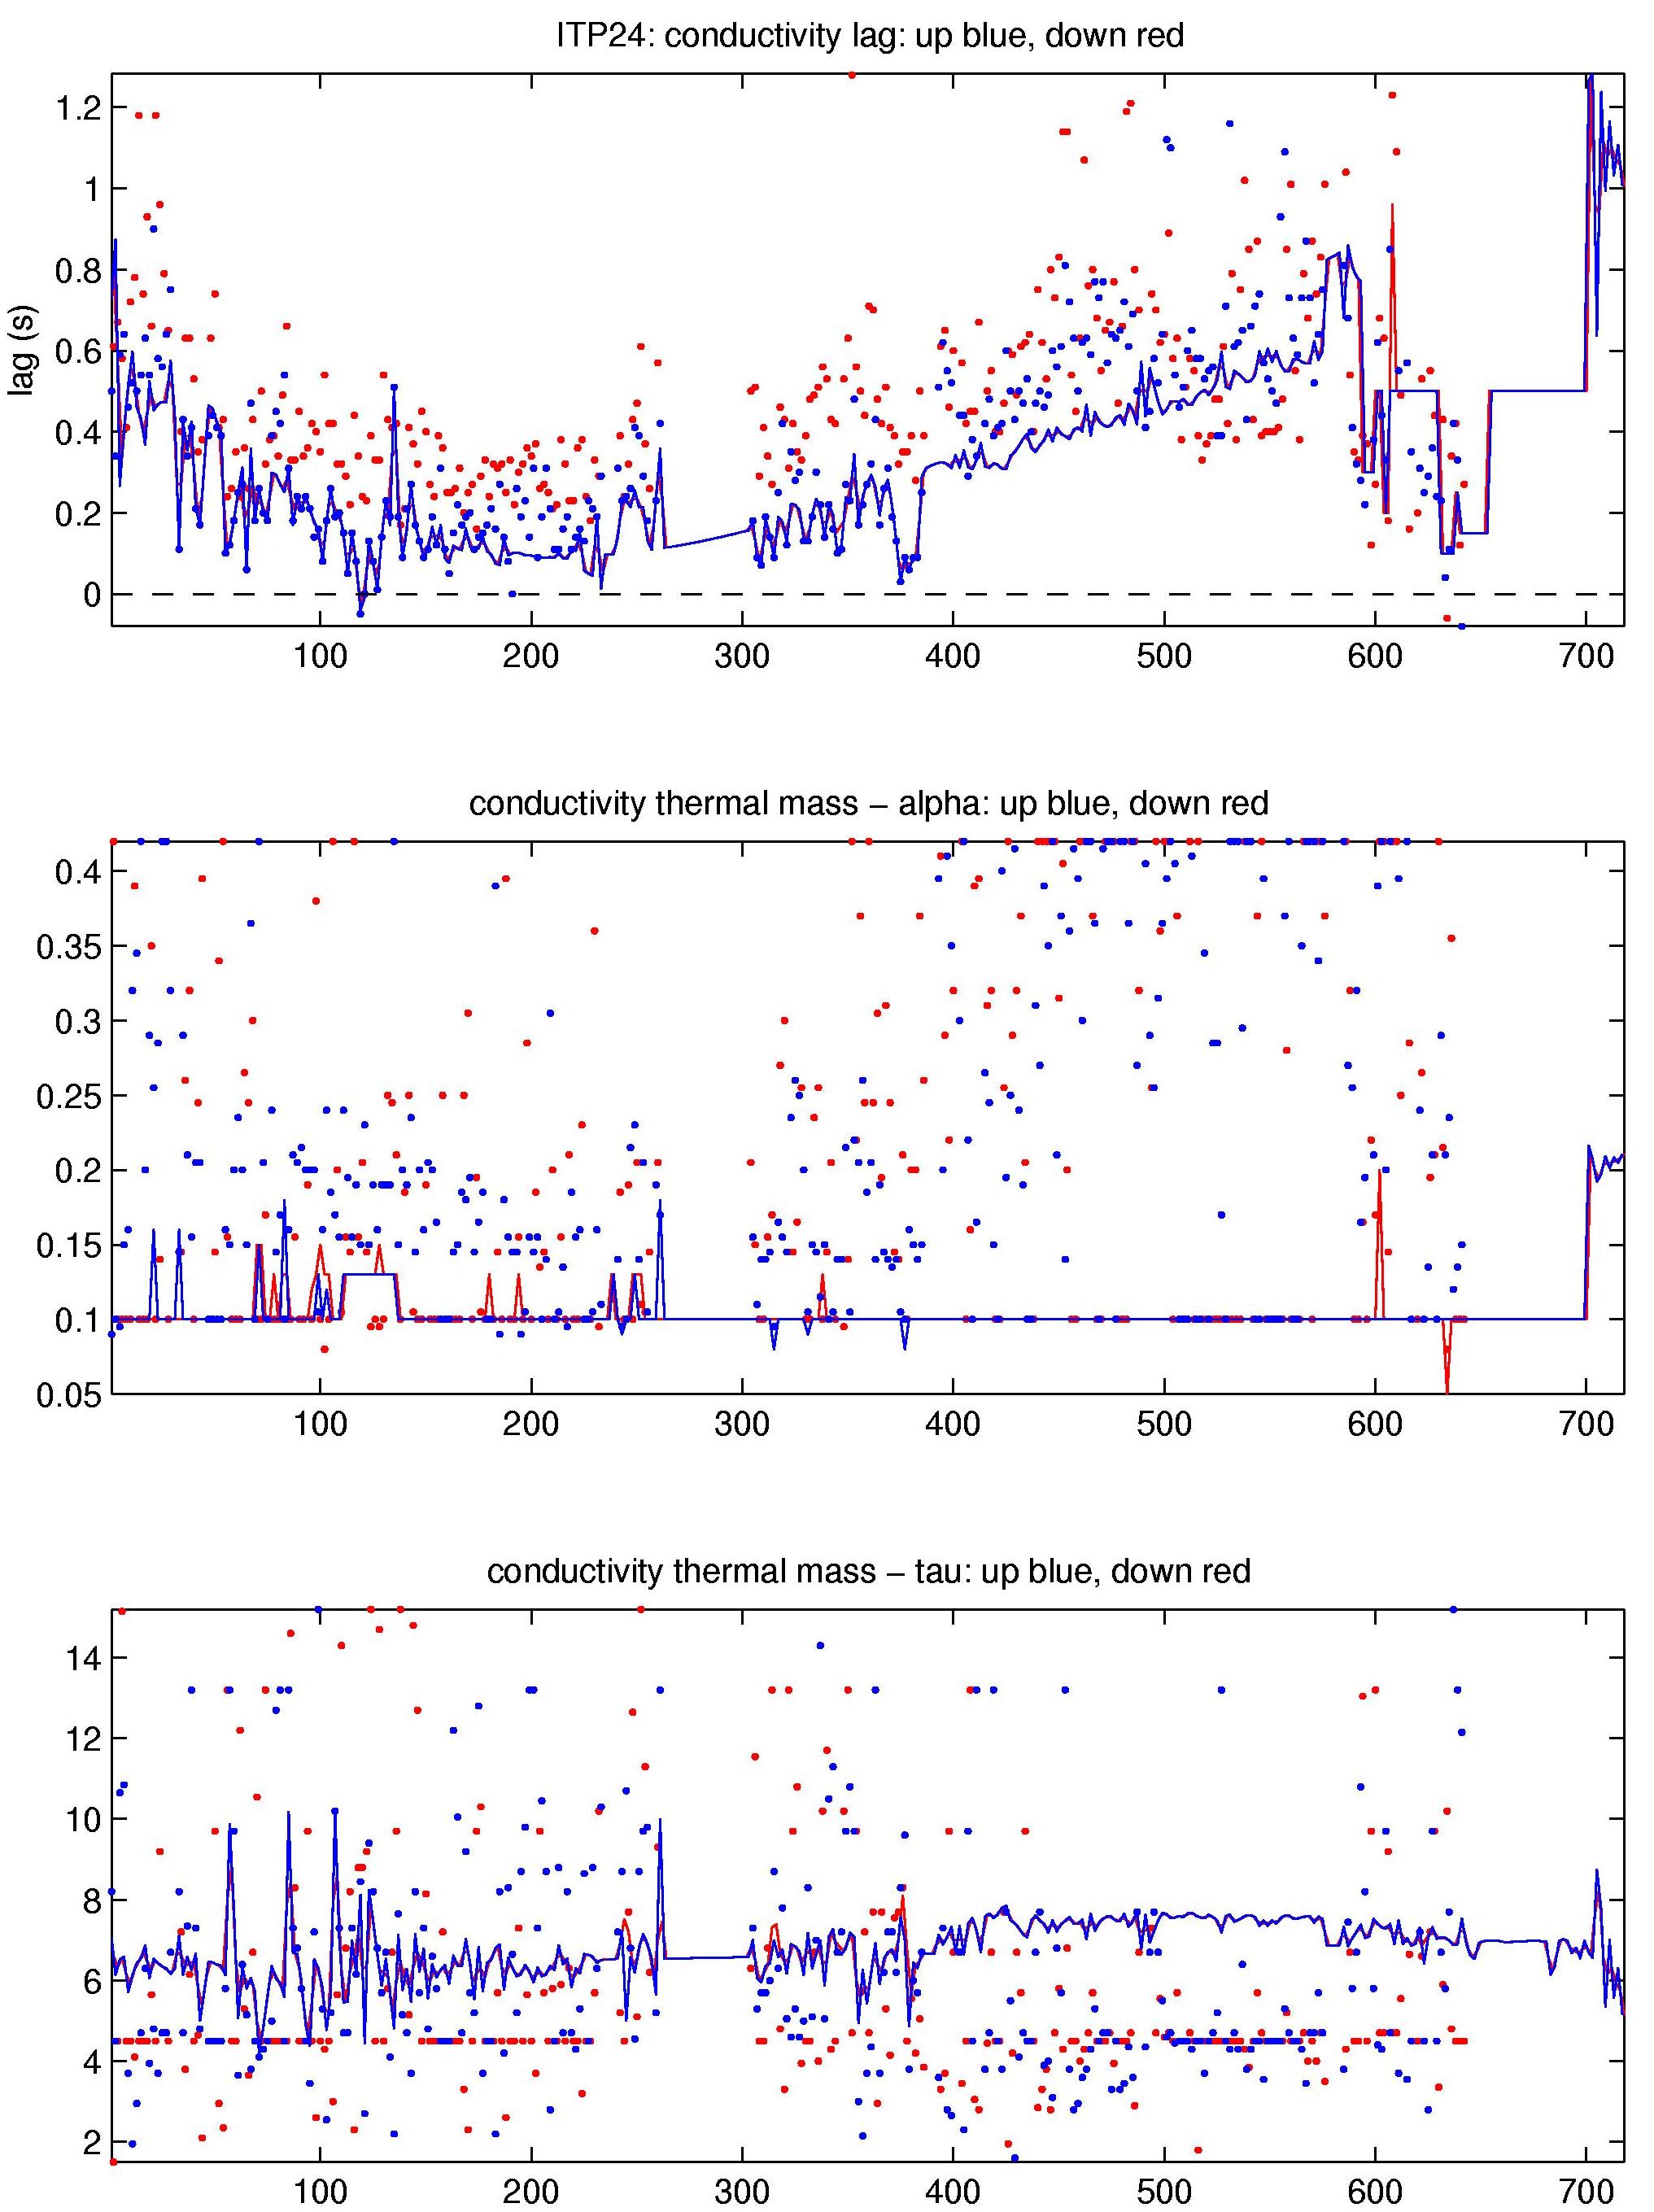
Thermohaline staircases were present for a large portion of the time series, enabling CTD lag corrections. The lags were in the typical range found for previous systems. During manual editing, thermal lag corrections were dialed back somewhat (primarily by reducing alpha) to remove overcompensation. We speculate that a large number of small TS steps in the shallow portion of the staircase range biased the thermal lag calculation towards higher amplitudes. A smaller set of thermistor lag corrections and, towards the end of the record, conductivity- temperature time offsets were also modified to reduce short-term noise.
The conductivity adjustment (also called profile-to-profile calibration) was fairly constant for this ITP. During visual editing, small adjustments were made to the calculated values (typically to bringing them closer in line with their neighboring values) for a few profiles to better align their deep TS and density profiles with surrounding data.
qflag definitions:
3: good (from "level 3 processing")
2: uncalibrated (flag not yet used)
1: questionable. No fault found, but noiser etc.
0: bad (data currently set to nan as well for backward compatibility)
See the Data Products tab to the left for descriptions of the three levels (I, II, III) of data processing and to access all data.
