ITP 26 Data Description
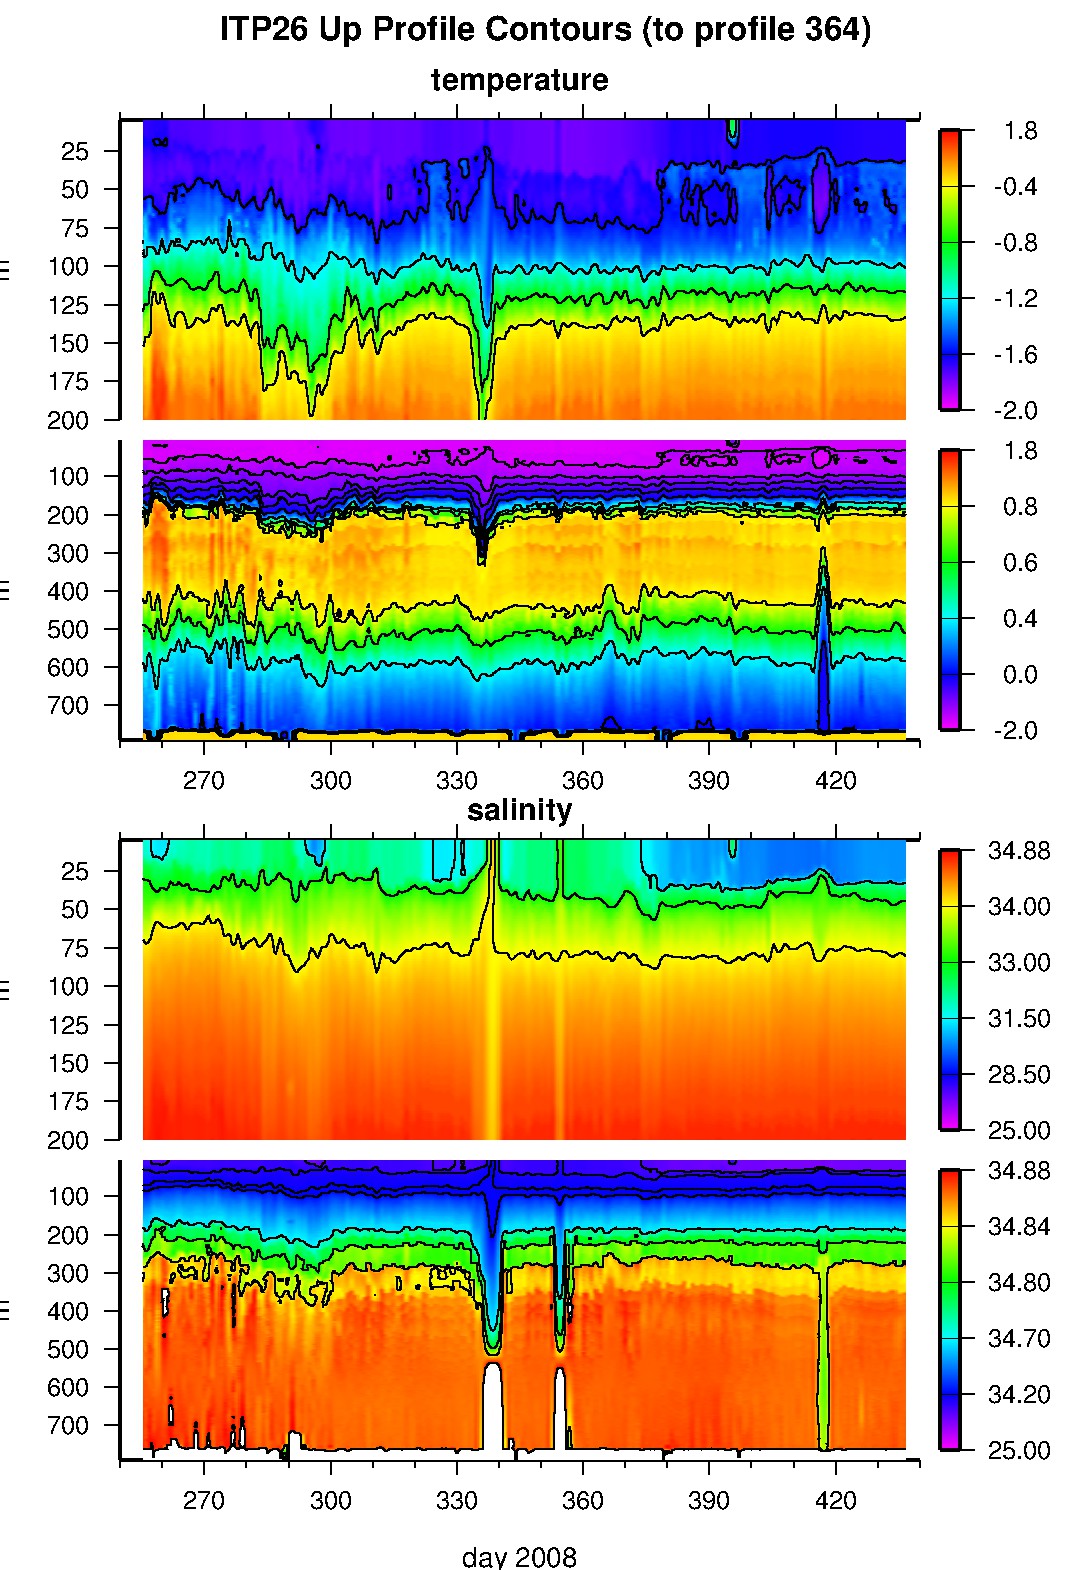
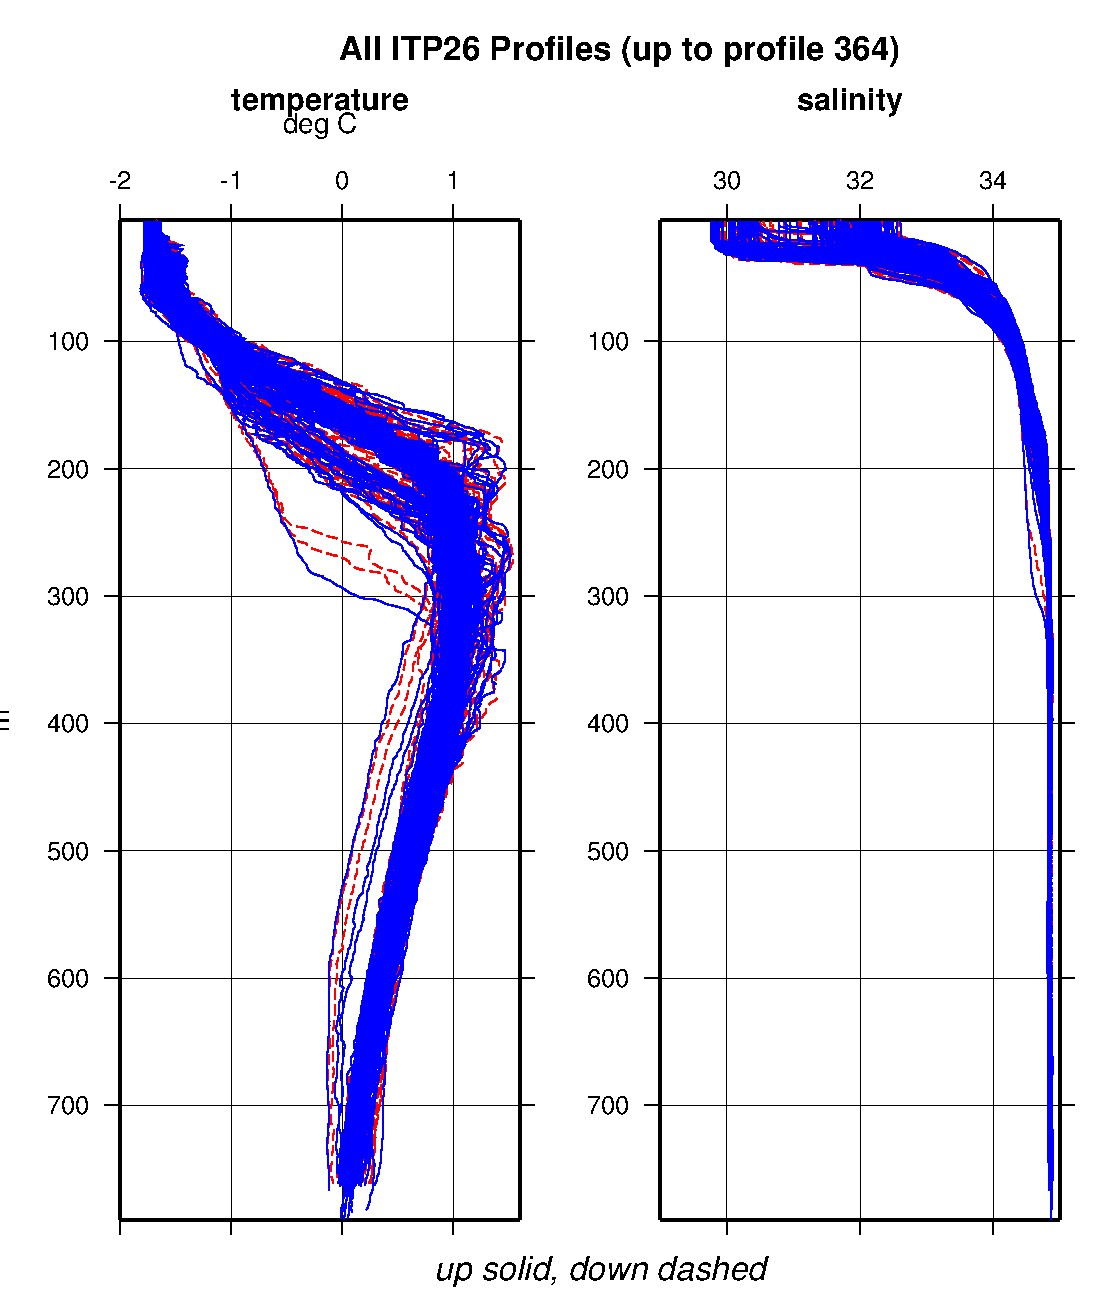
ITP 26 profiler was configured to operate with a standard sampling schedule of 2 one-way profiles between 7 and 750 m depth each day. In the surface package, the GPS receiver was powered hourly to obtain locations, and buoy temperature and battery voltage status were recorded.
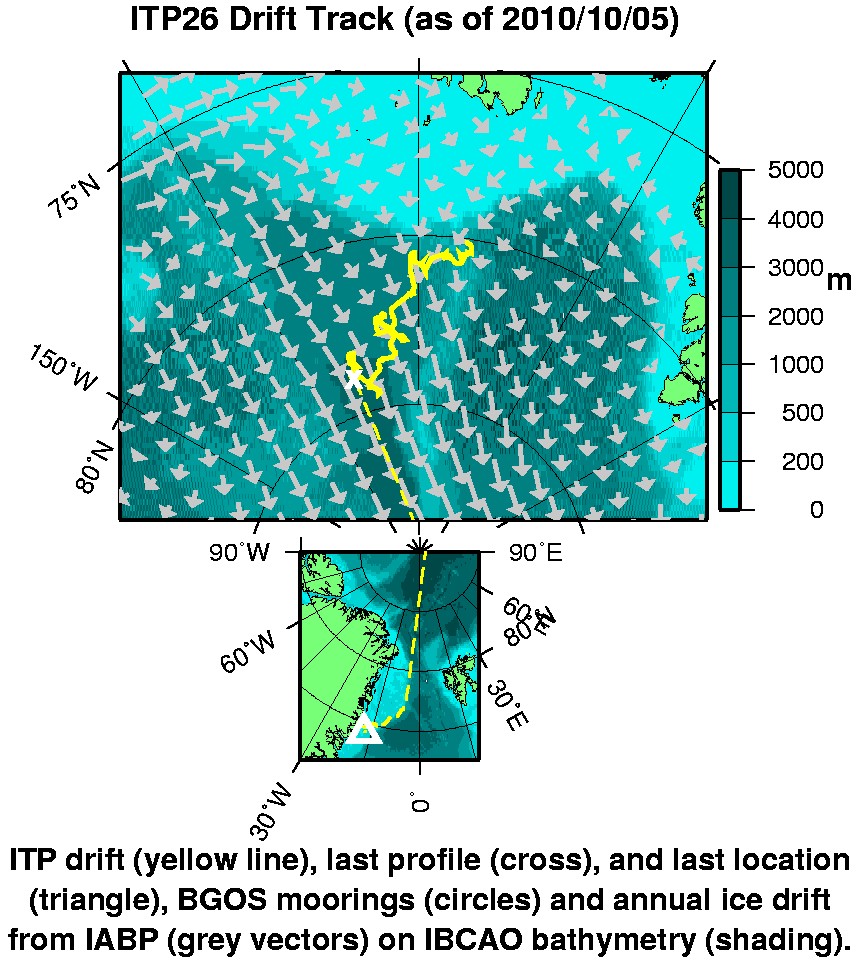
Between its deployment in September 2008 and February 26, 2009, the ITP transmitted 338 profiles (in 168 days) while drifting in the central Arctic Basin before transmissions from the surface unit ceased. Over 17 months (530 days) later, the surface package resurfaced some 700 km south in the East Greenland current in August 2010 and resumed sending its stored queue of status and profile data. Another 26 profiles (up to March 10, 2009) were recovered with GPS locations until the profiler stopped communicating with the surface unit and the location fixes could no longer be obtained. At that same time, the temperature of the surface package suddenly increased from -30° C to slightly more than 0° C in less than a day and remained largely constant at that temperature until it reappeared again. The evidence suggests that the package was likely caught in a ridging event when it ceased transmissions in February, and subsequently pushed below the ice in March when the underwater unit ceased communicating (perhaps the cable was severed at this time).
The plots to the right are of the final, calibrated, edited data (as opposed to the raw data presented on the active instrument pages).
See the Data Products tab to the left for descriptions of the three levels (I, II, III) of data processing and to access all data.
ITP 26 data can also be found at the links below:
Level II hourly buoy location data in ASCII format: itp26rawlocs.dat
Level III 1-Hz processed profile data in MATLAB format: itp26cormat.tar.Z and itp26cormat.zip
Level III 1-db bin-averaged processed profile data in MATLAB format: itp26final.mat
Level III 1-db bin-averaged processed profile data in ASCII format: itp26final.tar.Z and itp26final.zip


