ITP47 Data Processing
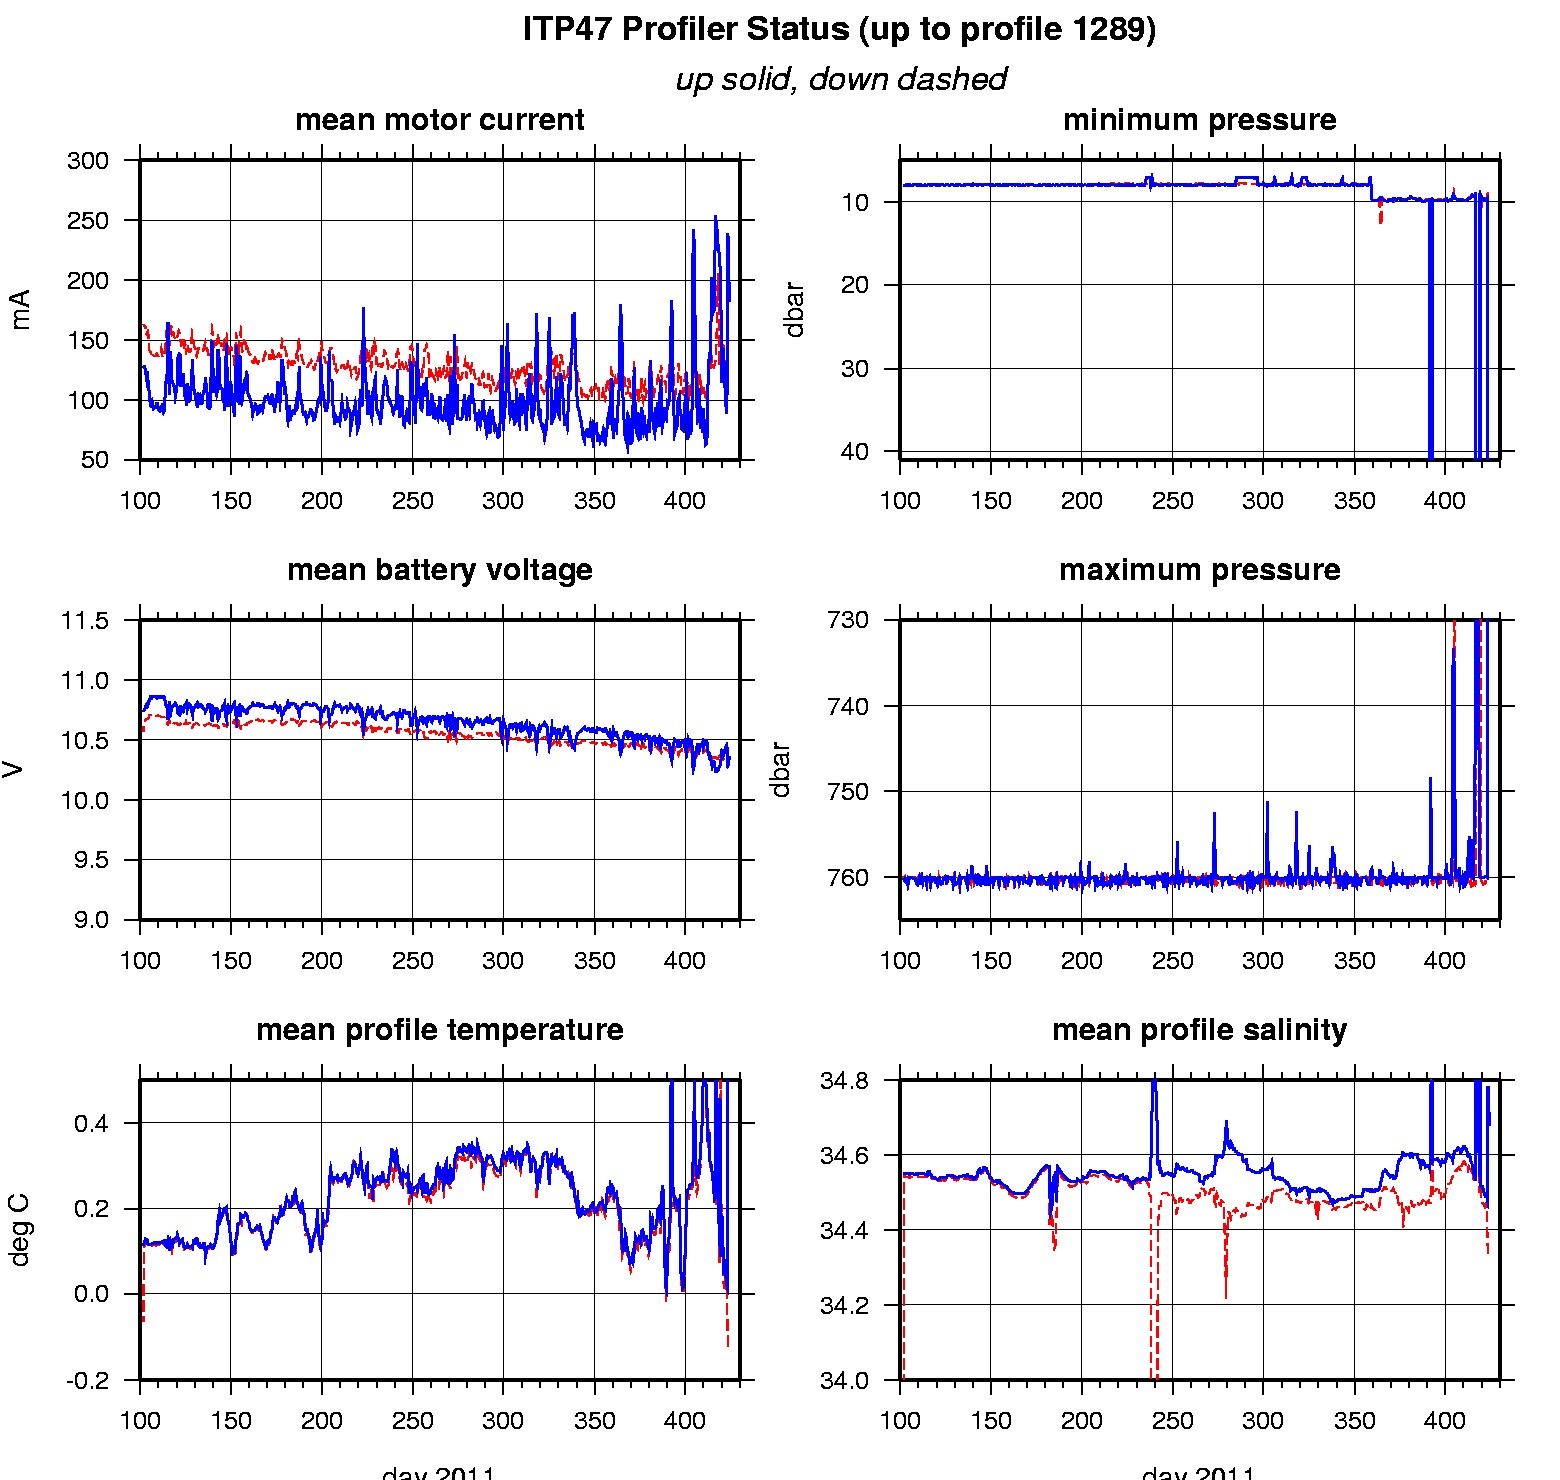
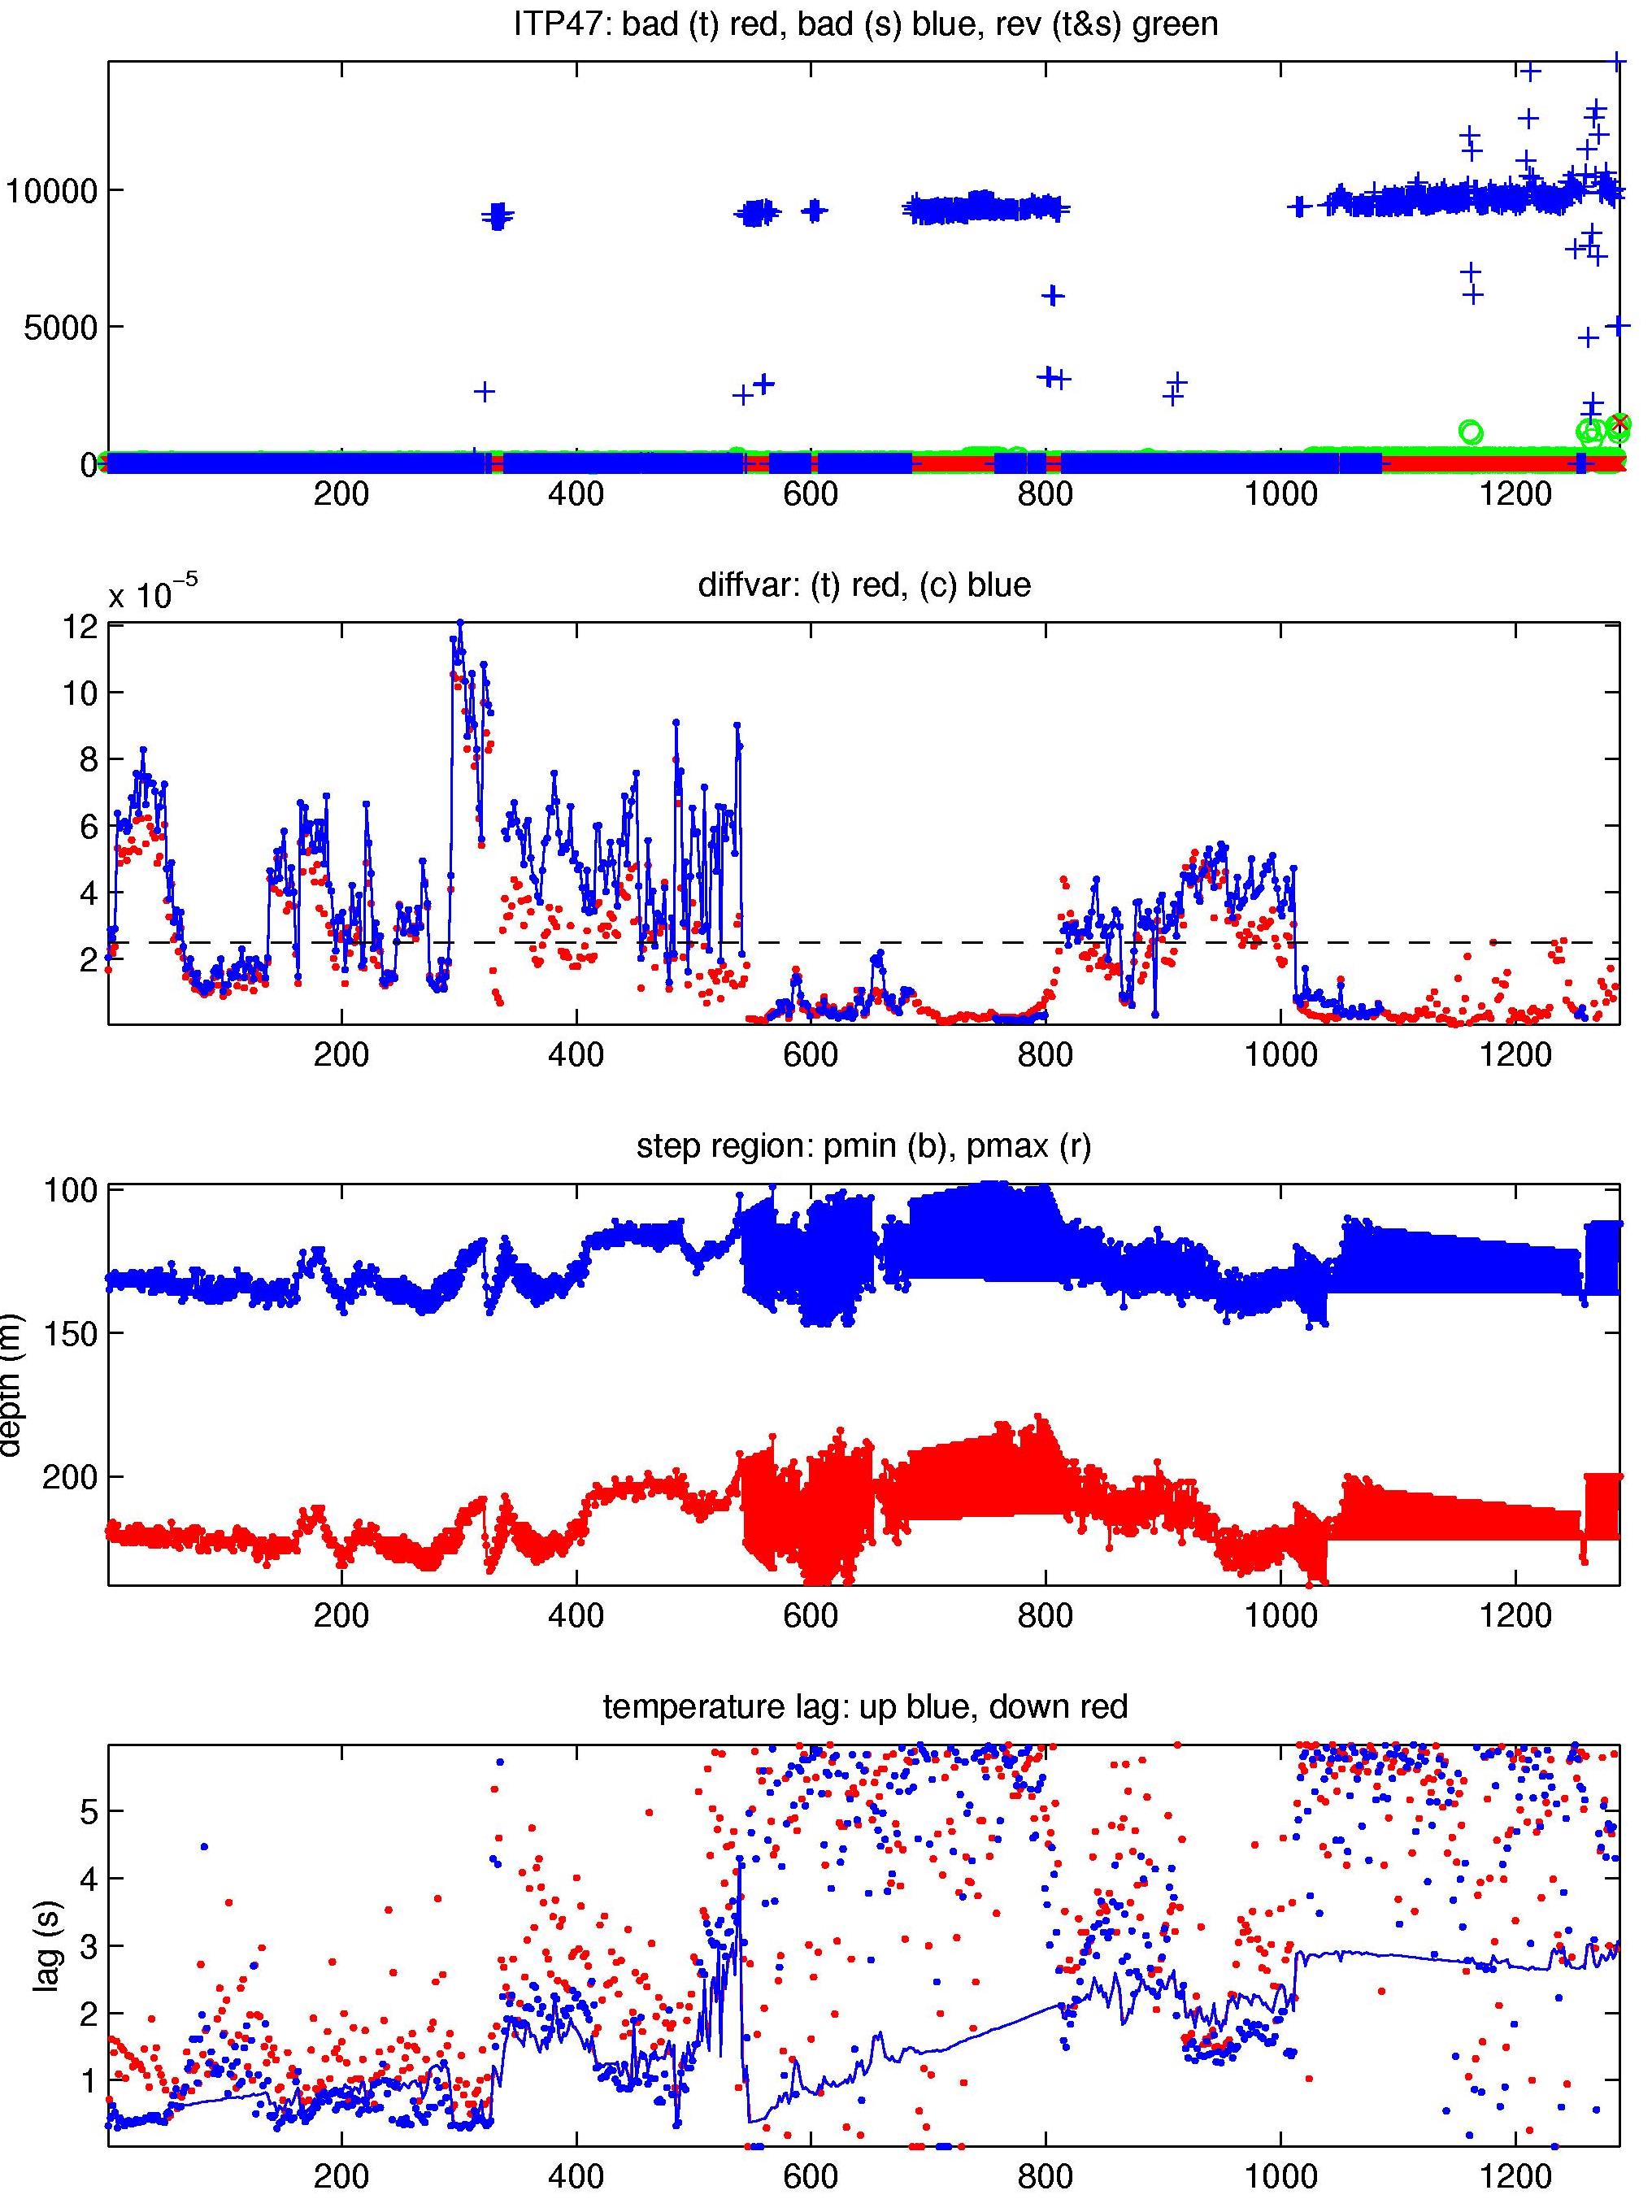
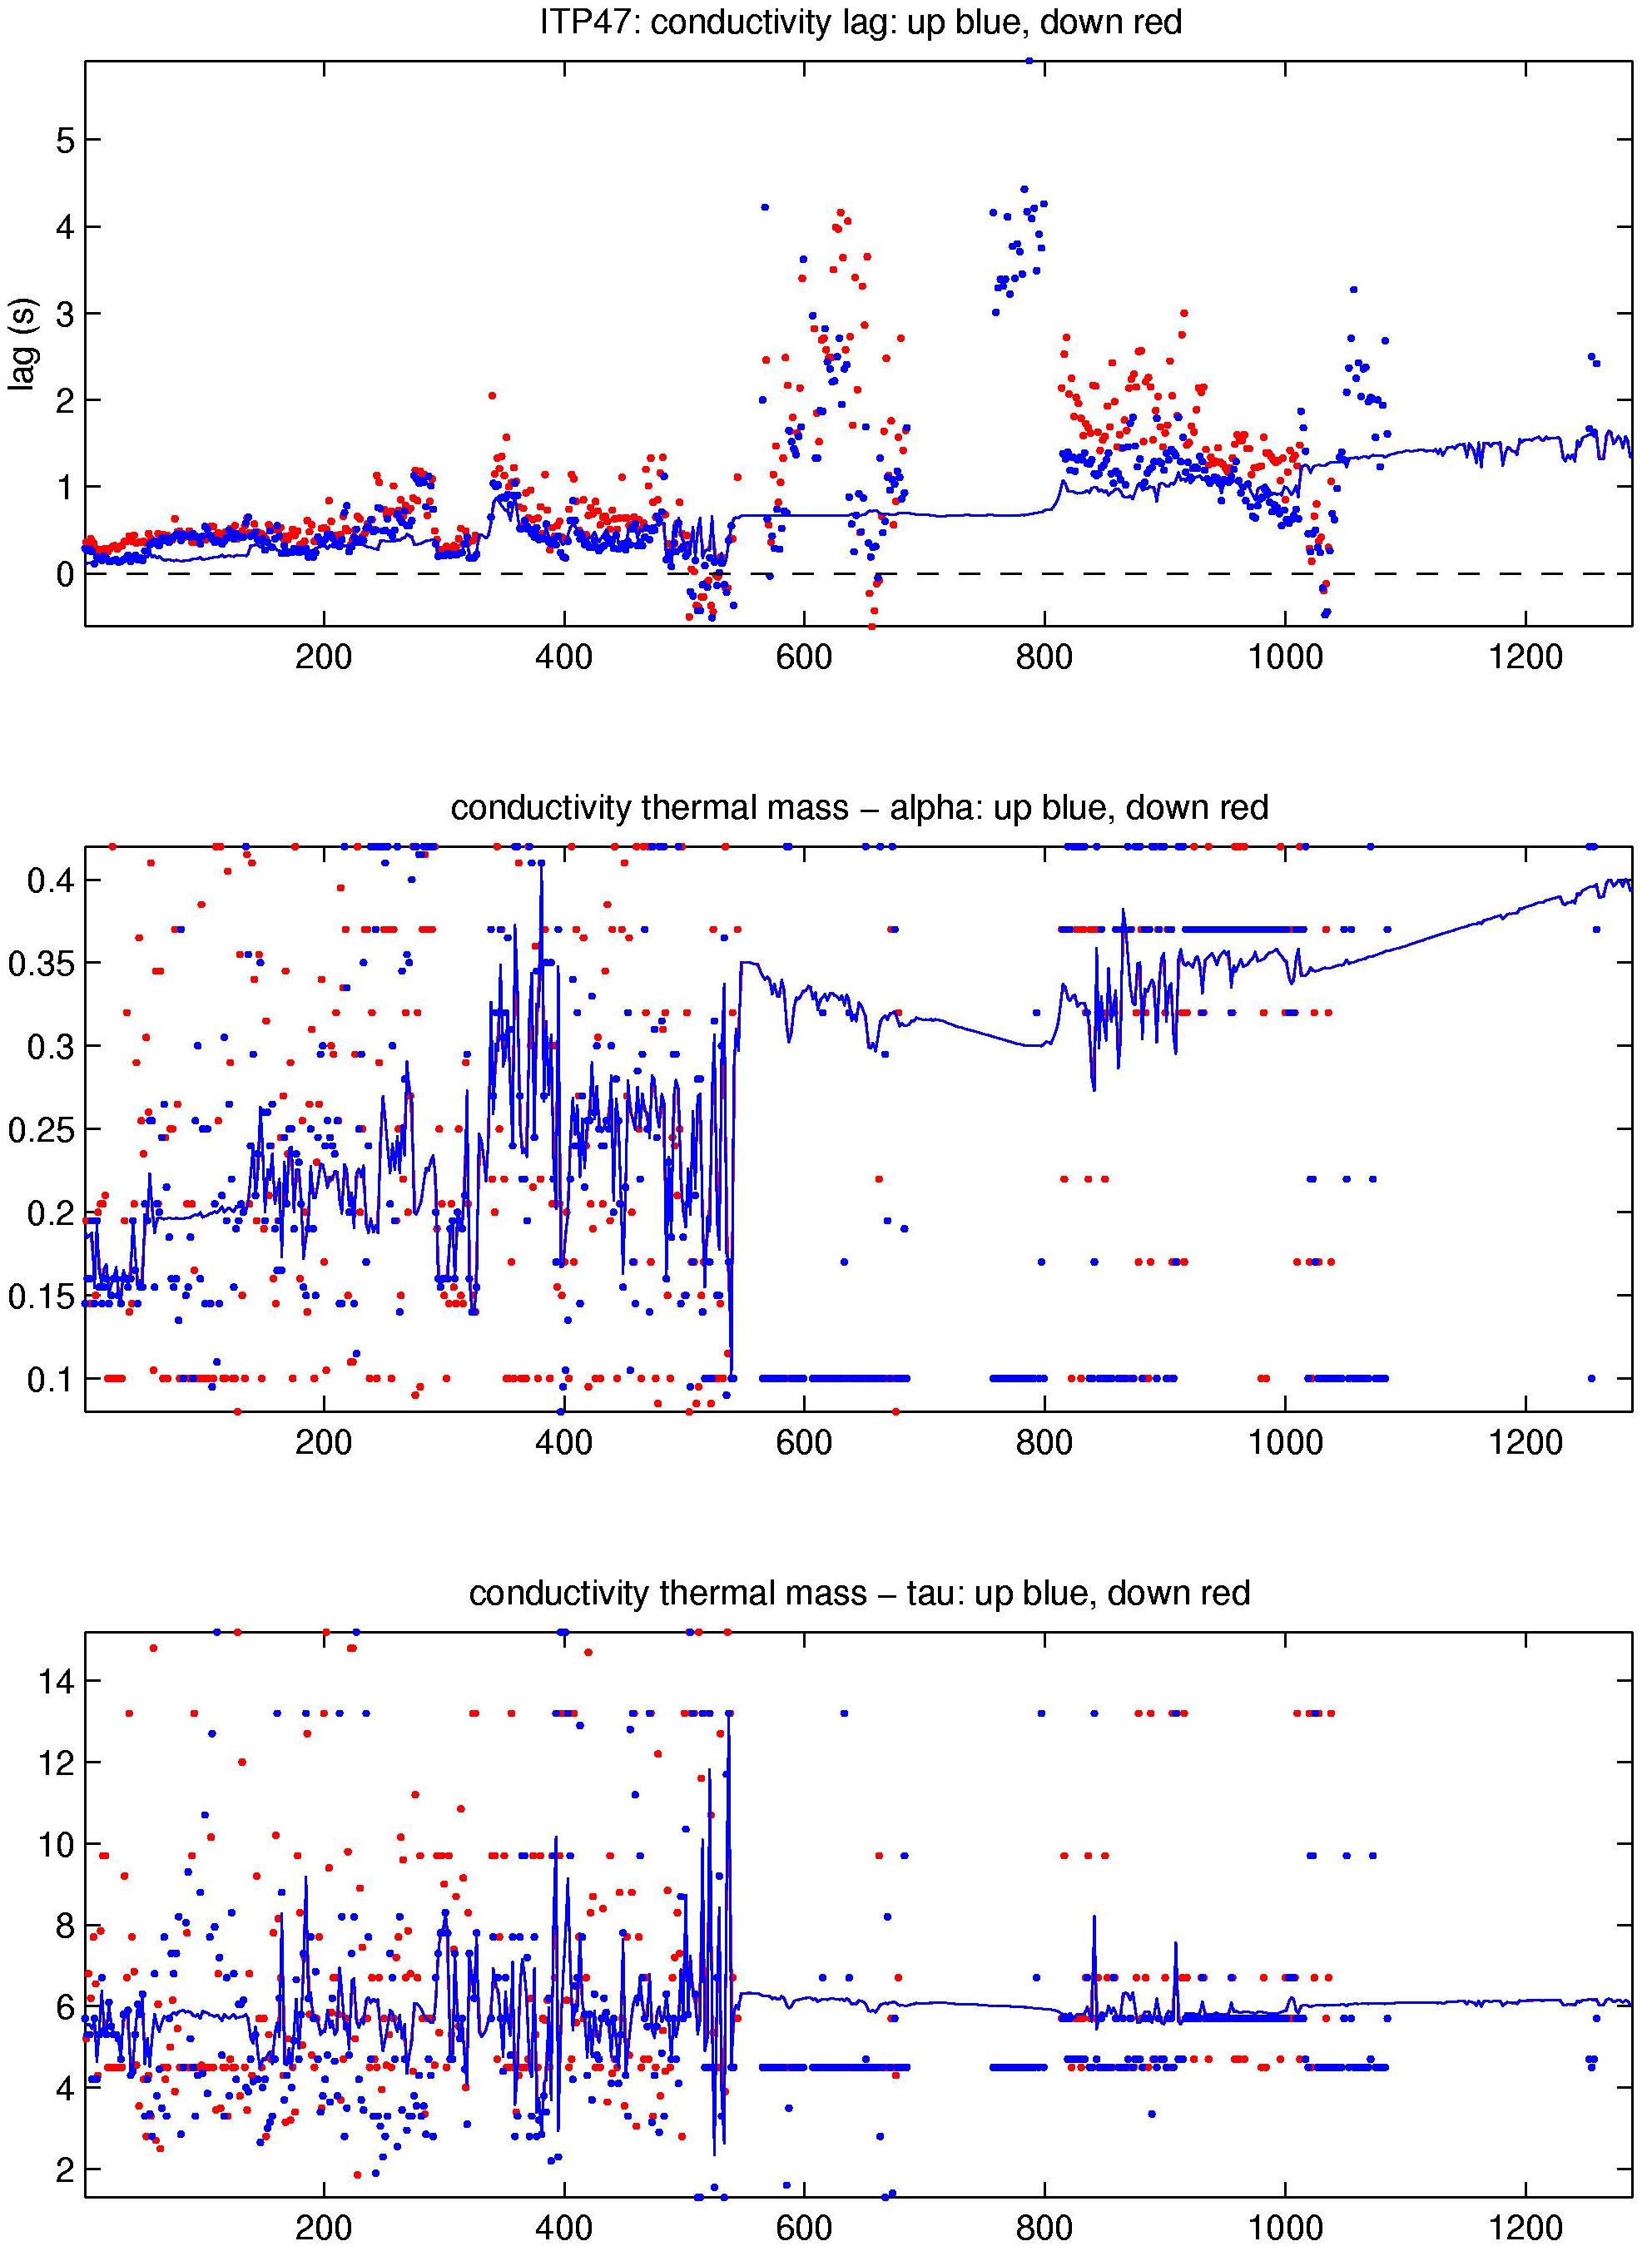
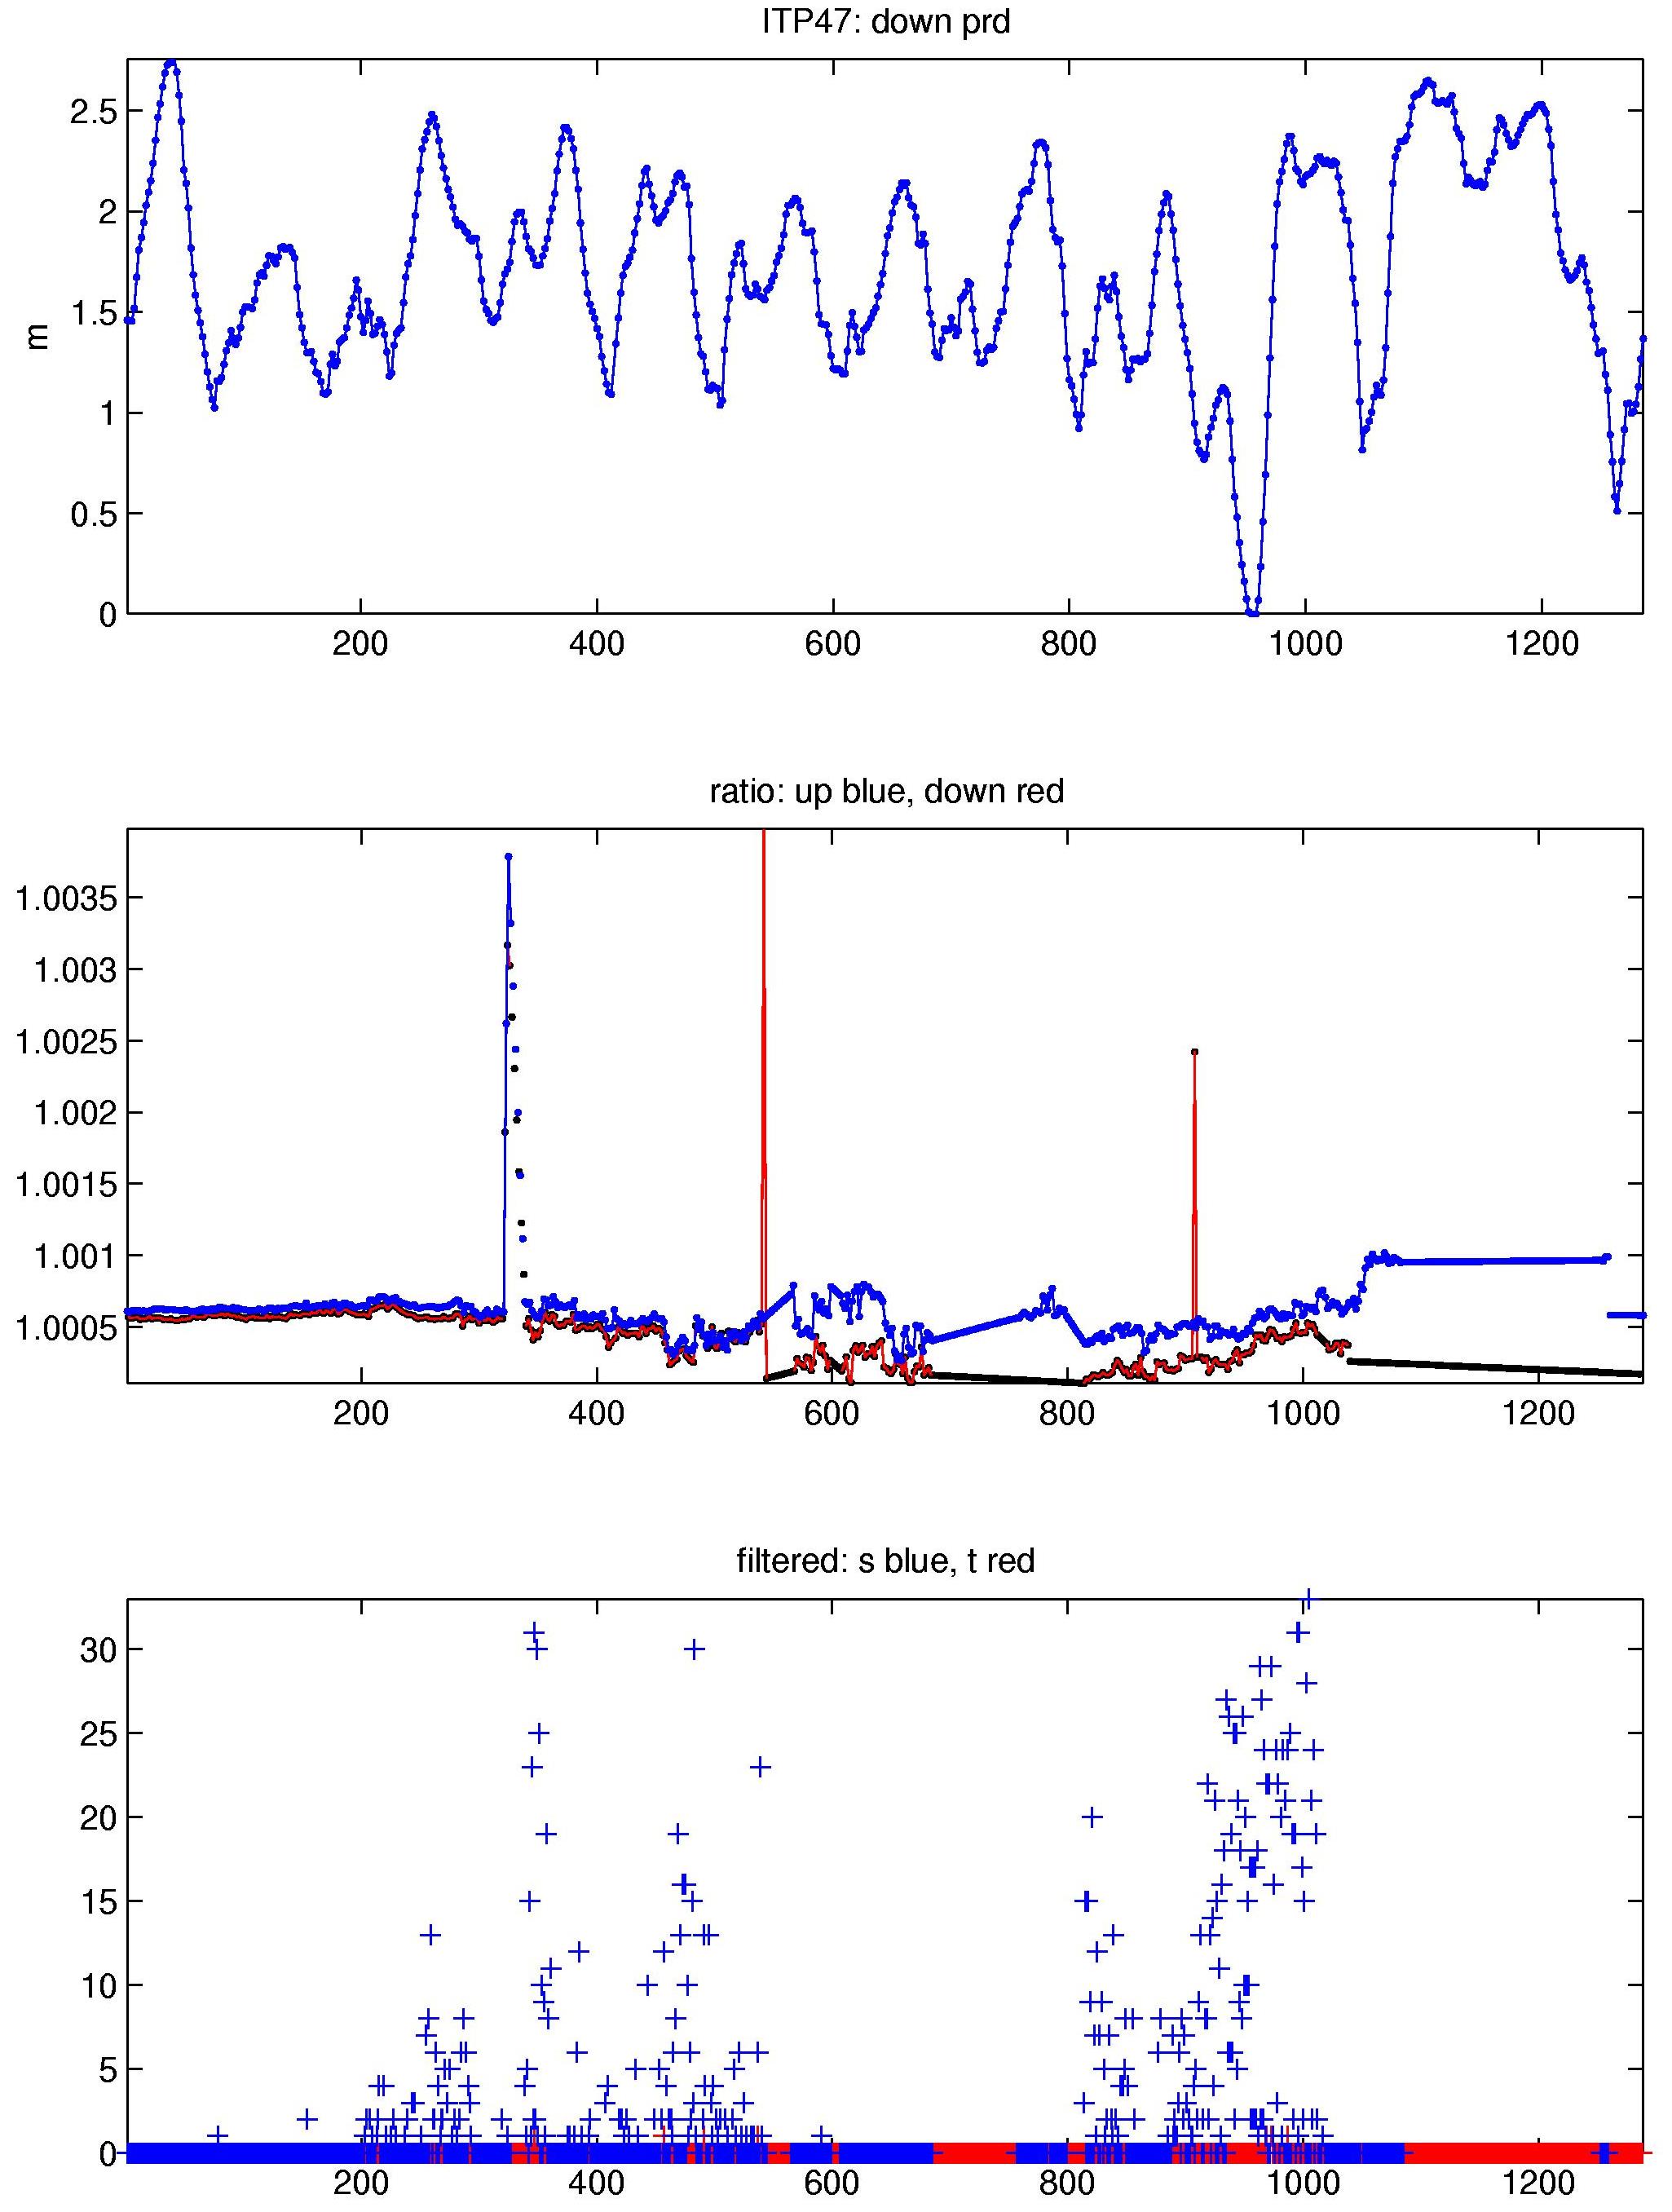
The 1289 profiles that were recovered from the ITP were processed according to the procedures described in the ITP Updated Data Processing Procedures. The processing parameters for ITP 23 are shown in the figures to the right. Buoy drift speeds were almost always less than 30 cm/s while traversing the Arctic Basin so the profiler covered the full extent of nearly every profile that it communicated to the surface package.
Some thermohaline staircases were present during the time series, enabling CTD lag correction estimates. However, the lags were only in typical ranges for the first 330 profiles, then fouling or icing of the CTD sensors resulted in longer response times. The lags could be largely corrected up to profile 540, but afterwards nearly all of the data were subject to some degree of dampening. This is most evident from the hysteresis in T-S plots between up and down profiles throughout the halocline, and appears as large differences between up and down profile potential conductivity (rat) corrections. The more robust temperature data are not affected as much as the conductivity data, so most of the temperature data are retained. However, nearly 30% of the salinity profiles had to be eliminated, and all of the remaining ones after profile 542 should be considered questionable, particularly those up to profile 800. The quality of the salinity profiles retained after profile 800 are somewhat better, but still show some hysteresis in T-S space and should be considered of lesser quality.
On December 24, 2011 transmissions from the surface package ceased, presumably due to the buoy being submerged below the ice, however did later resume on May 19, 2012, but no GPS locations were acquired during the gap. Meanwhile, the profiler had continued to profile and relay data to the surface package until February 28, 2012. Consequently, locations for all profiles beginning with 1026 have been reconstructed using Fowler (2003) daily ice motion vectors.
See the Data Products tab to the left for descriptions of the three levels (I, II, III) of data processing and to access all data.
Fowler, C. 2003, updated. Polar Pathfinder Daily 25 km EASE-Grid Sea Ice Motion Vectors. Boulder, Colorado USA: National Snow and Ice Data Center. Digital media. https://nsidc.org/data/nsidc-0116.html.


