ITP 1 Data Processing
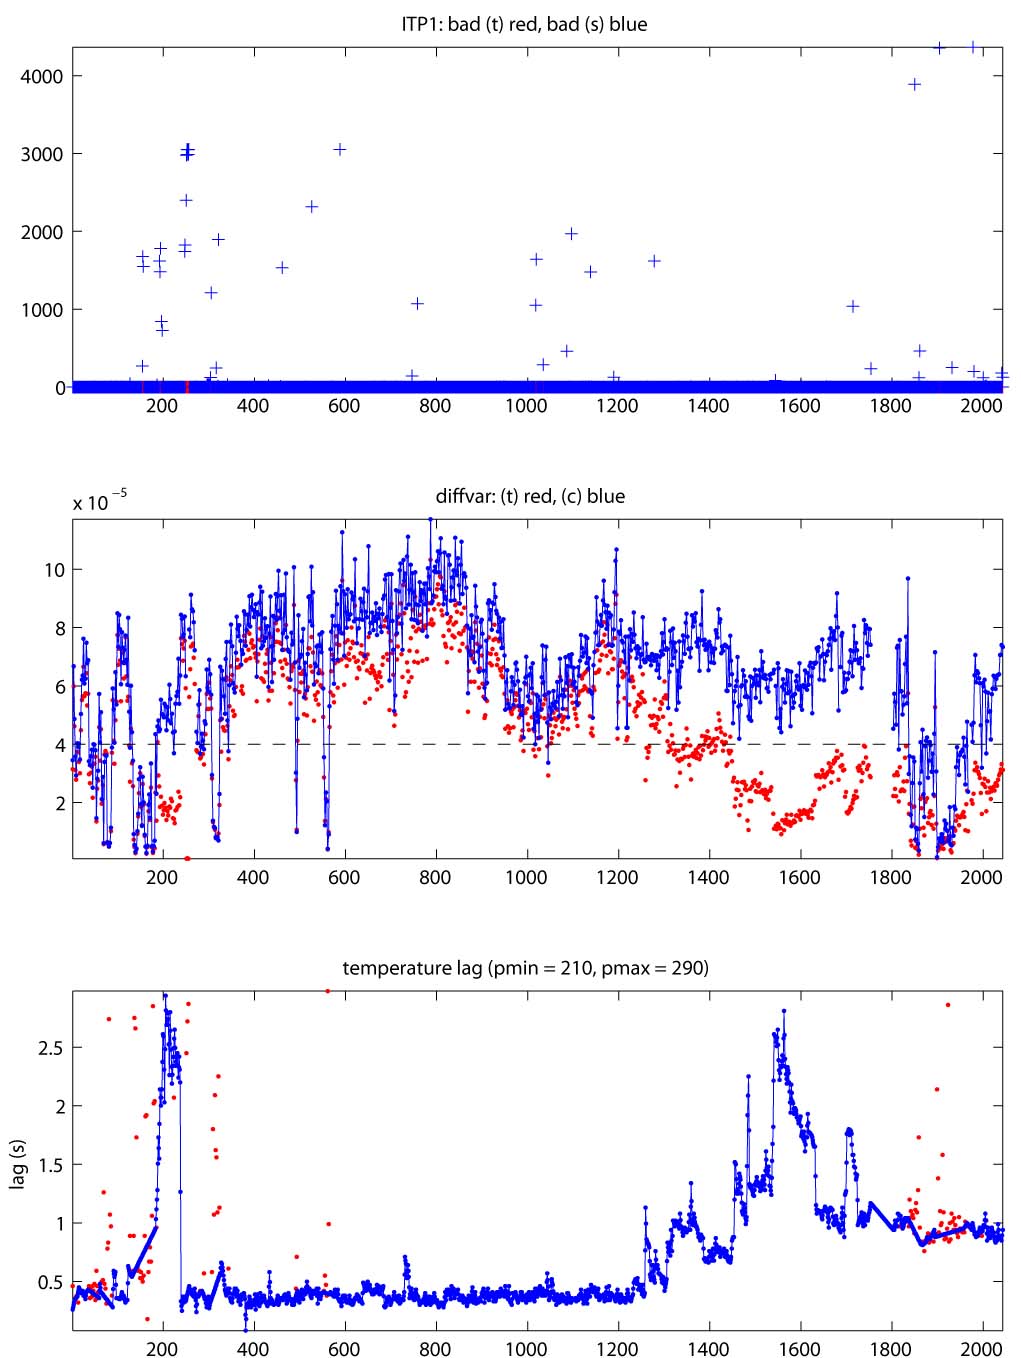
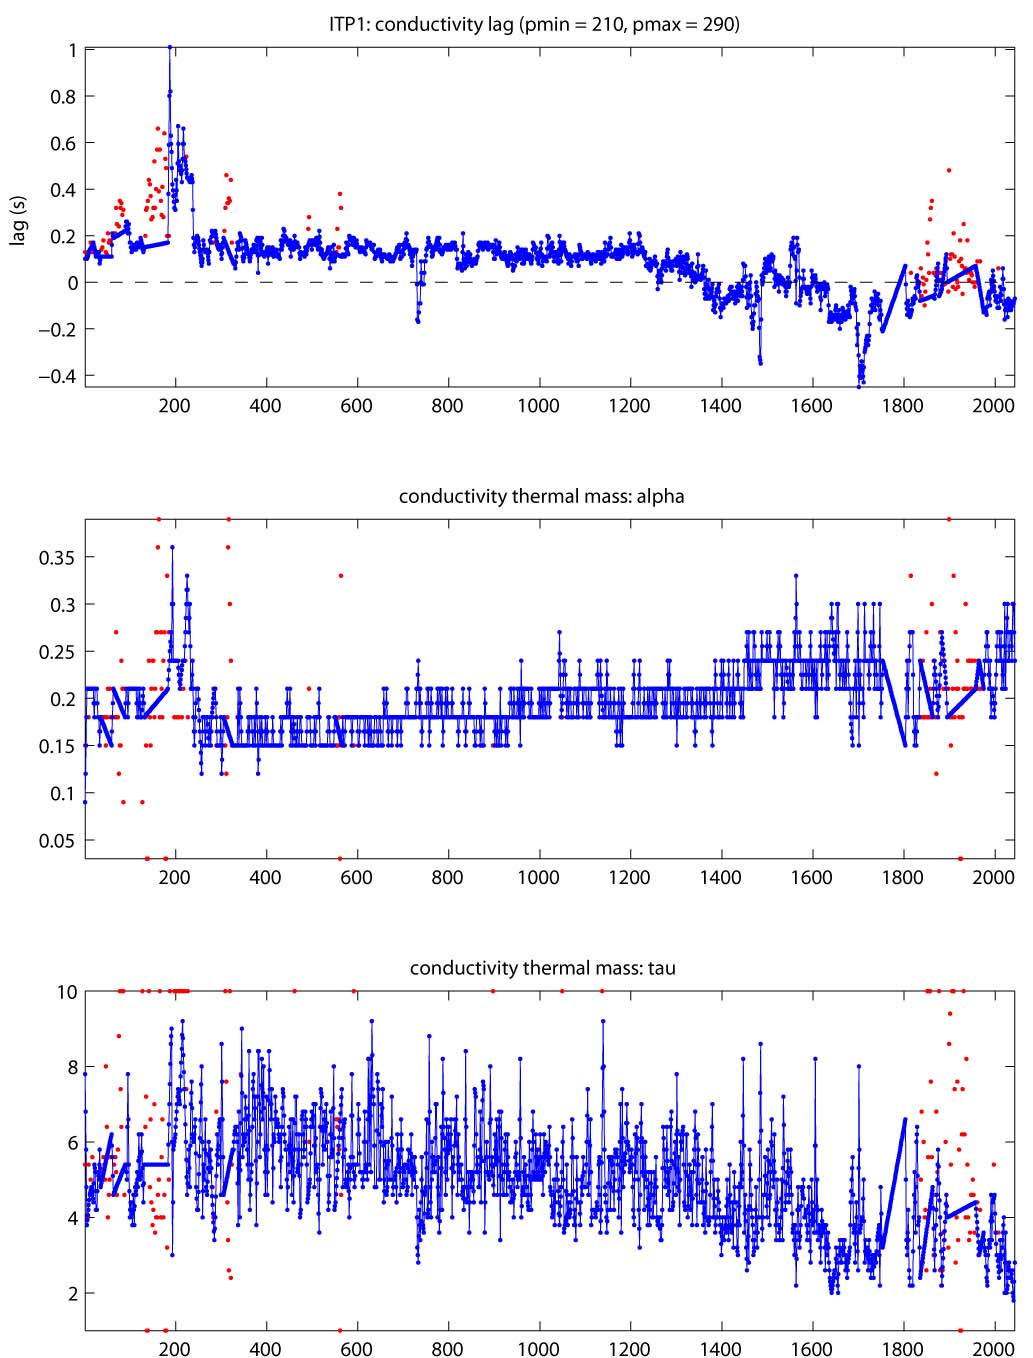
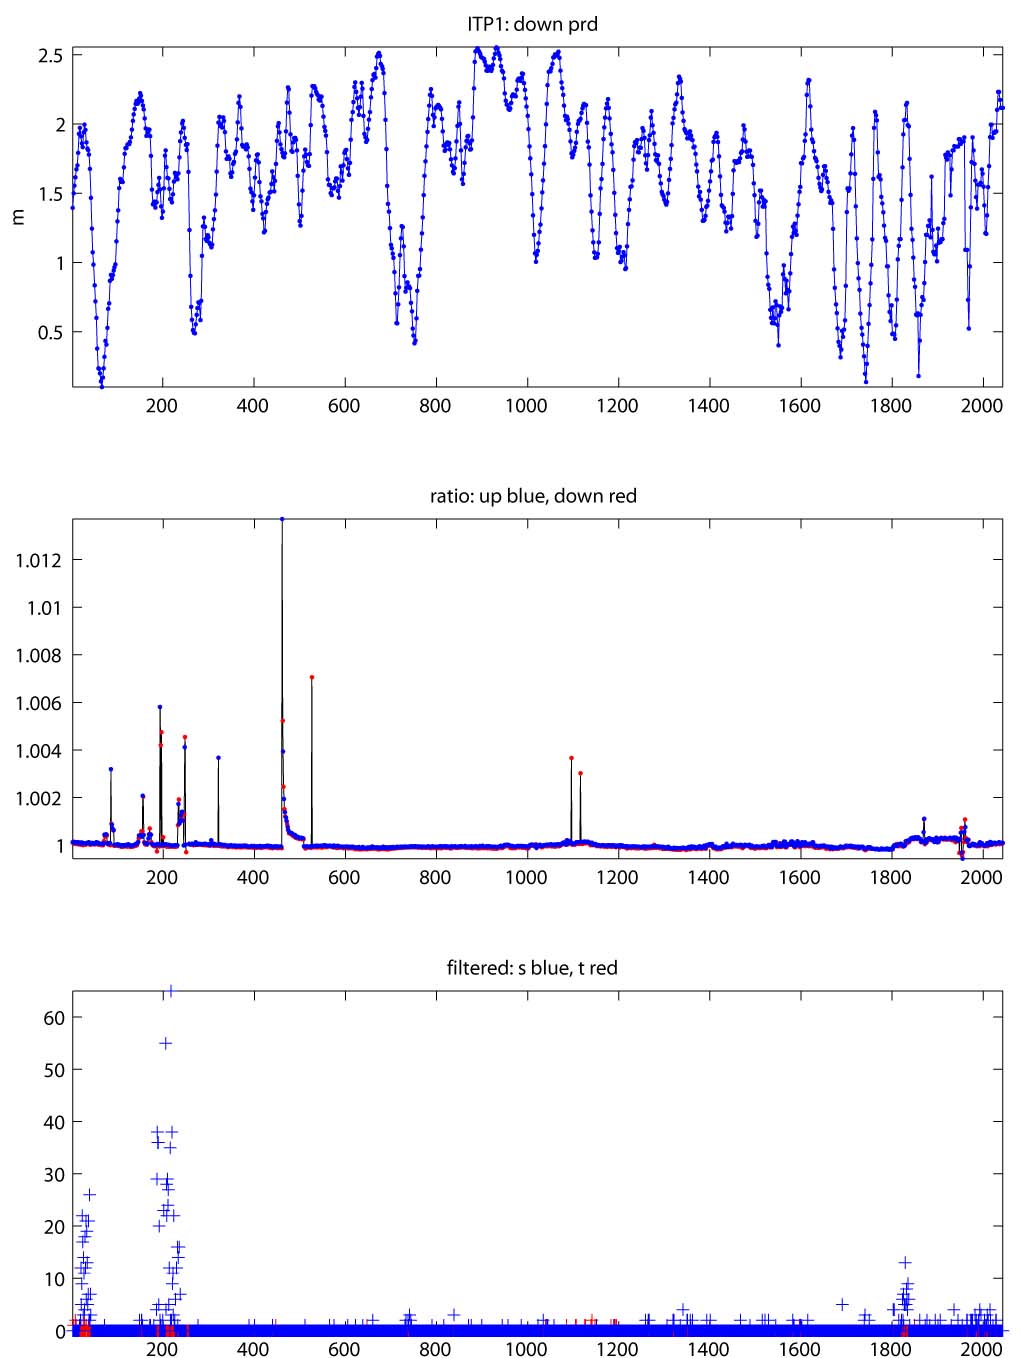
The 2043 profiles that were recovered from the ITP were processed according to the procedures described in the ITP Data Processing Procedures. The processing parameters for ITP1 are shown in the figures to the right. The time series is particularly influenced by a deep eddy(s) between profiles 70-79 and 140-176, which also coincide with shifts in the conductivity calibration ratio. Consistent sensor lags are obtained through the thermohaline staircases except in the eddy and after profile 1257 (when the staircases are not as prevalent). After about profile 1534, the profiler had more frequent difficulties completing full profiles vertically. Some of this could be related to increased ice drifts, by icing, or wire/roller wear could also be factors. No CTD information is available for profiles 1755-1802 when the instrument was stuck at the top, and from profile 1544, as apparently an instrument reset occurred in the underwater unit. Bad points due to suspected biofouling or sensor icing are removed. In the final product, 2037 profiles (99.7%) are free of more than one bad temperature measurements, and 1979 (96.9%) are free of more than one bad conductivity spikes.
See the Data Products tab to the left for descriptions of the three levels (I, II, III) of data processing and to access all data.
