ITP43 Data Processing
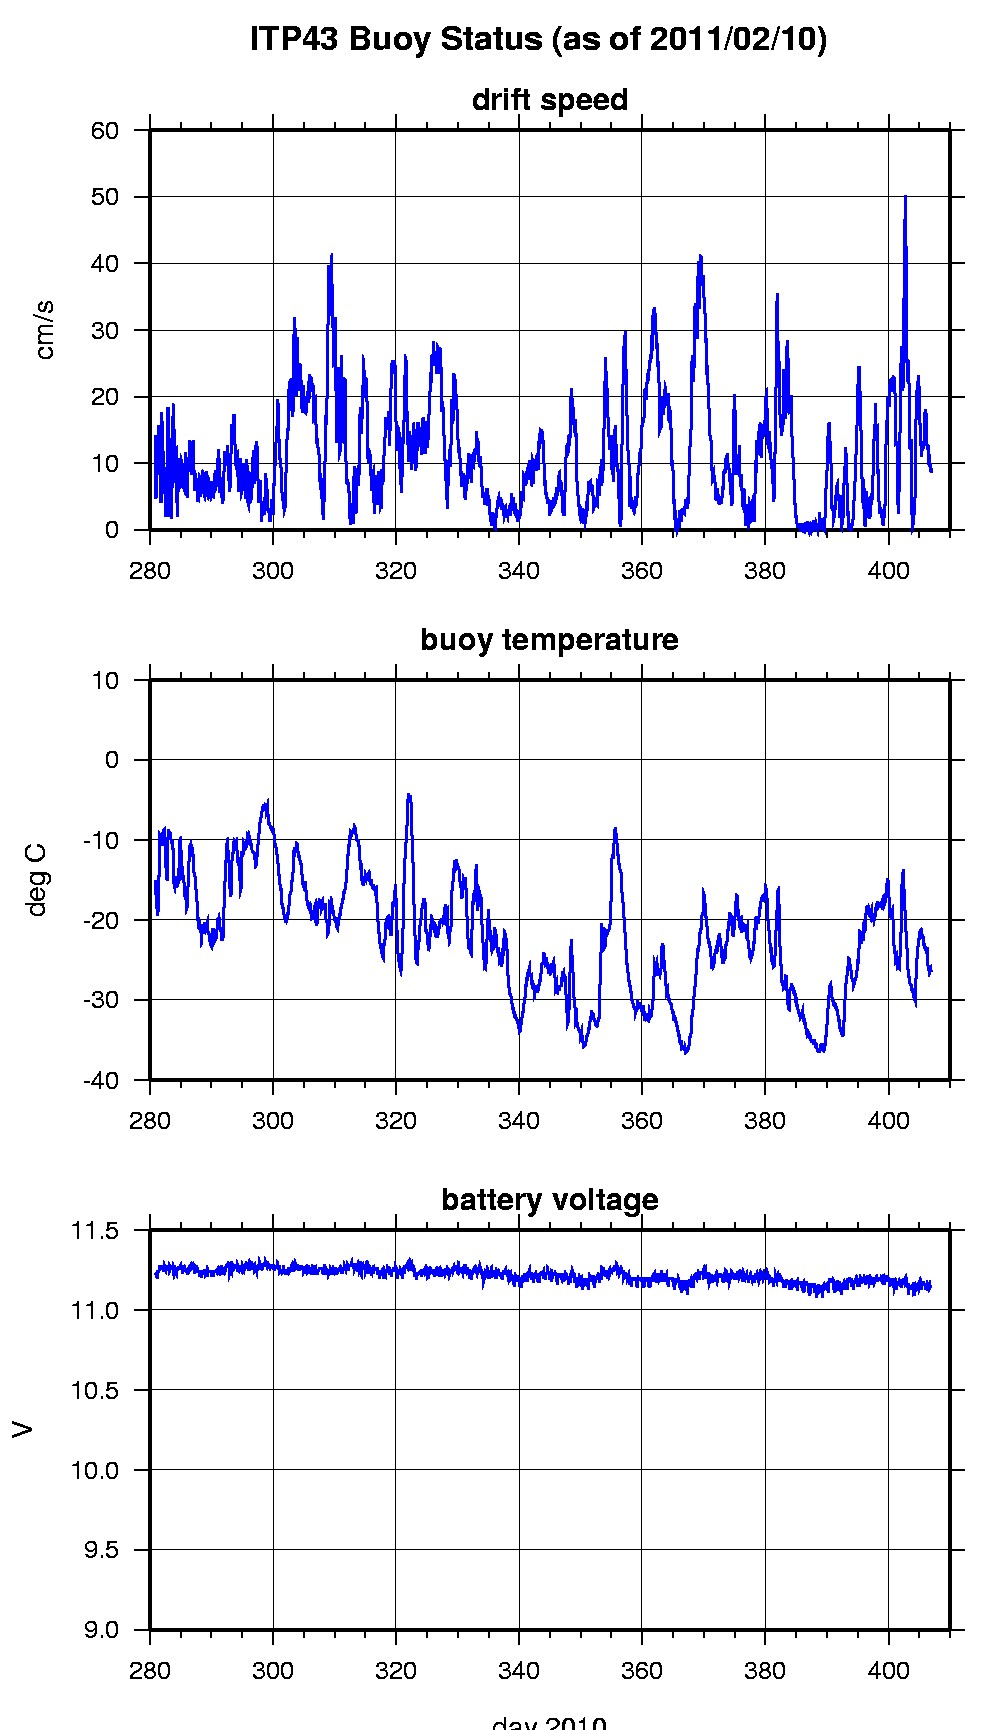
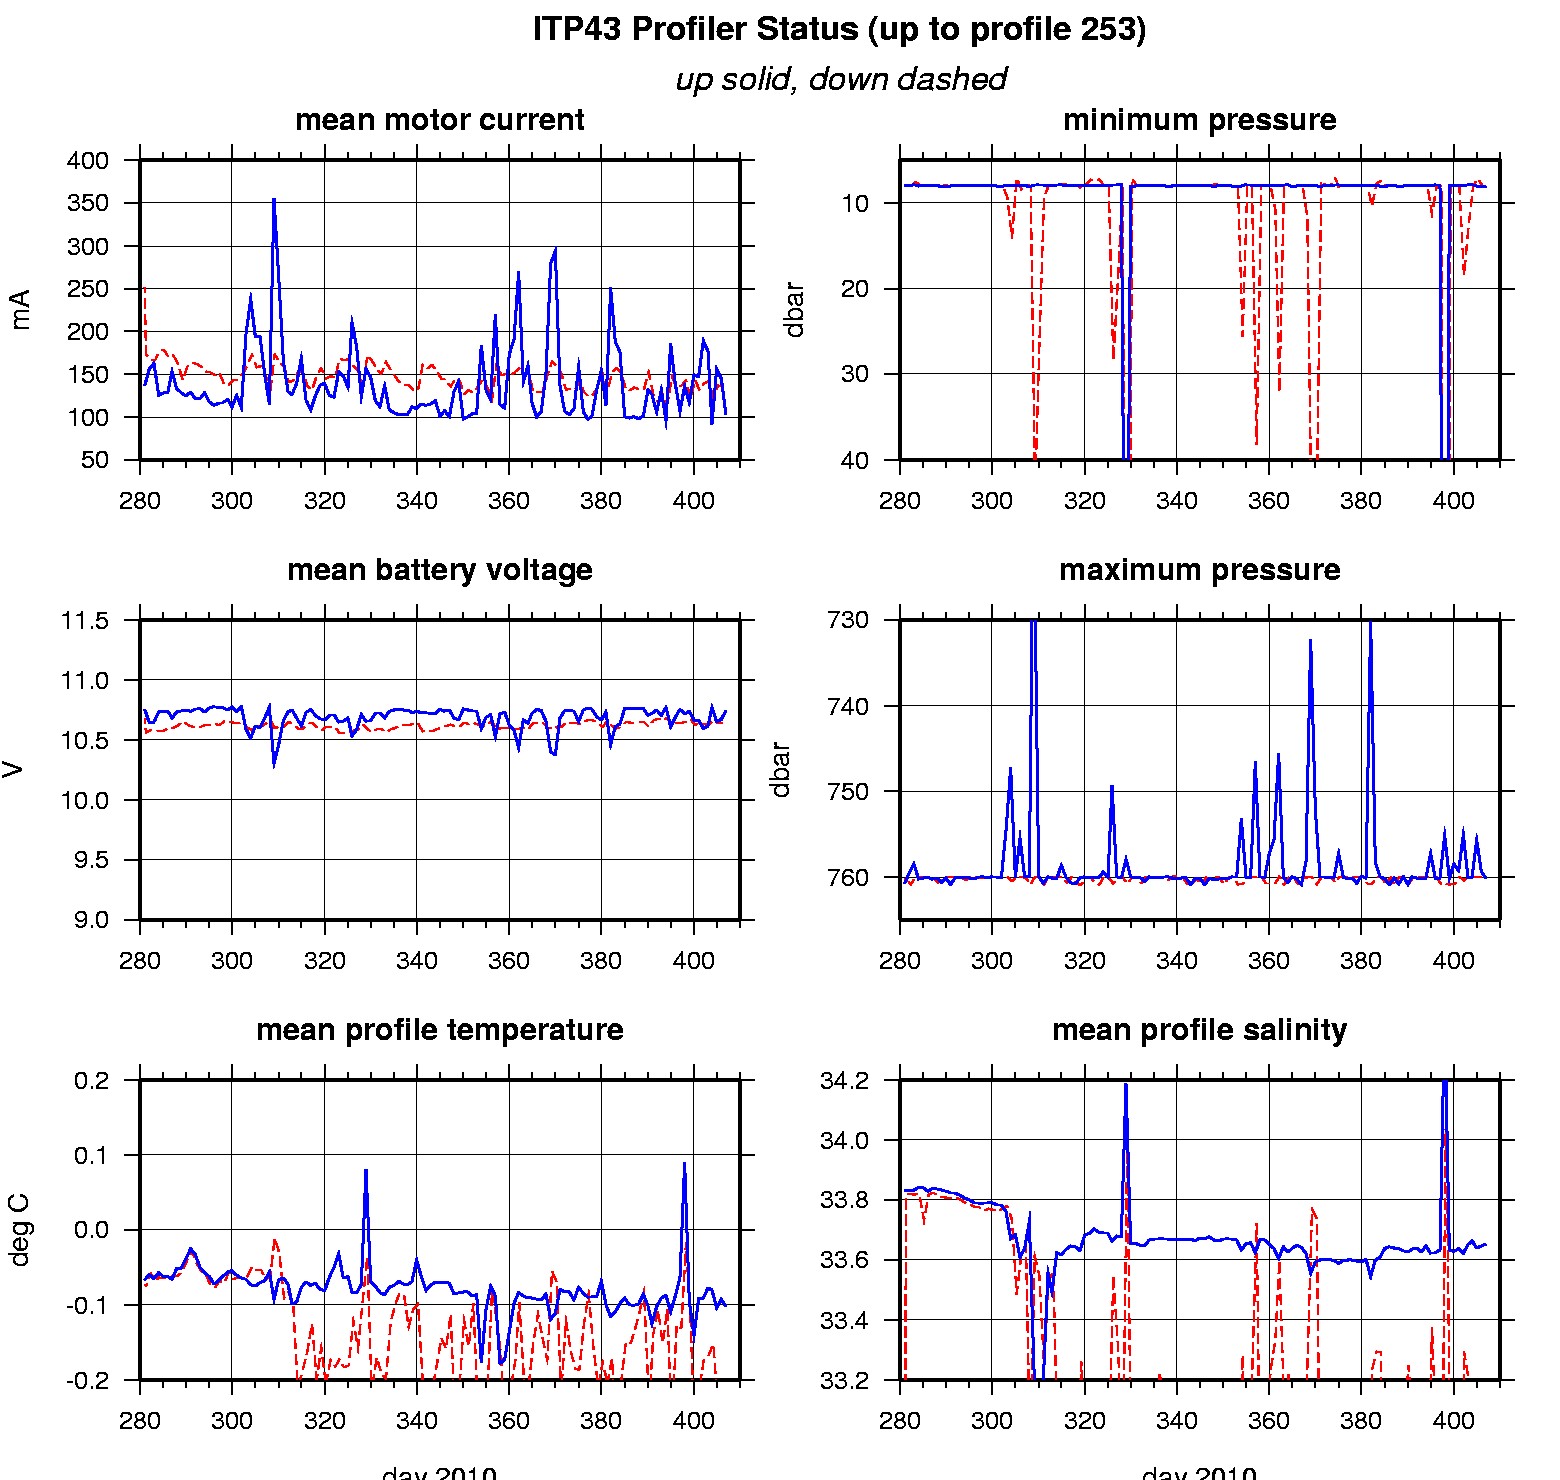
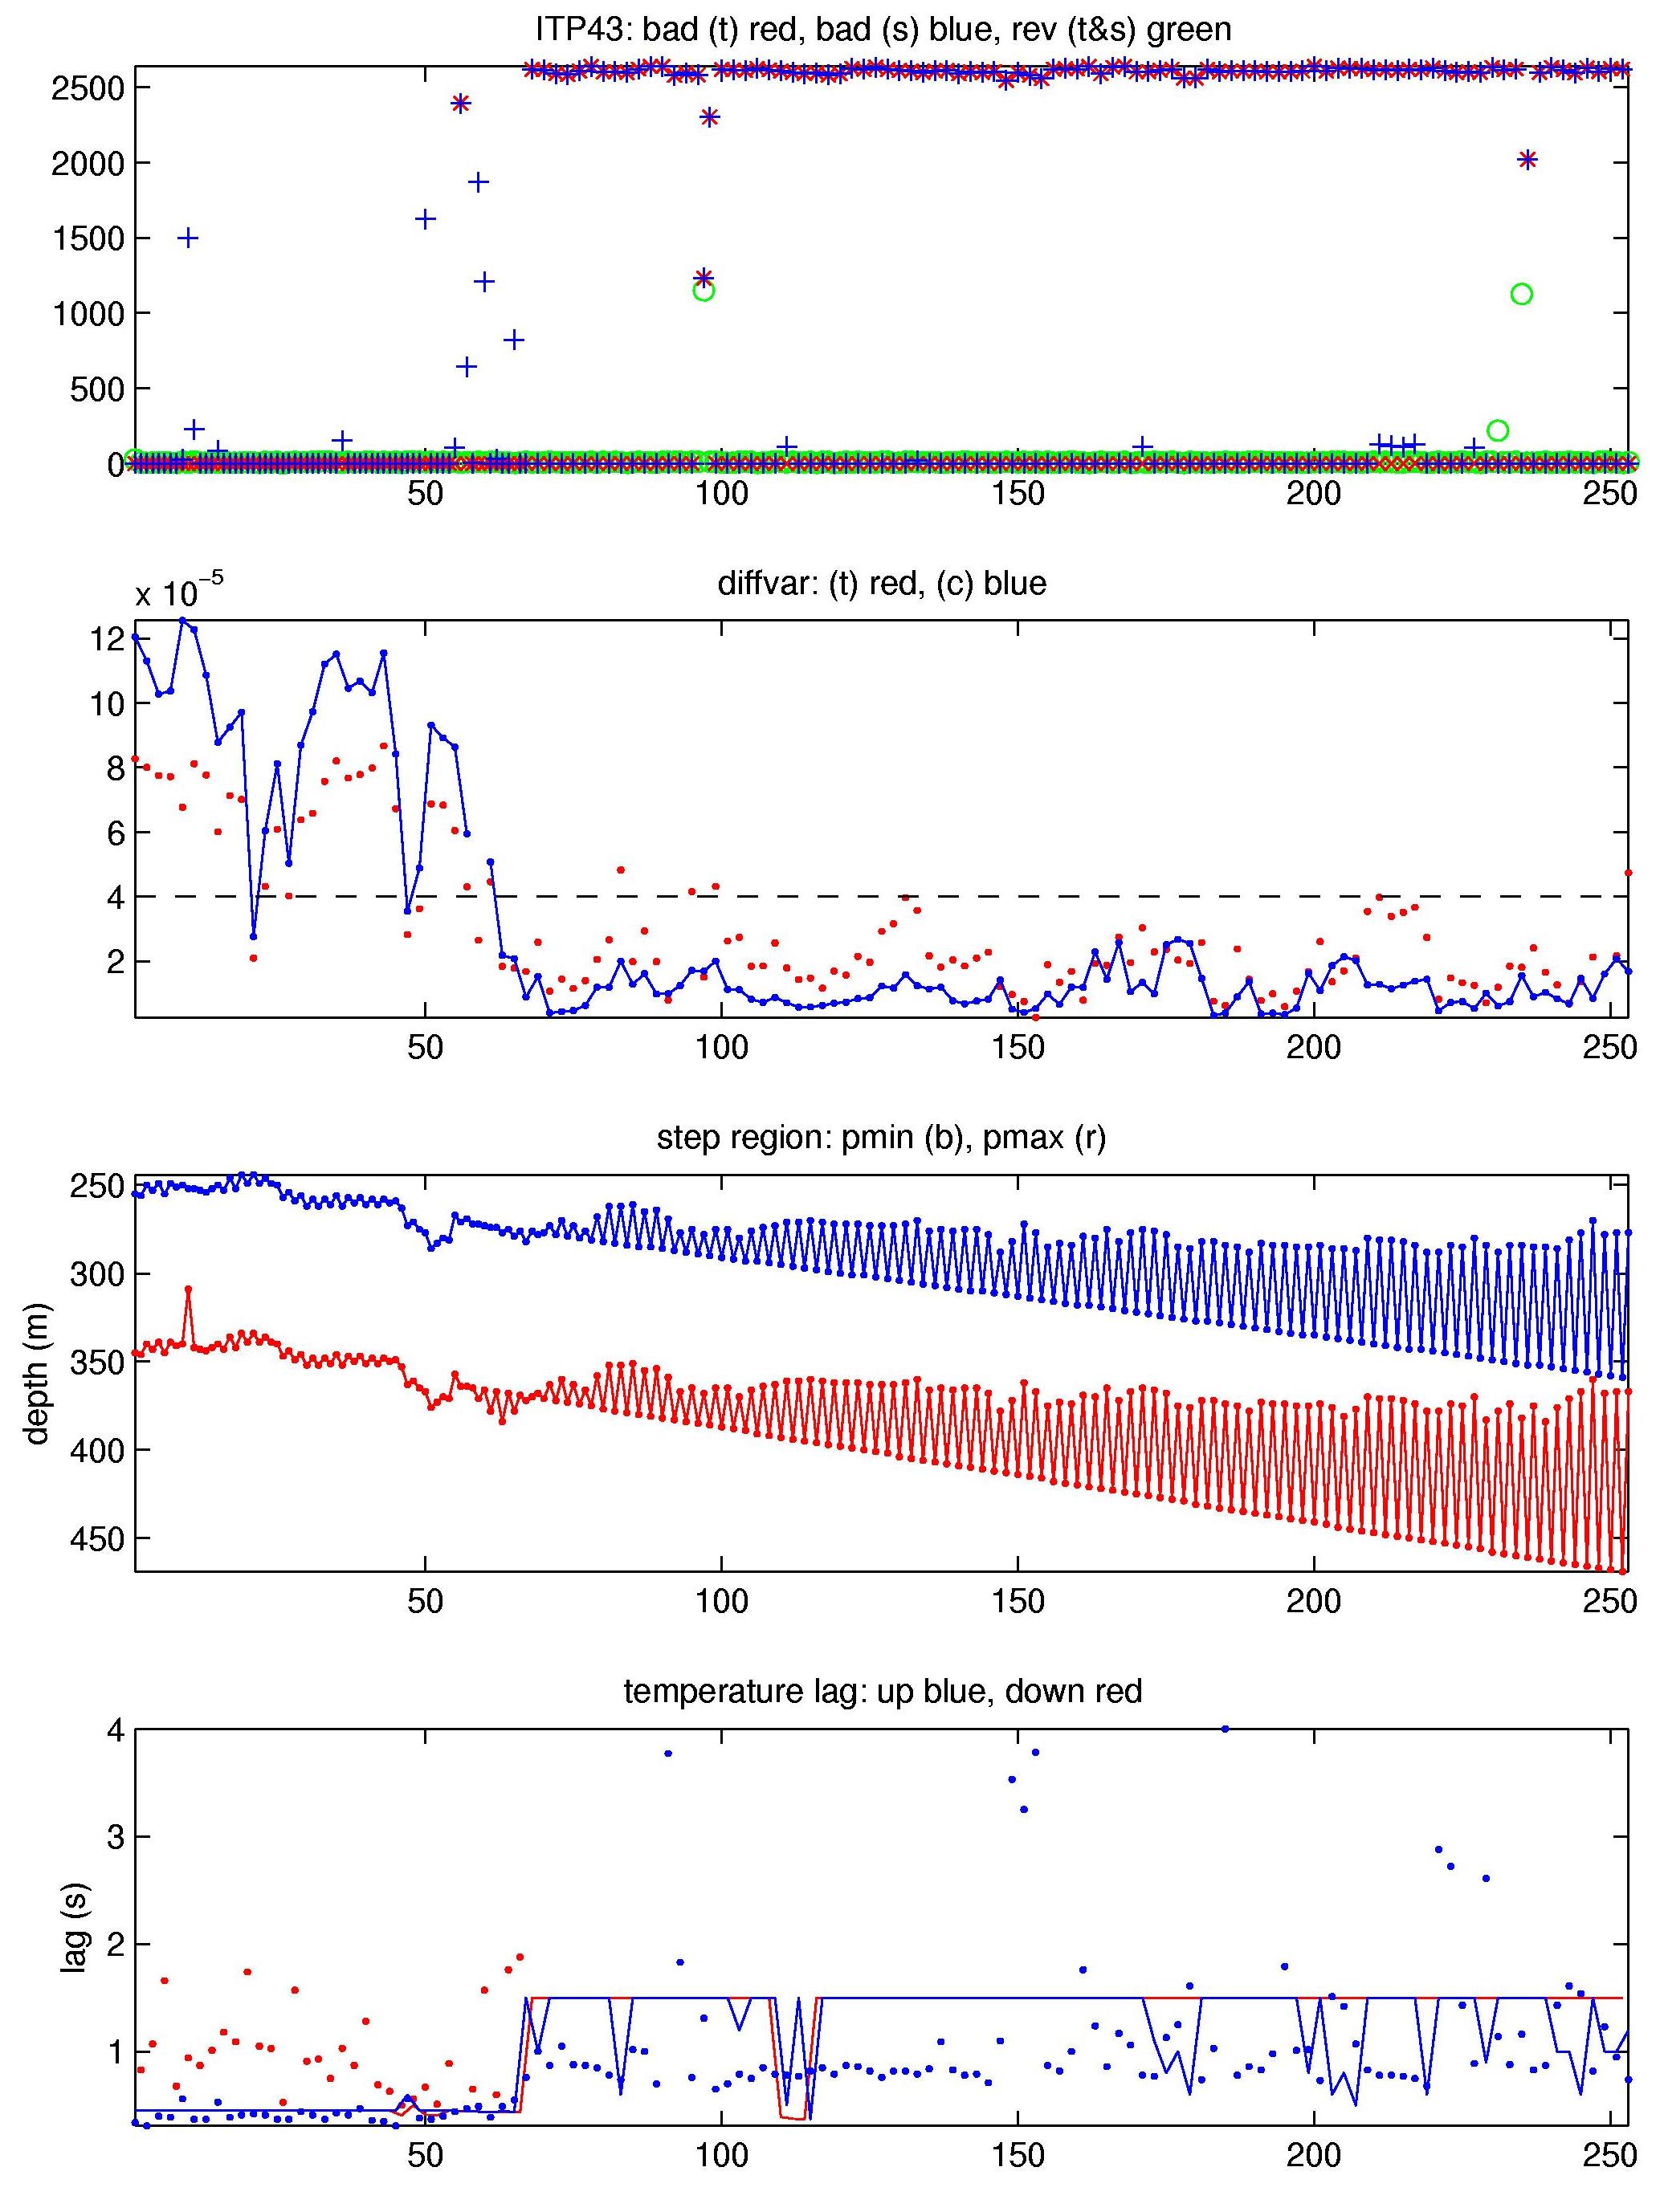
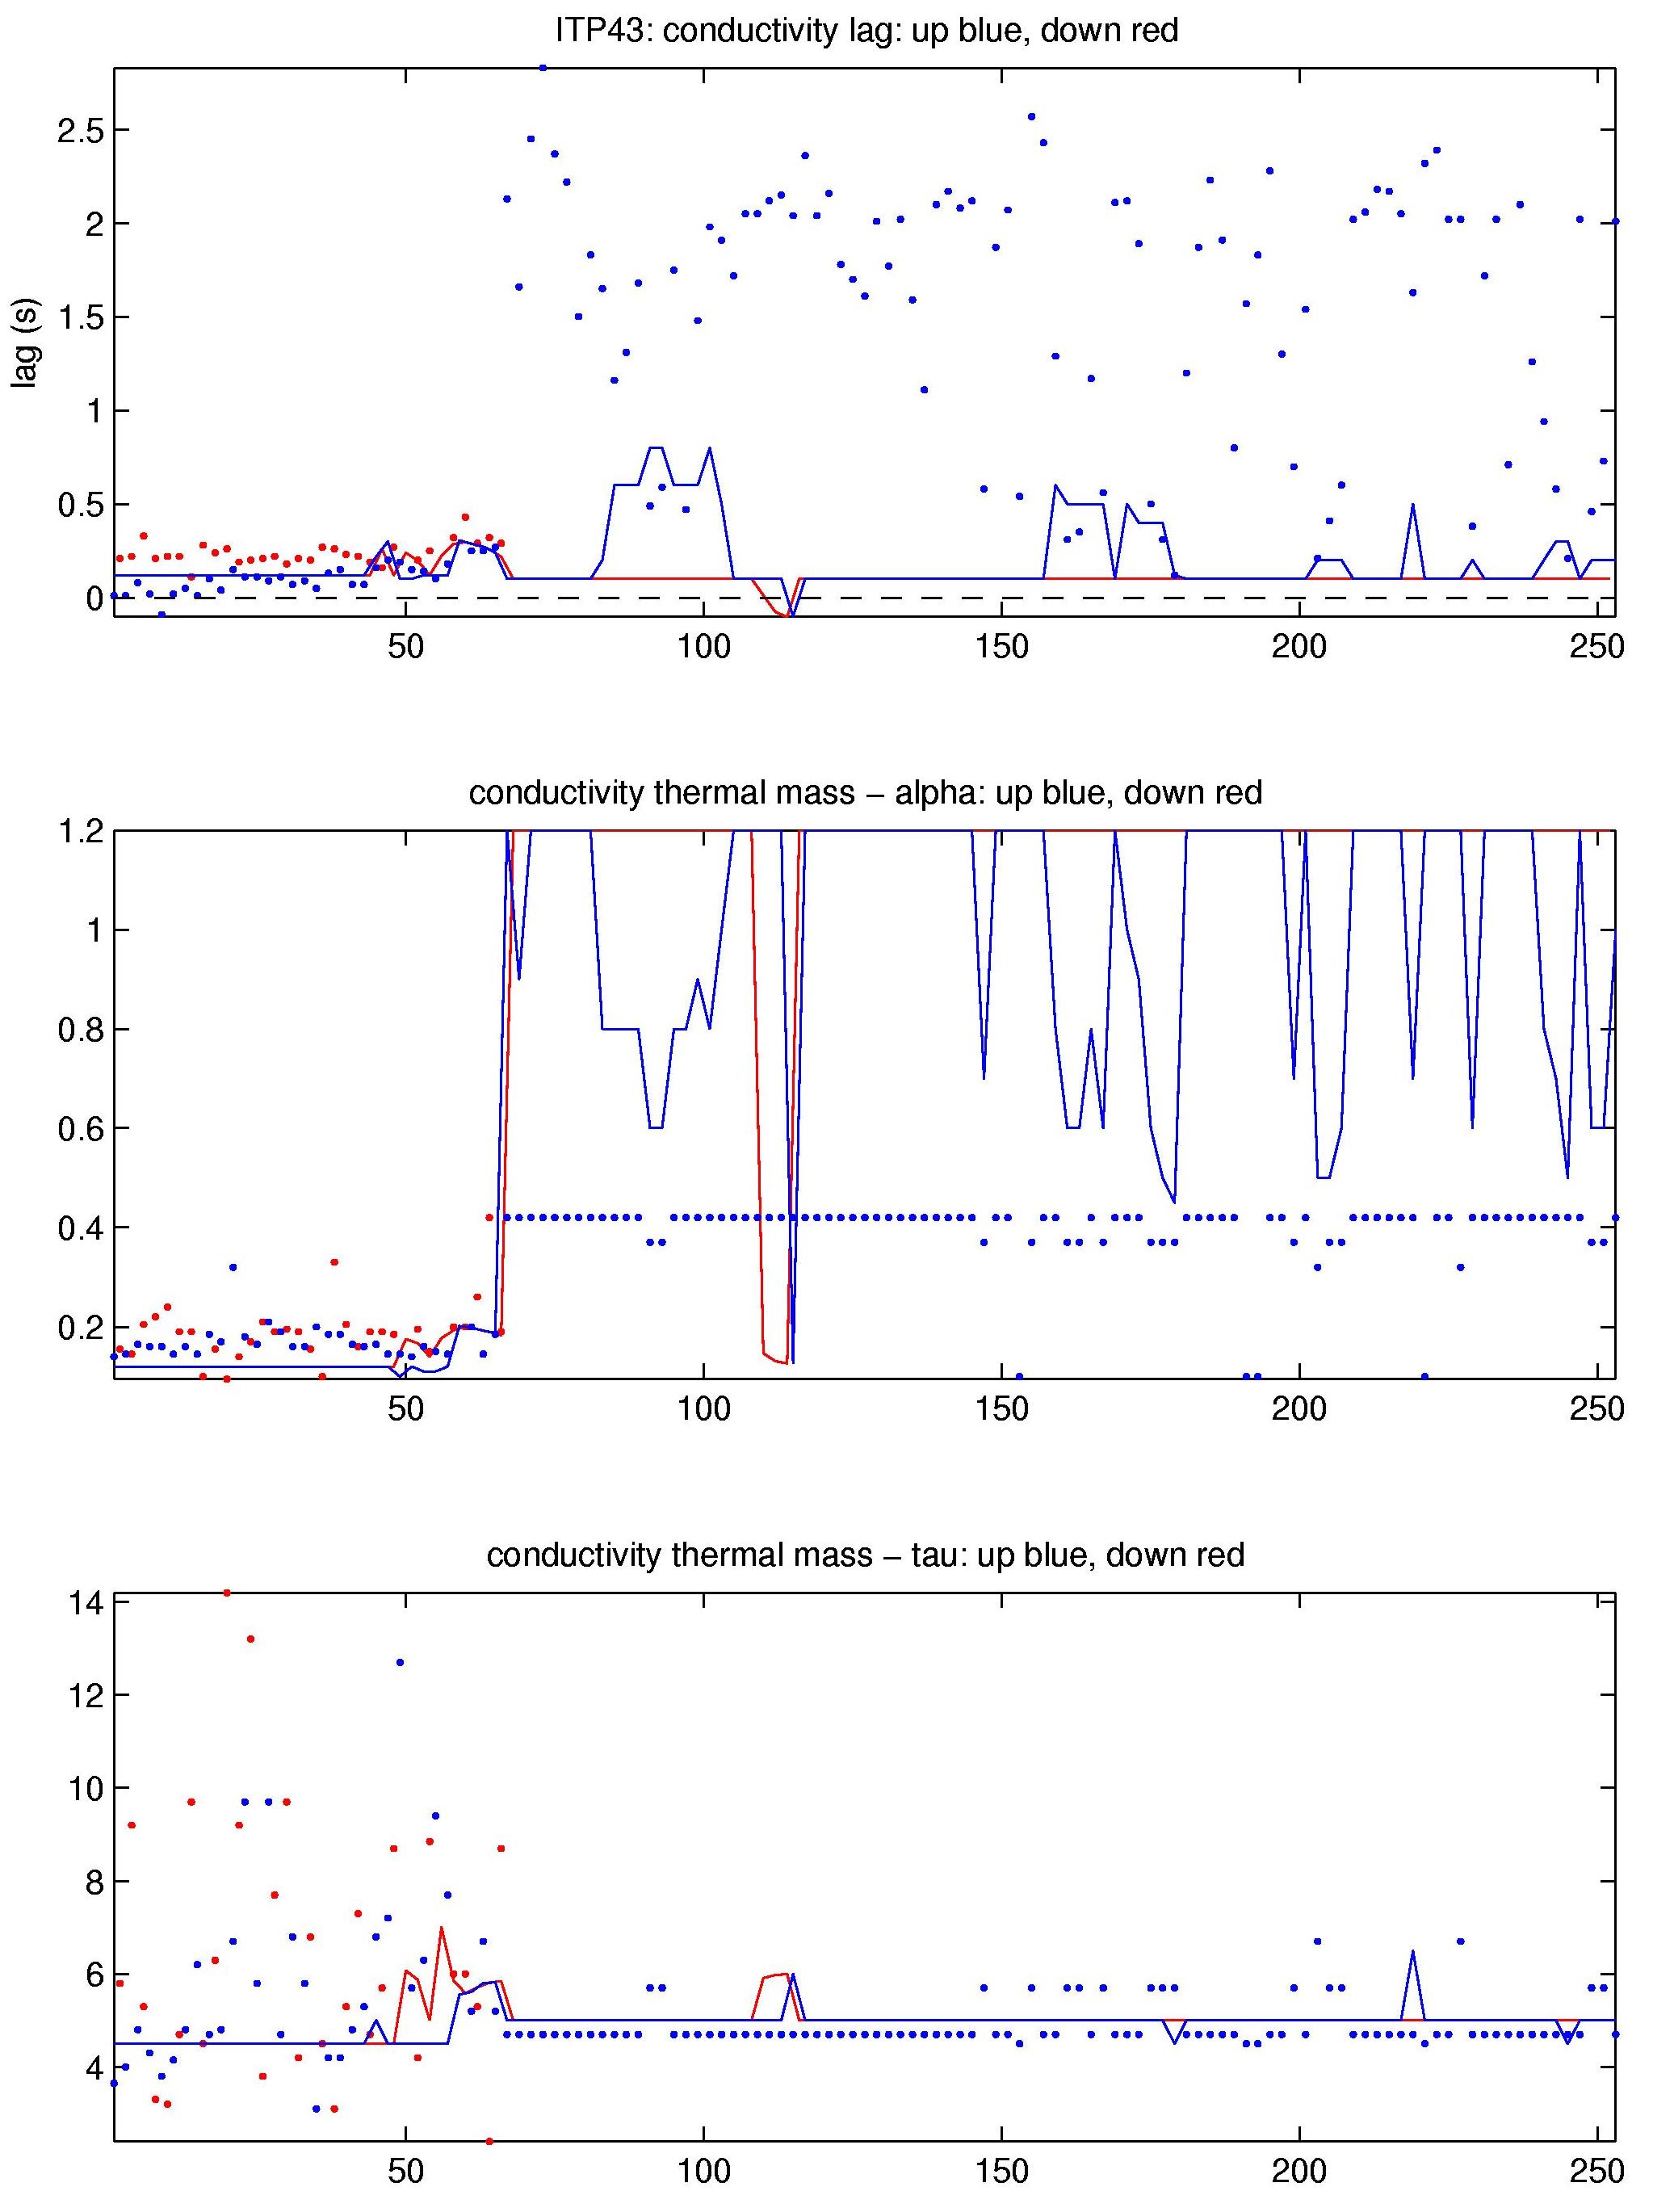
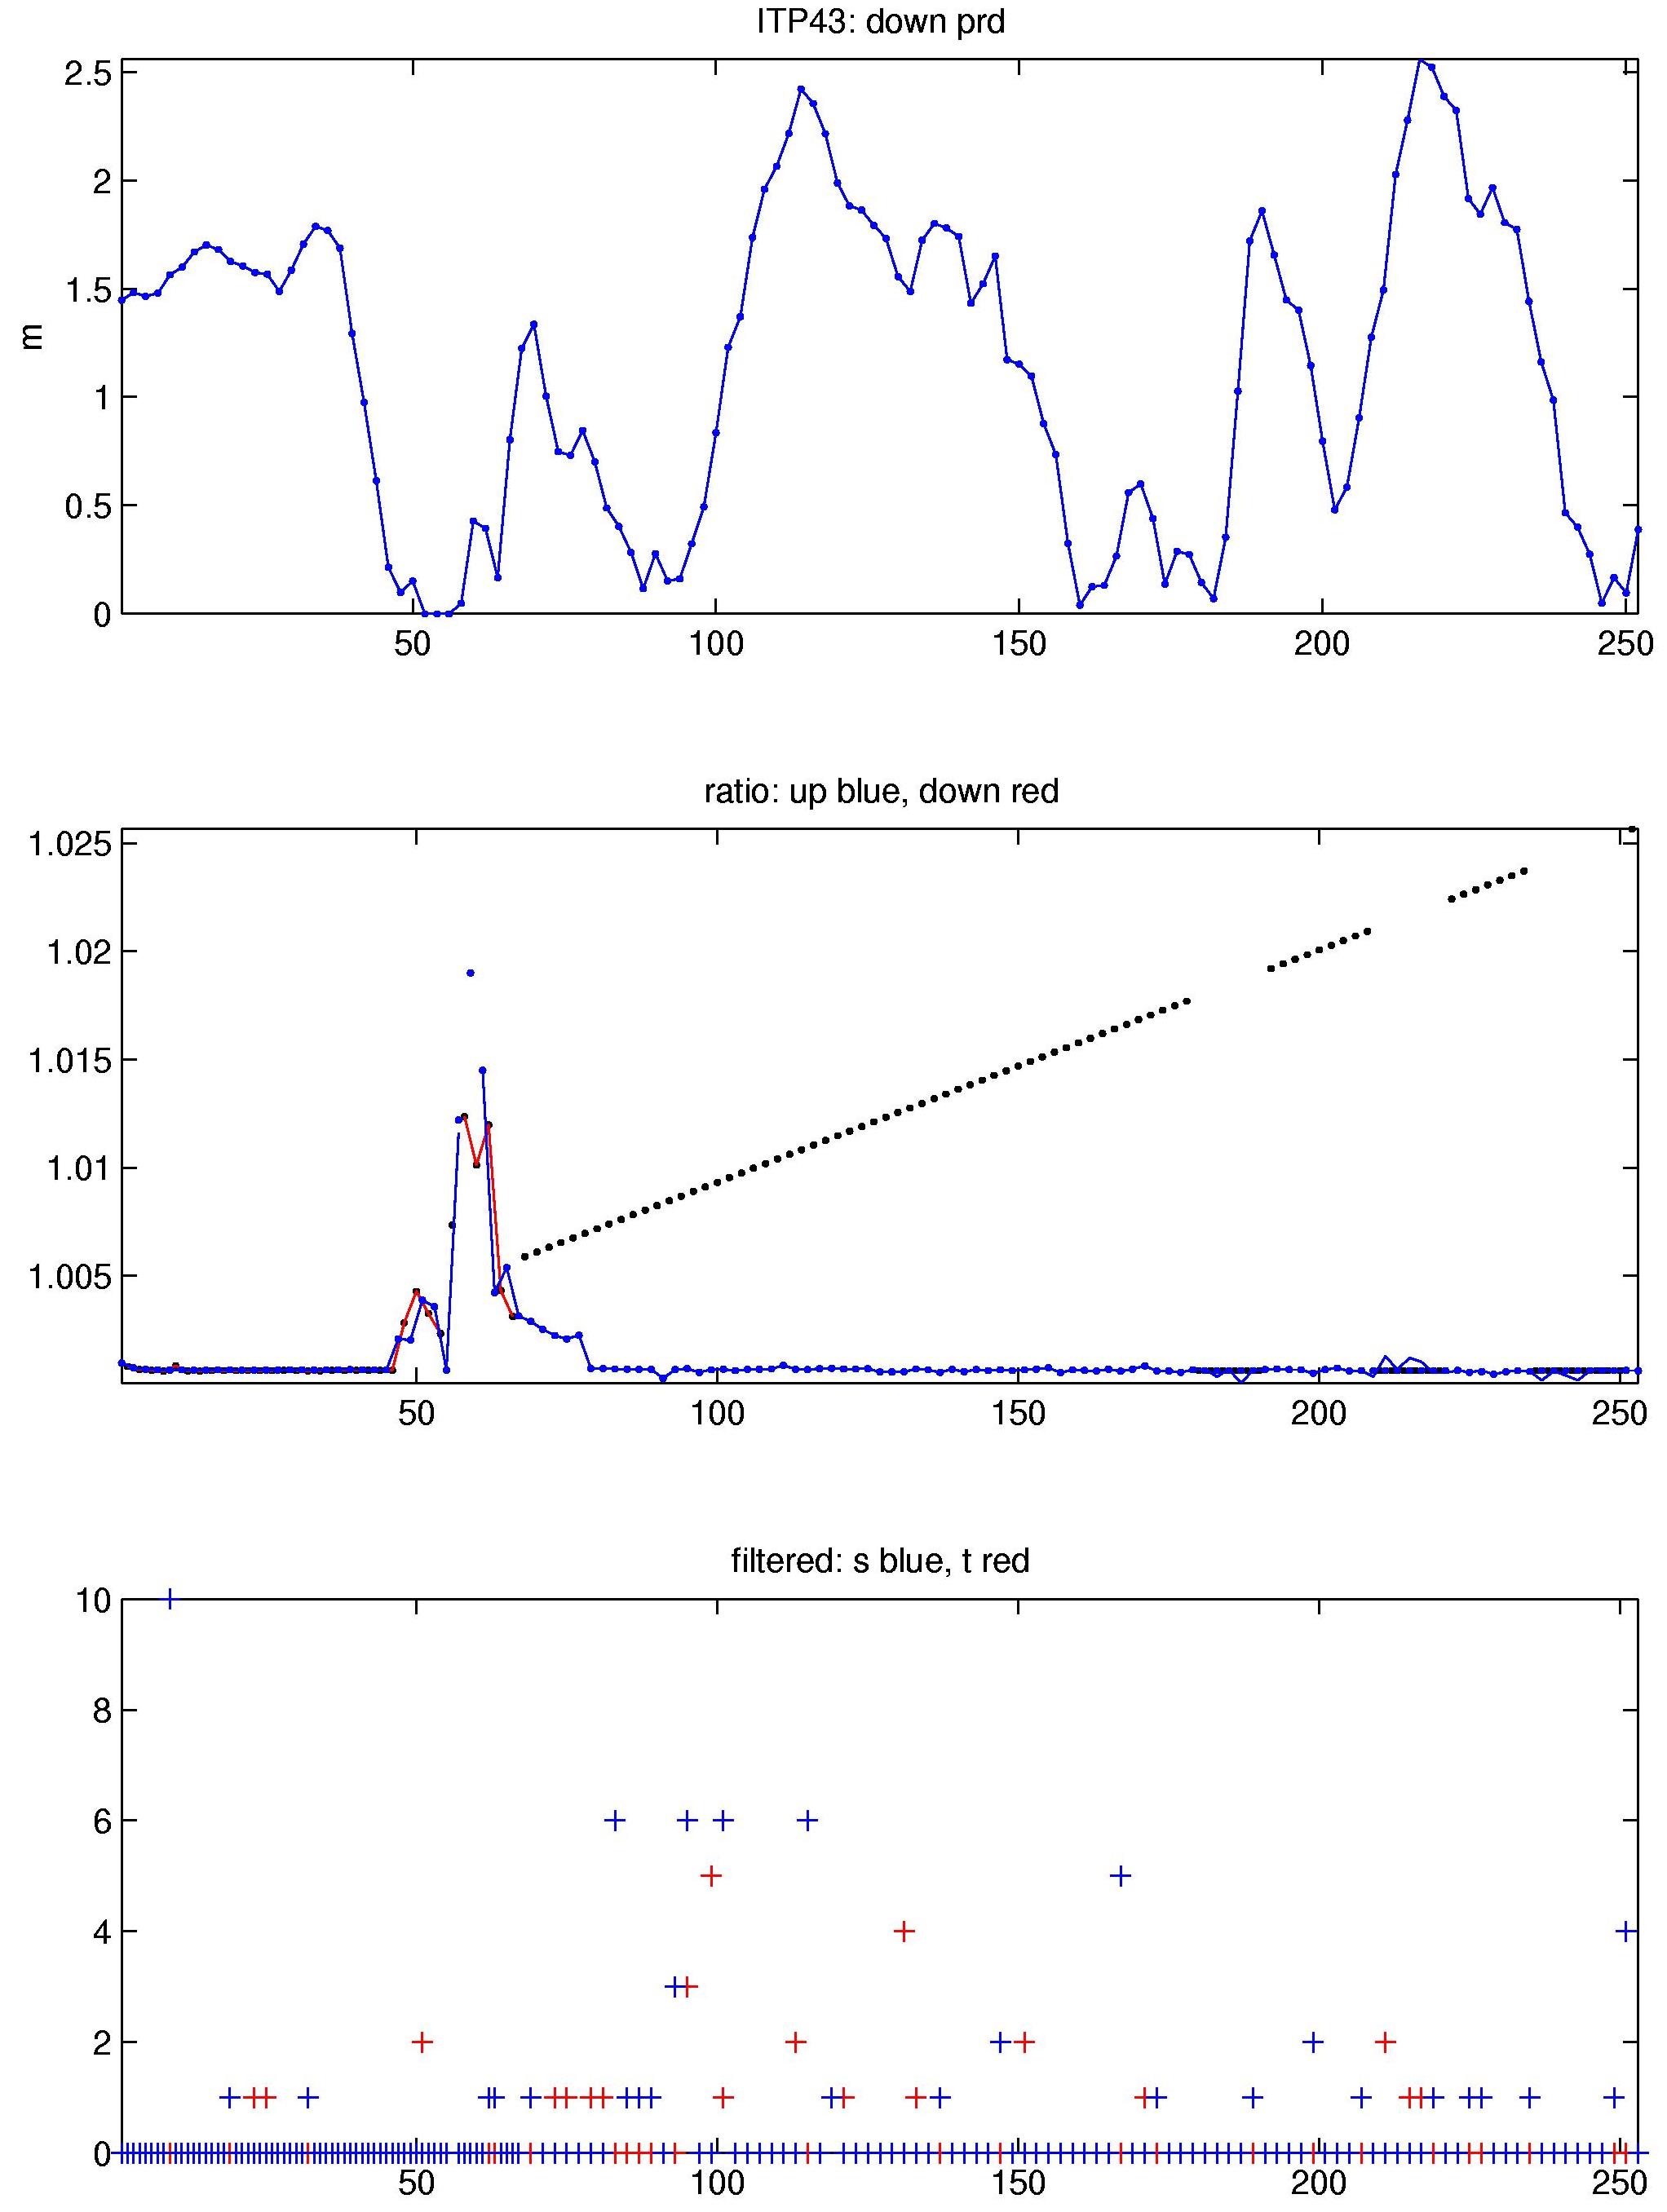
Following its deployment, ITP43 transmitted 253 profiles until February 11, 2011. These were processed according to the procedures described in the ITP Updated Data Processing Procedures. The processing parameters for this ITP are shown in the figures to the right. While the profiler was able to reliably profiler vertically throughout the short time series, sensor problems developed after about a month, likely due to a CTD pump failure. Down profiles were severely corrupted and were edited out. With the CTD mounted on the top endcap of the ITP, up profiles were less severely affected, corrected, as much as possible, and were retained here, albeit marked as "questionable" (qflag = 1).
Thermohaline staircases were present during the initial 60 profiles of the time series, enabling CTD lag corrections there. Stair cases were mostly smoothed out following the pump failure. Larger lag values helped reduce spiking here. Conductivity calibration adjustments (variable "rat") were mostly flat and close to unity, aside from a large adjustment some profiles prior to the pump failure. Some calibration adjustment spikes late in the record appeared triggered by anomalous values in the deepest of three levels of the fit to mapped history CTD conductivities. Their removal (i.e., basing the calibration adjustment on only two of the three levels) reduced the spread in deep ITP densities and TS patterns.
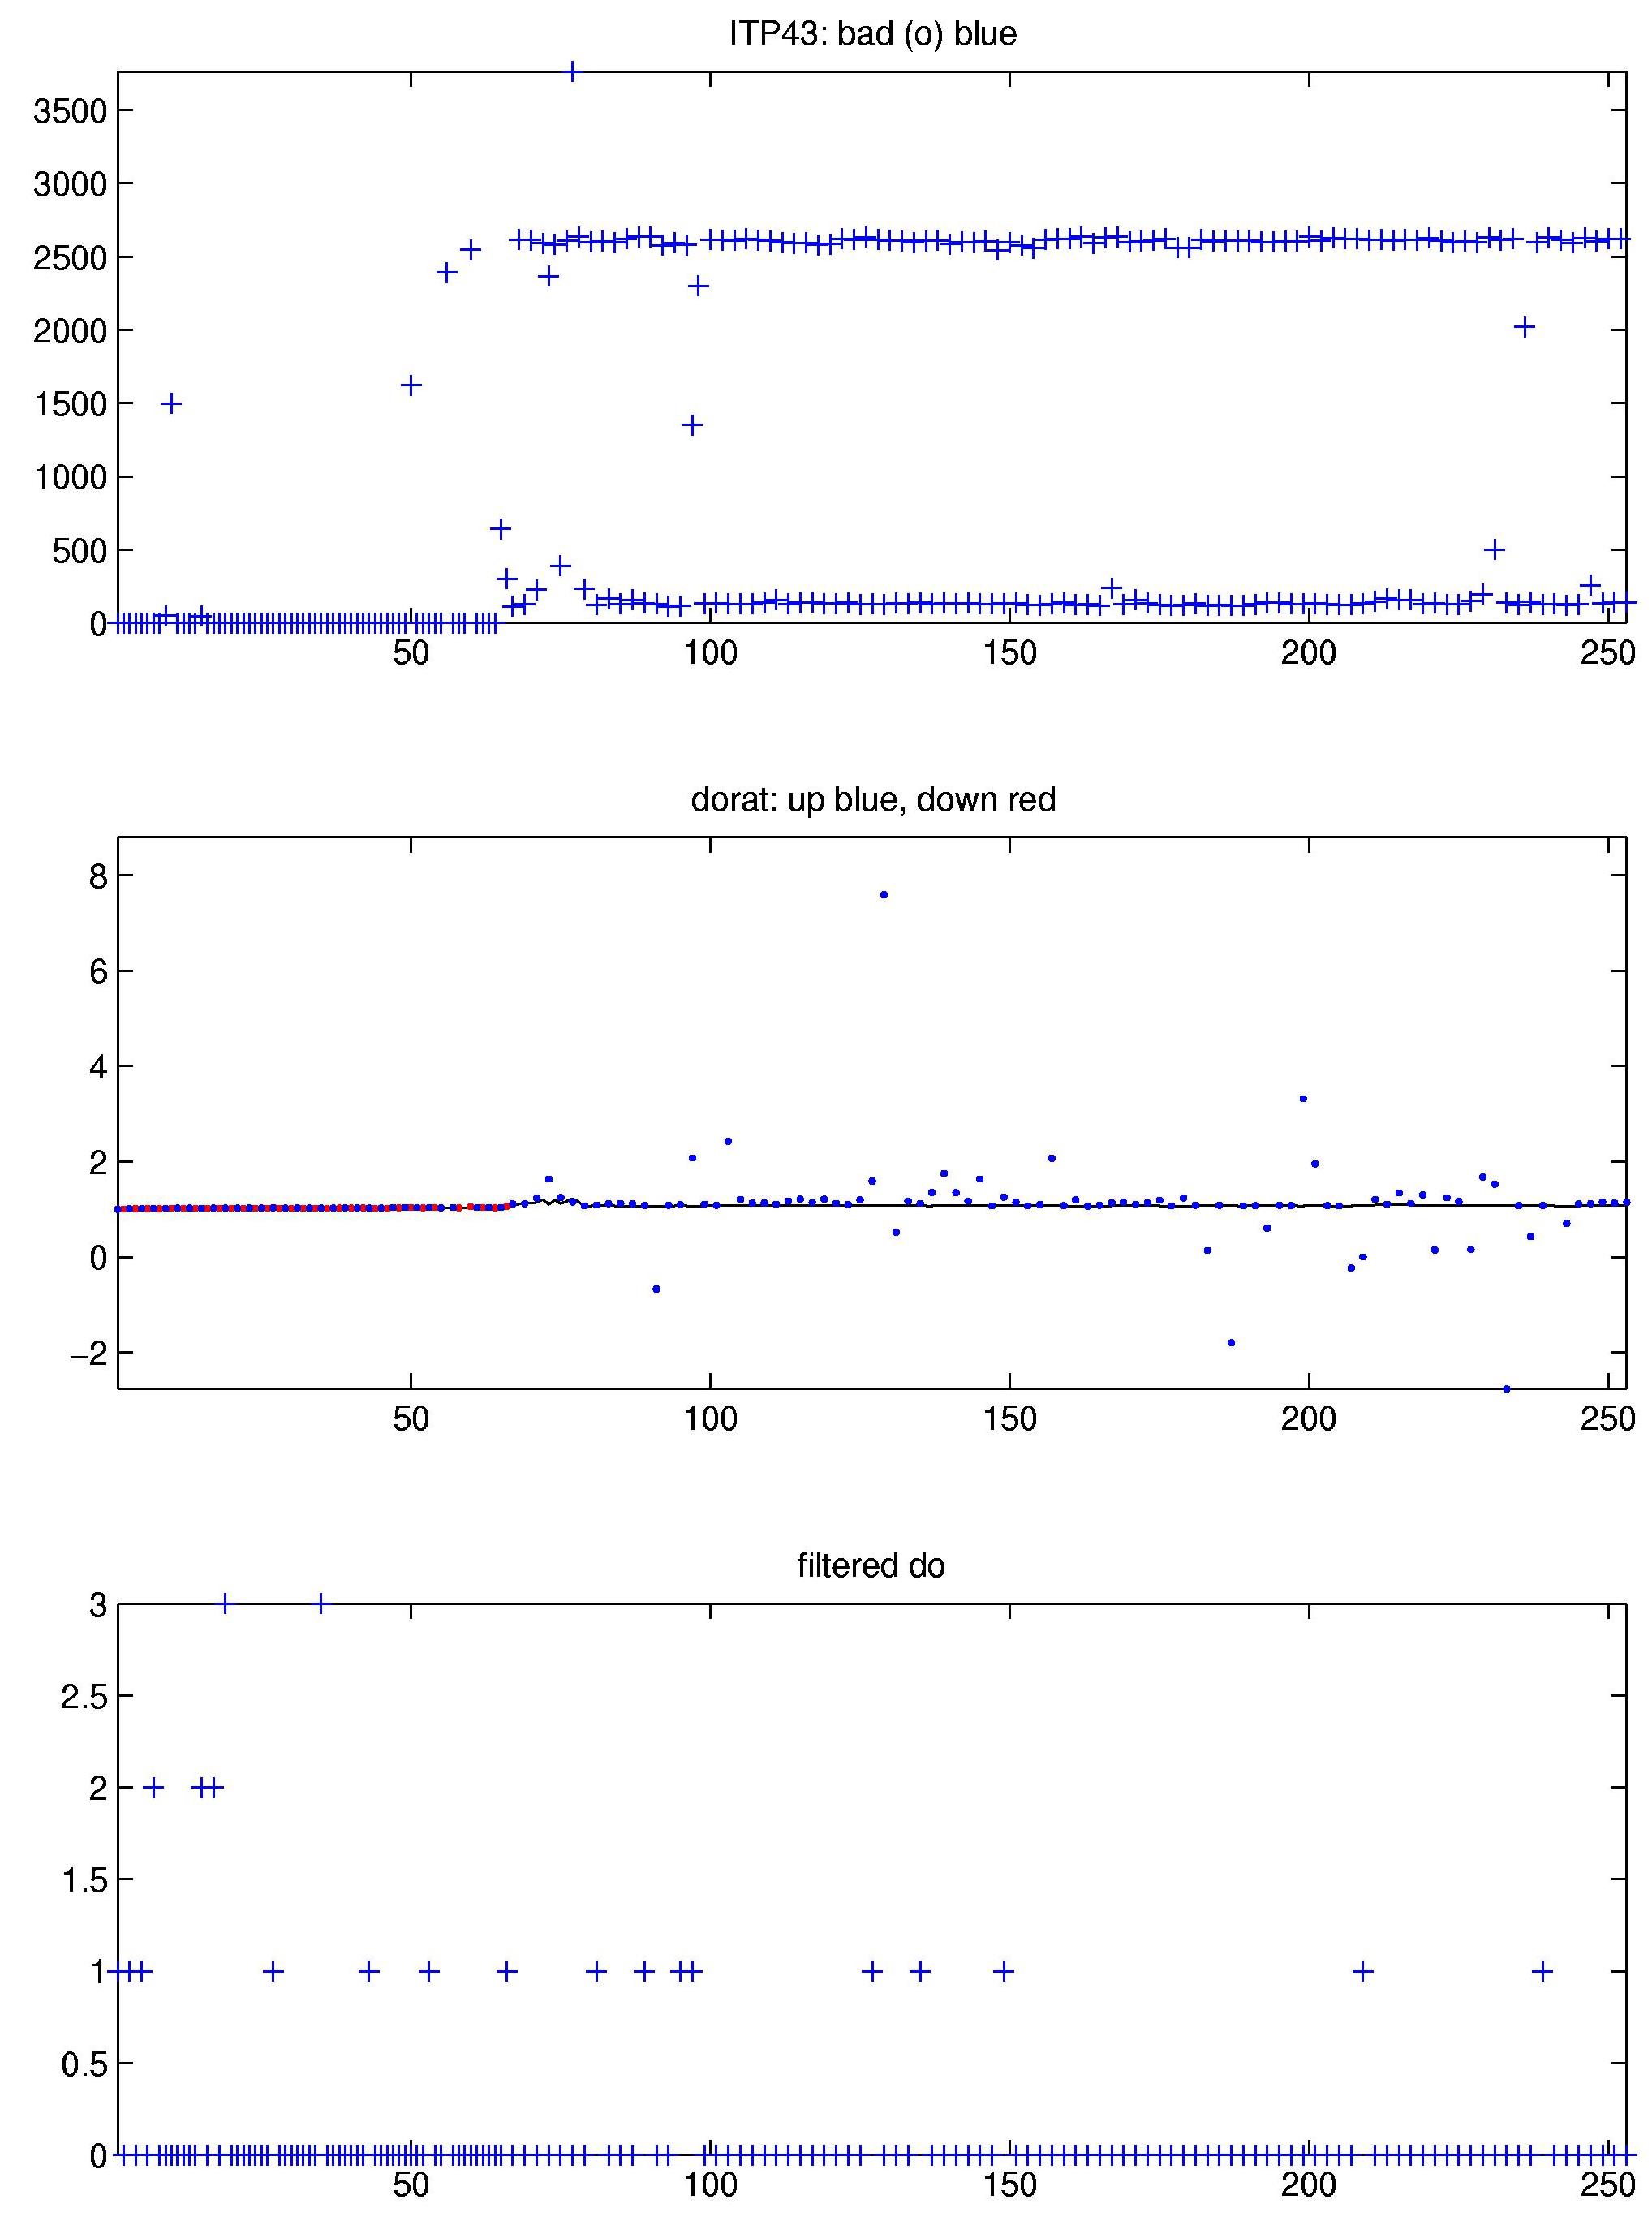
Oxygen processing was mostly straightforward. Again, anomalous patterns in the O2 calibration adjustment towards the end of the record were removed when basing the calibration on the top two of three levels of mapped CTD oxygen.
See the Data Products tab to the left for descriptions of the three levels (I, II, III) of data processing and to access all data.
