ITP 81 Data Description
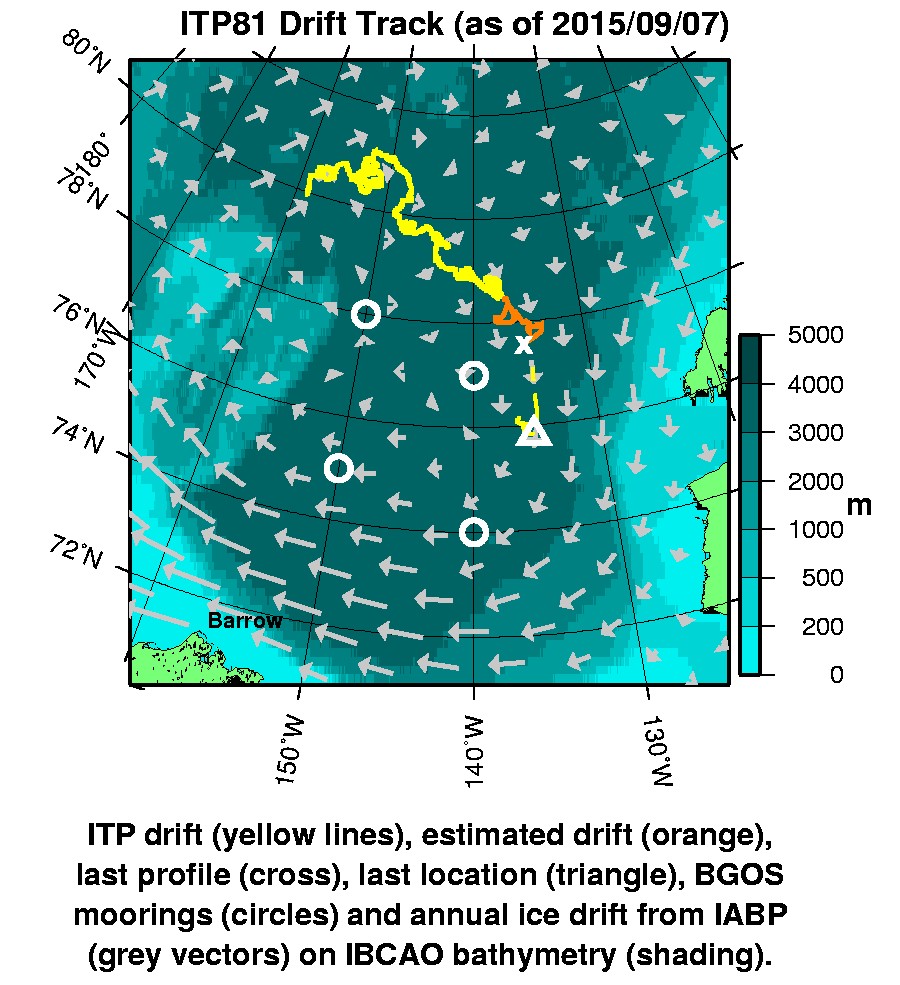
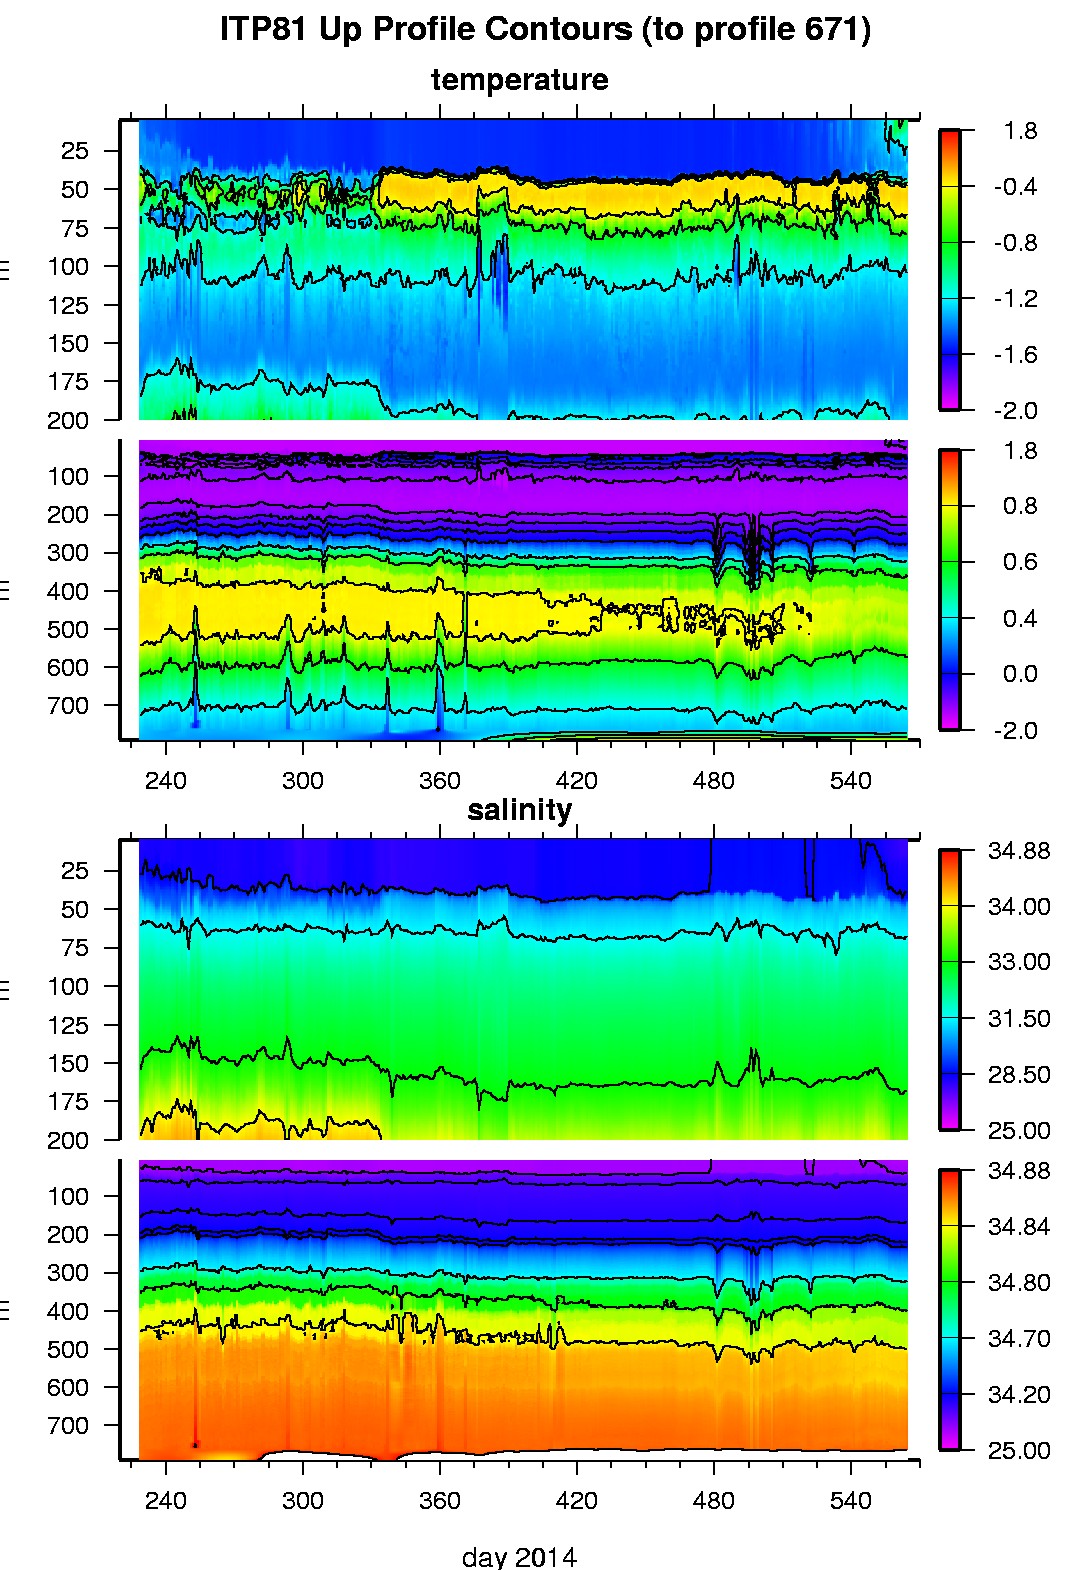
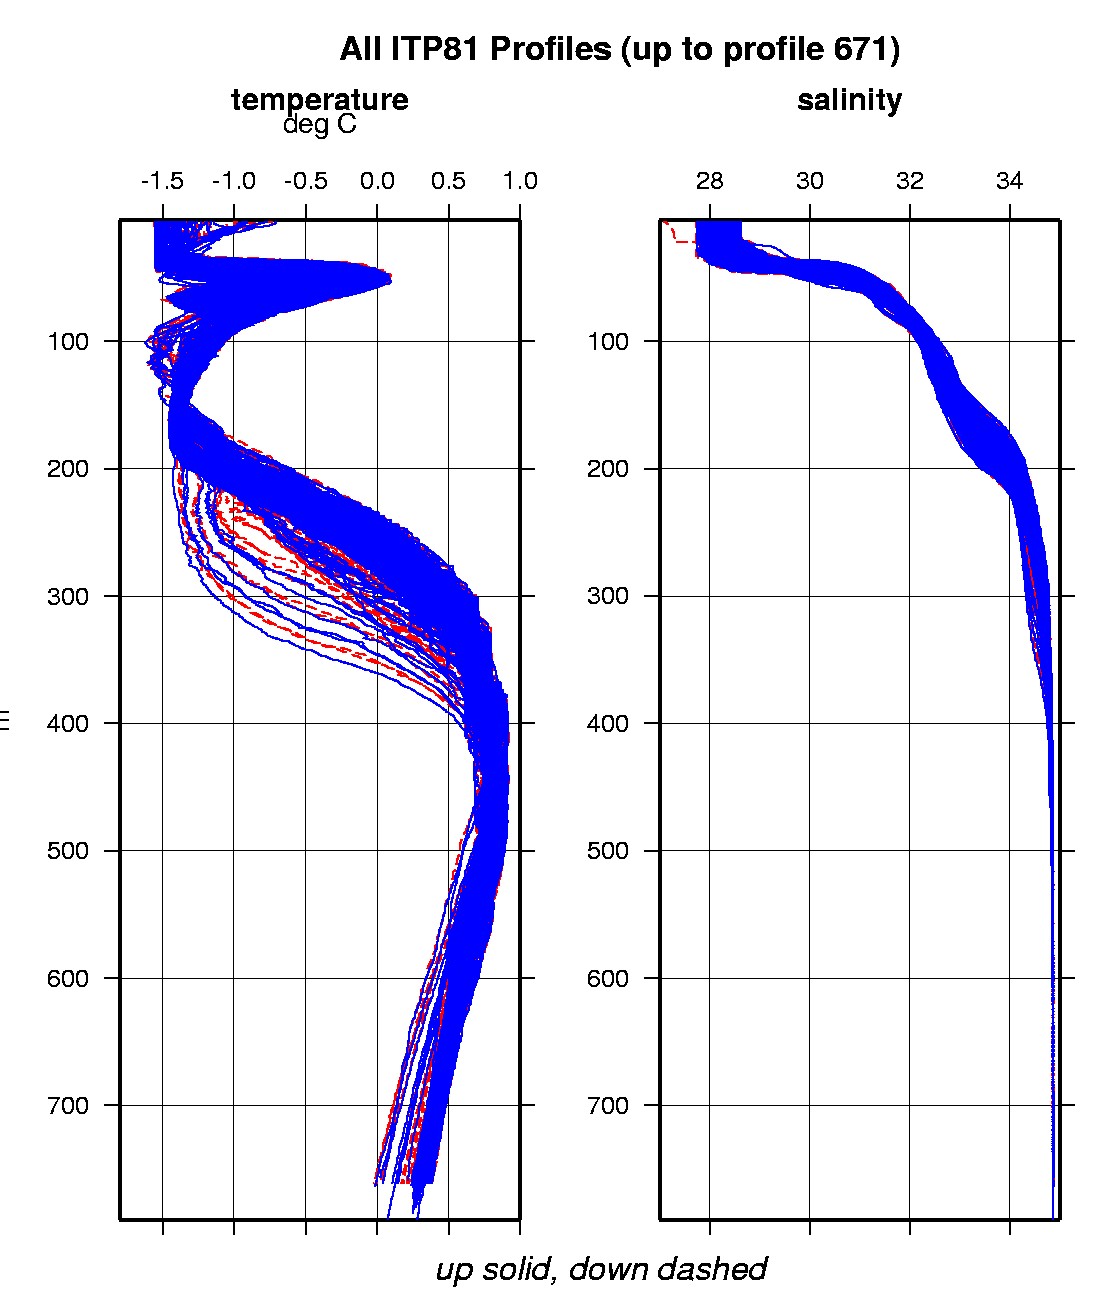
The ITP profiler was configured to operate on a standard sampling schedule of 2 one-way profiles between 7 and 760 m depth each day. In the surface package, the GPS receiver was powered hourly to obtain locations hourly, and buoy temperature and battery voltage status were recorded.
The plots to the right are of the final, calibrated, edited data (as opposed to the raw data presented on the active instrument pages).
See the Data Products tab to the left for descriptions of the three levels (I, II, III) of data processing and to access all data.
ITP 81 data can also be found at the links below:
Level II hourly buoy location data in ASCII format: itp81rawlocs.dat
Level III 1-Hz processed profile data in MATLAB format: itp81cormat.tar.Z and itp81cormat.zip
Level III 1-db bin-averaged processed profile data in MATLAB format: itp81final.mat
Level III 1-db bin-averaged processed profile data in ASCII format: itp81final.tar.Z and itp81final.zip


