ITP85 Data Processing
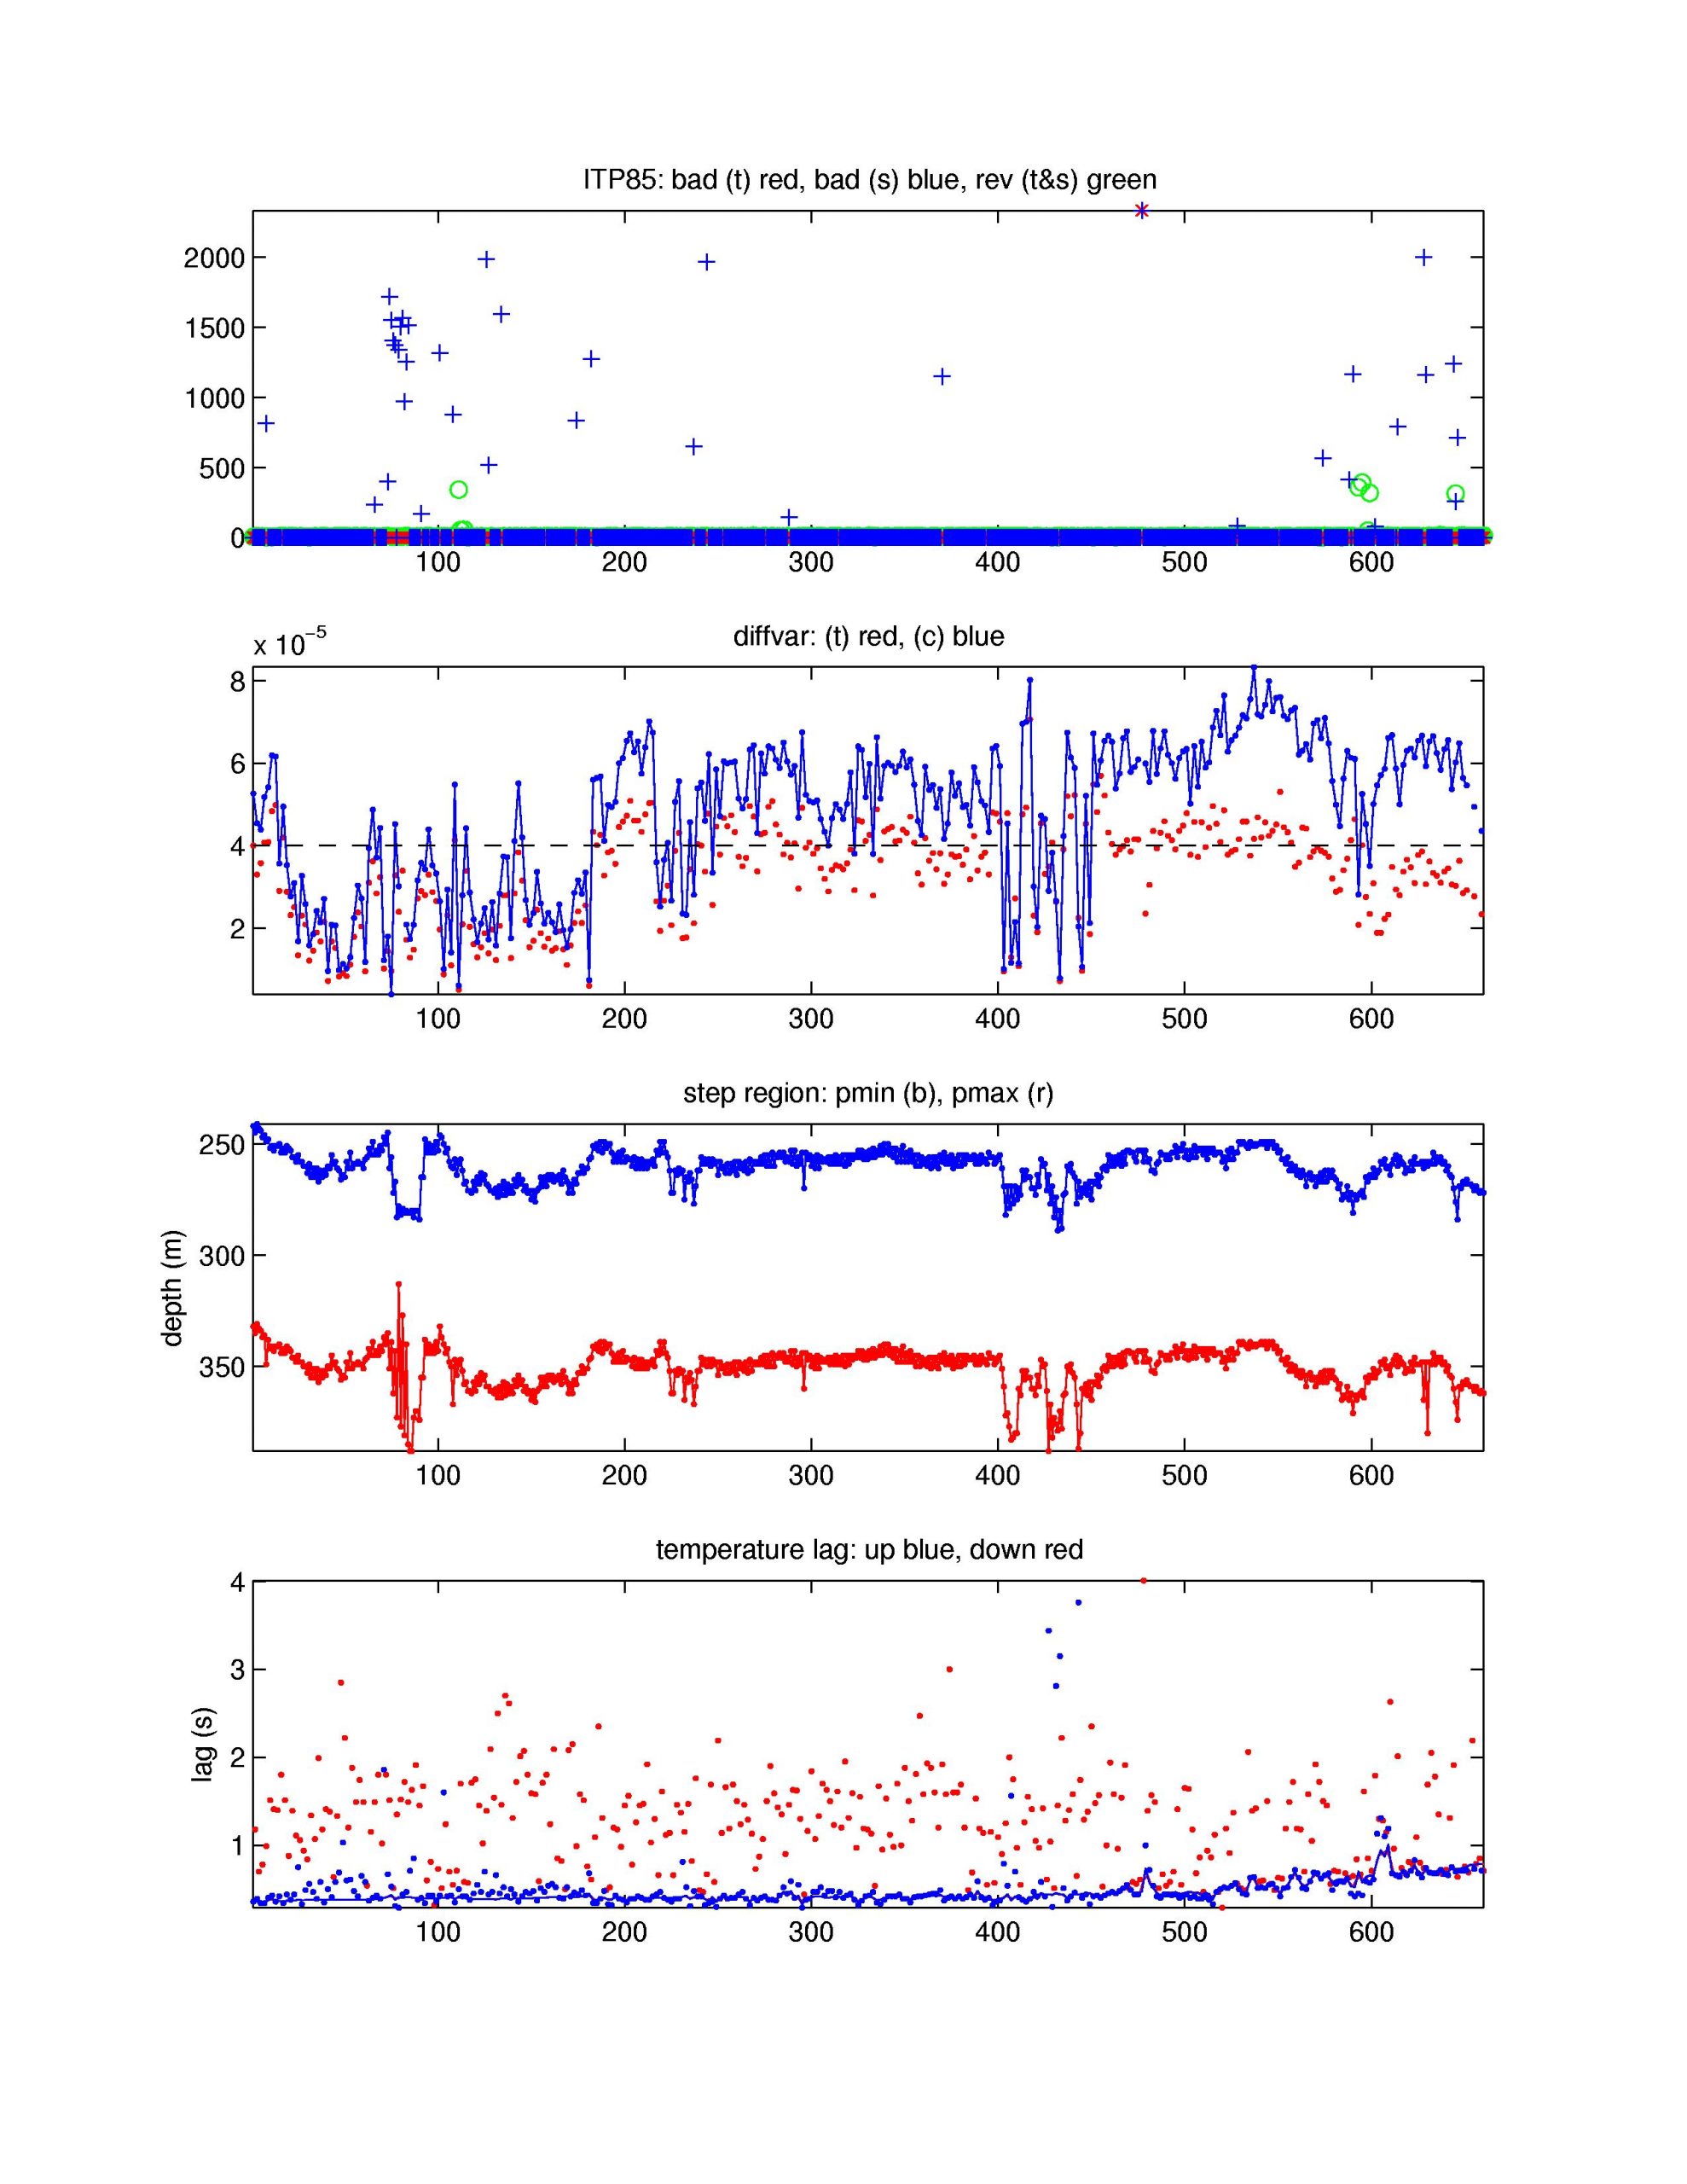
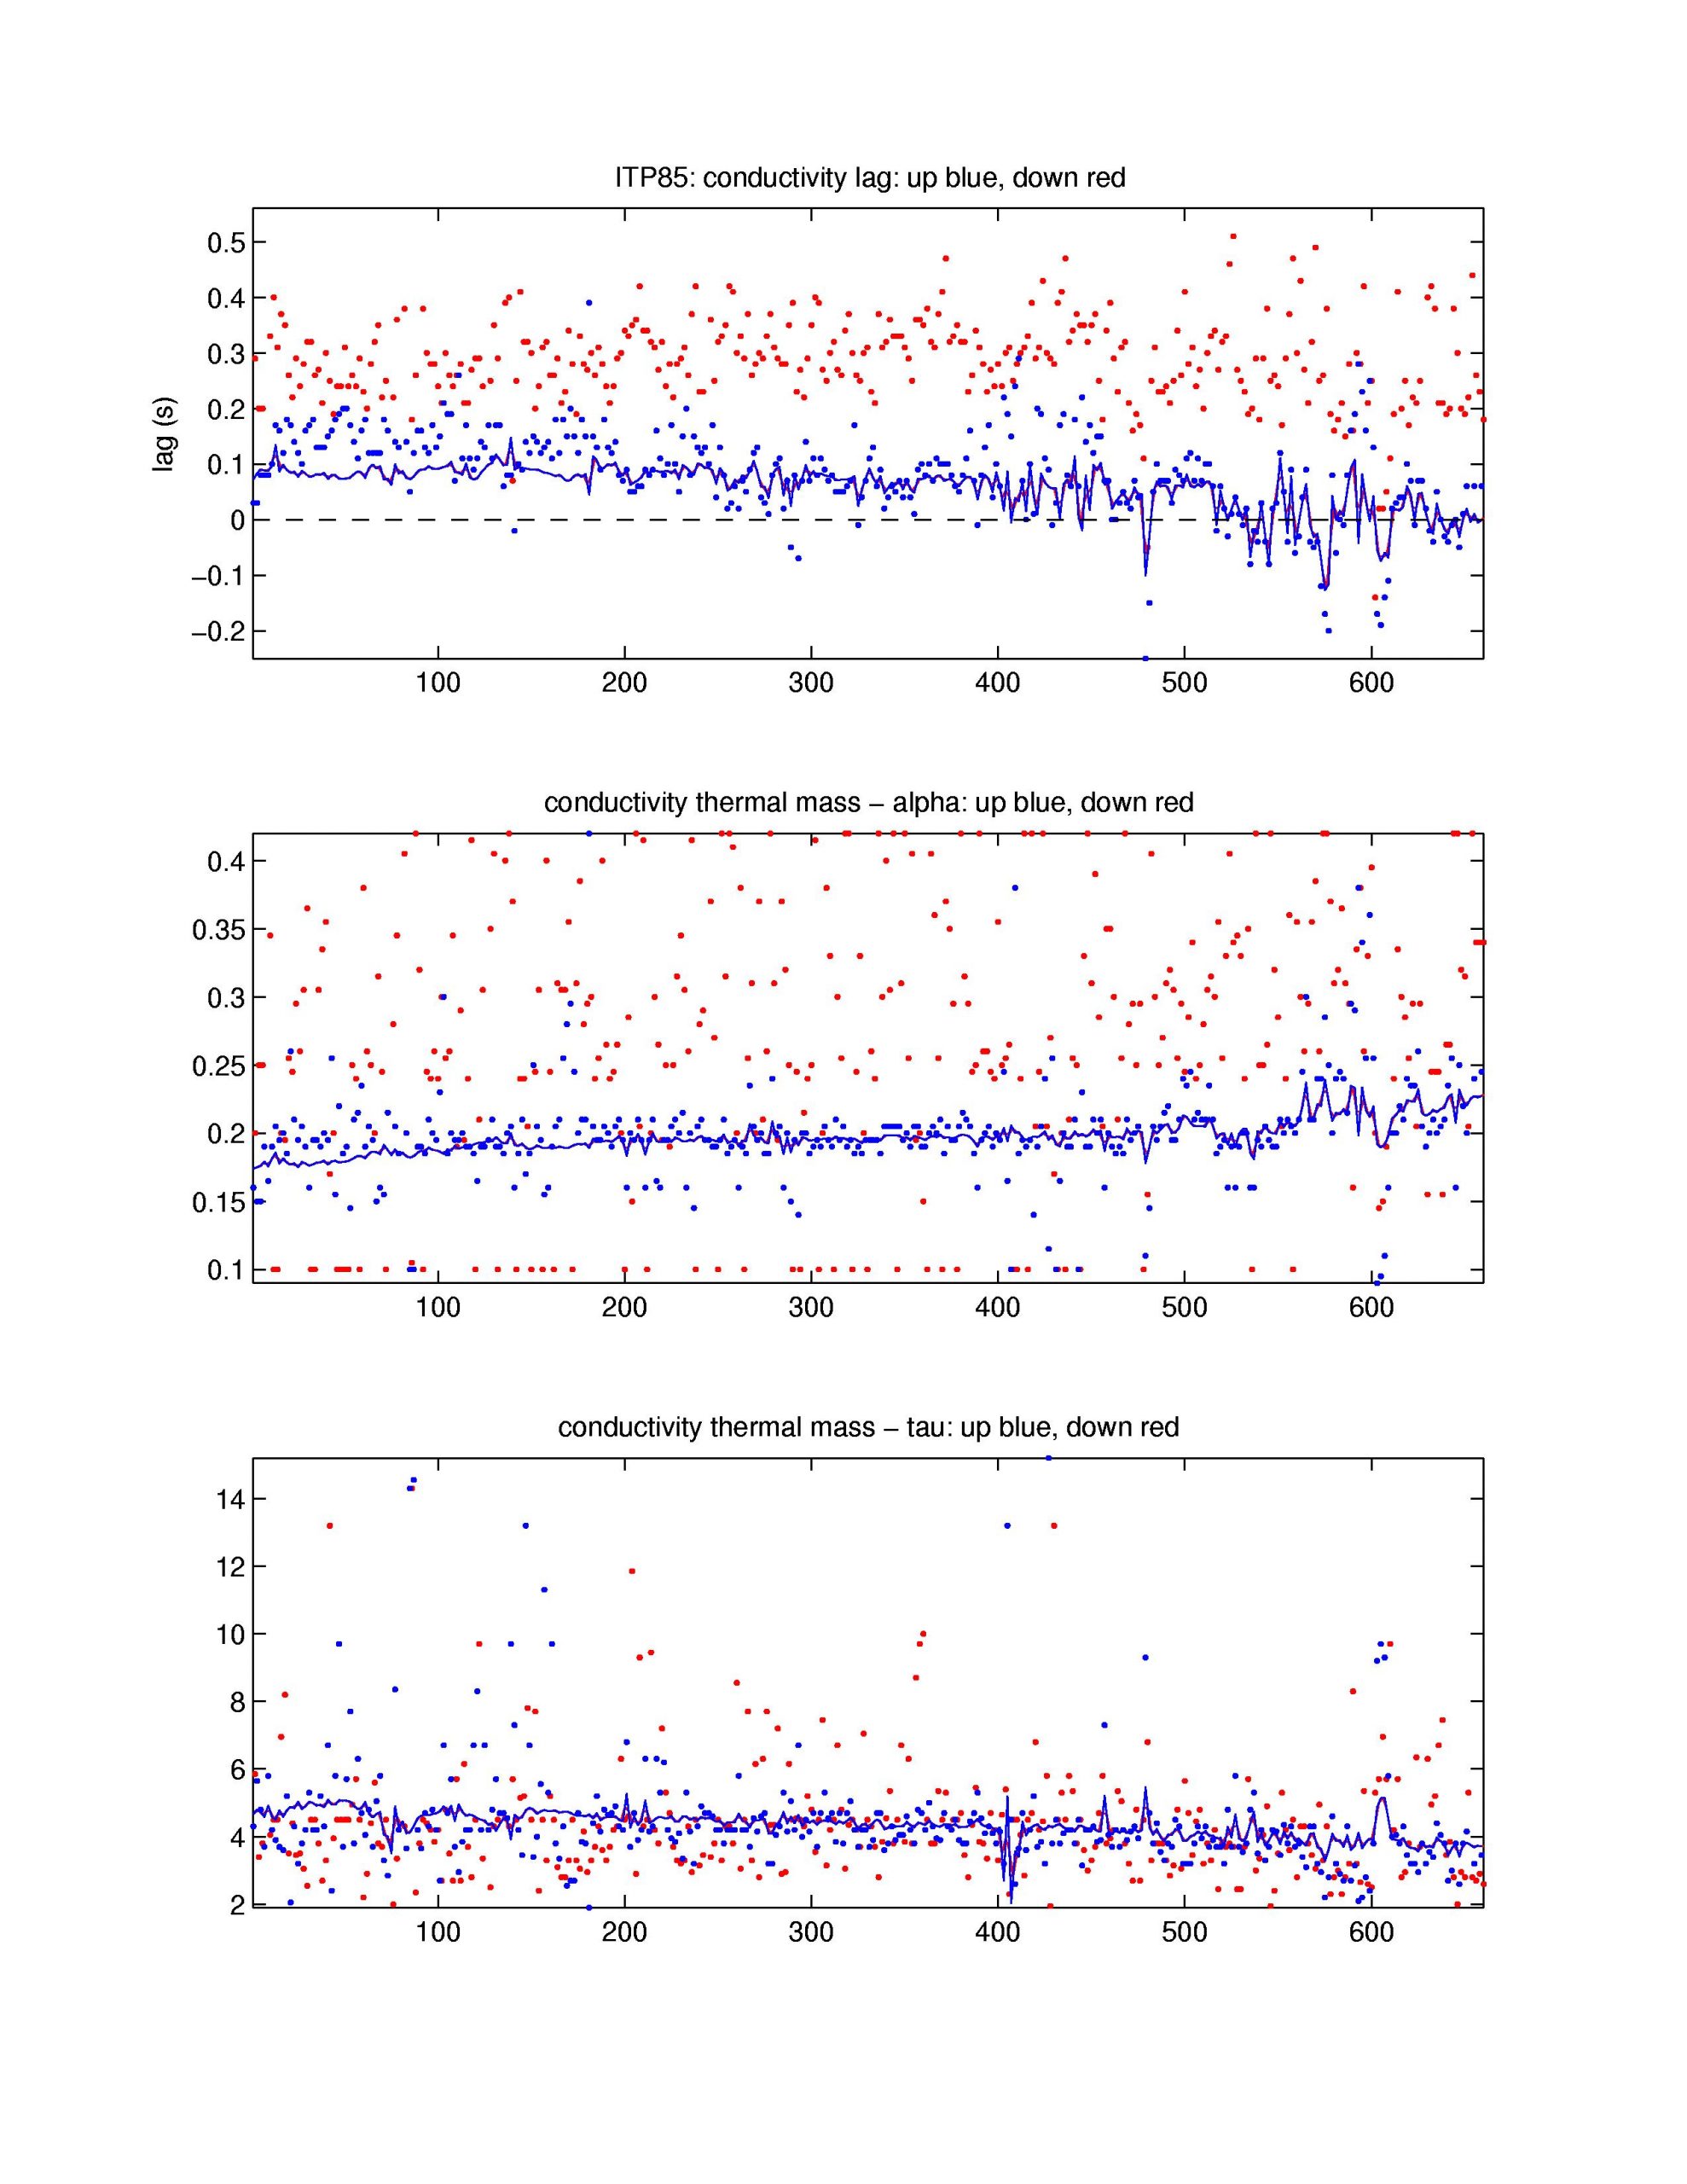
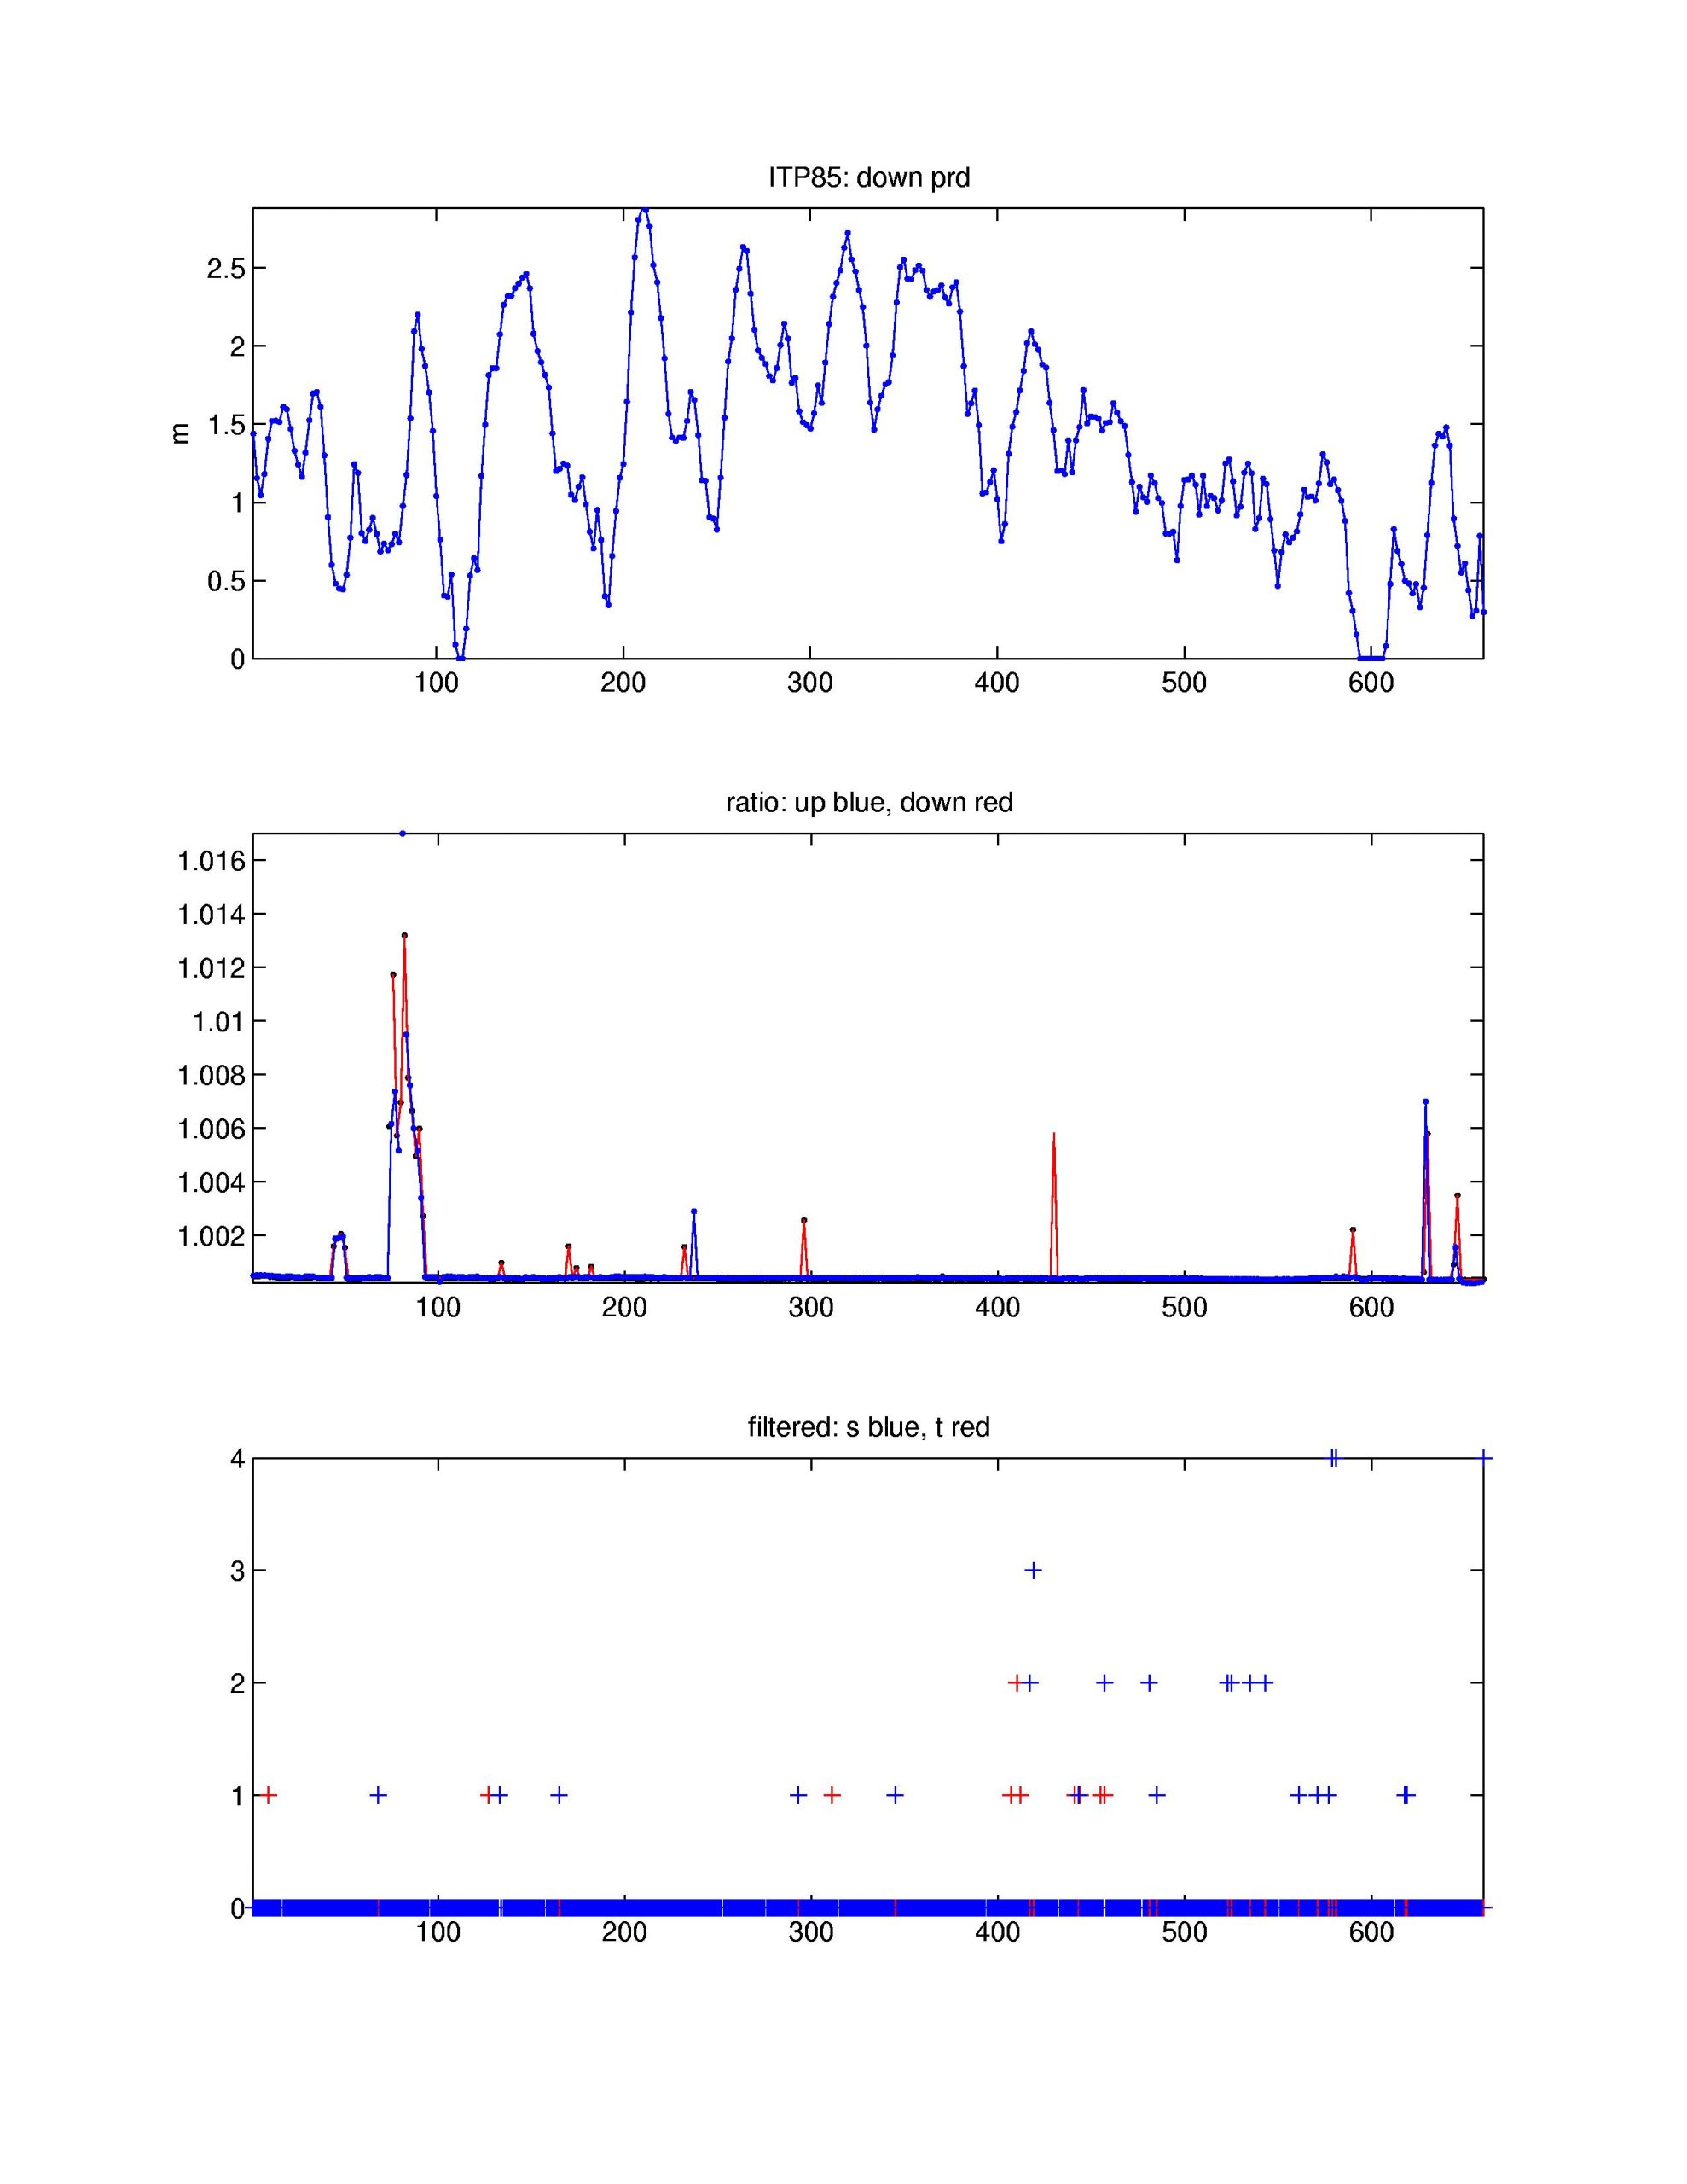
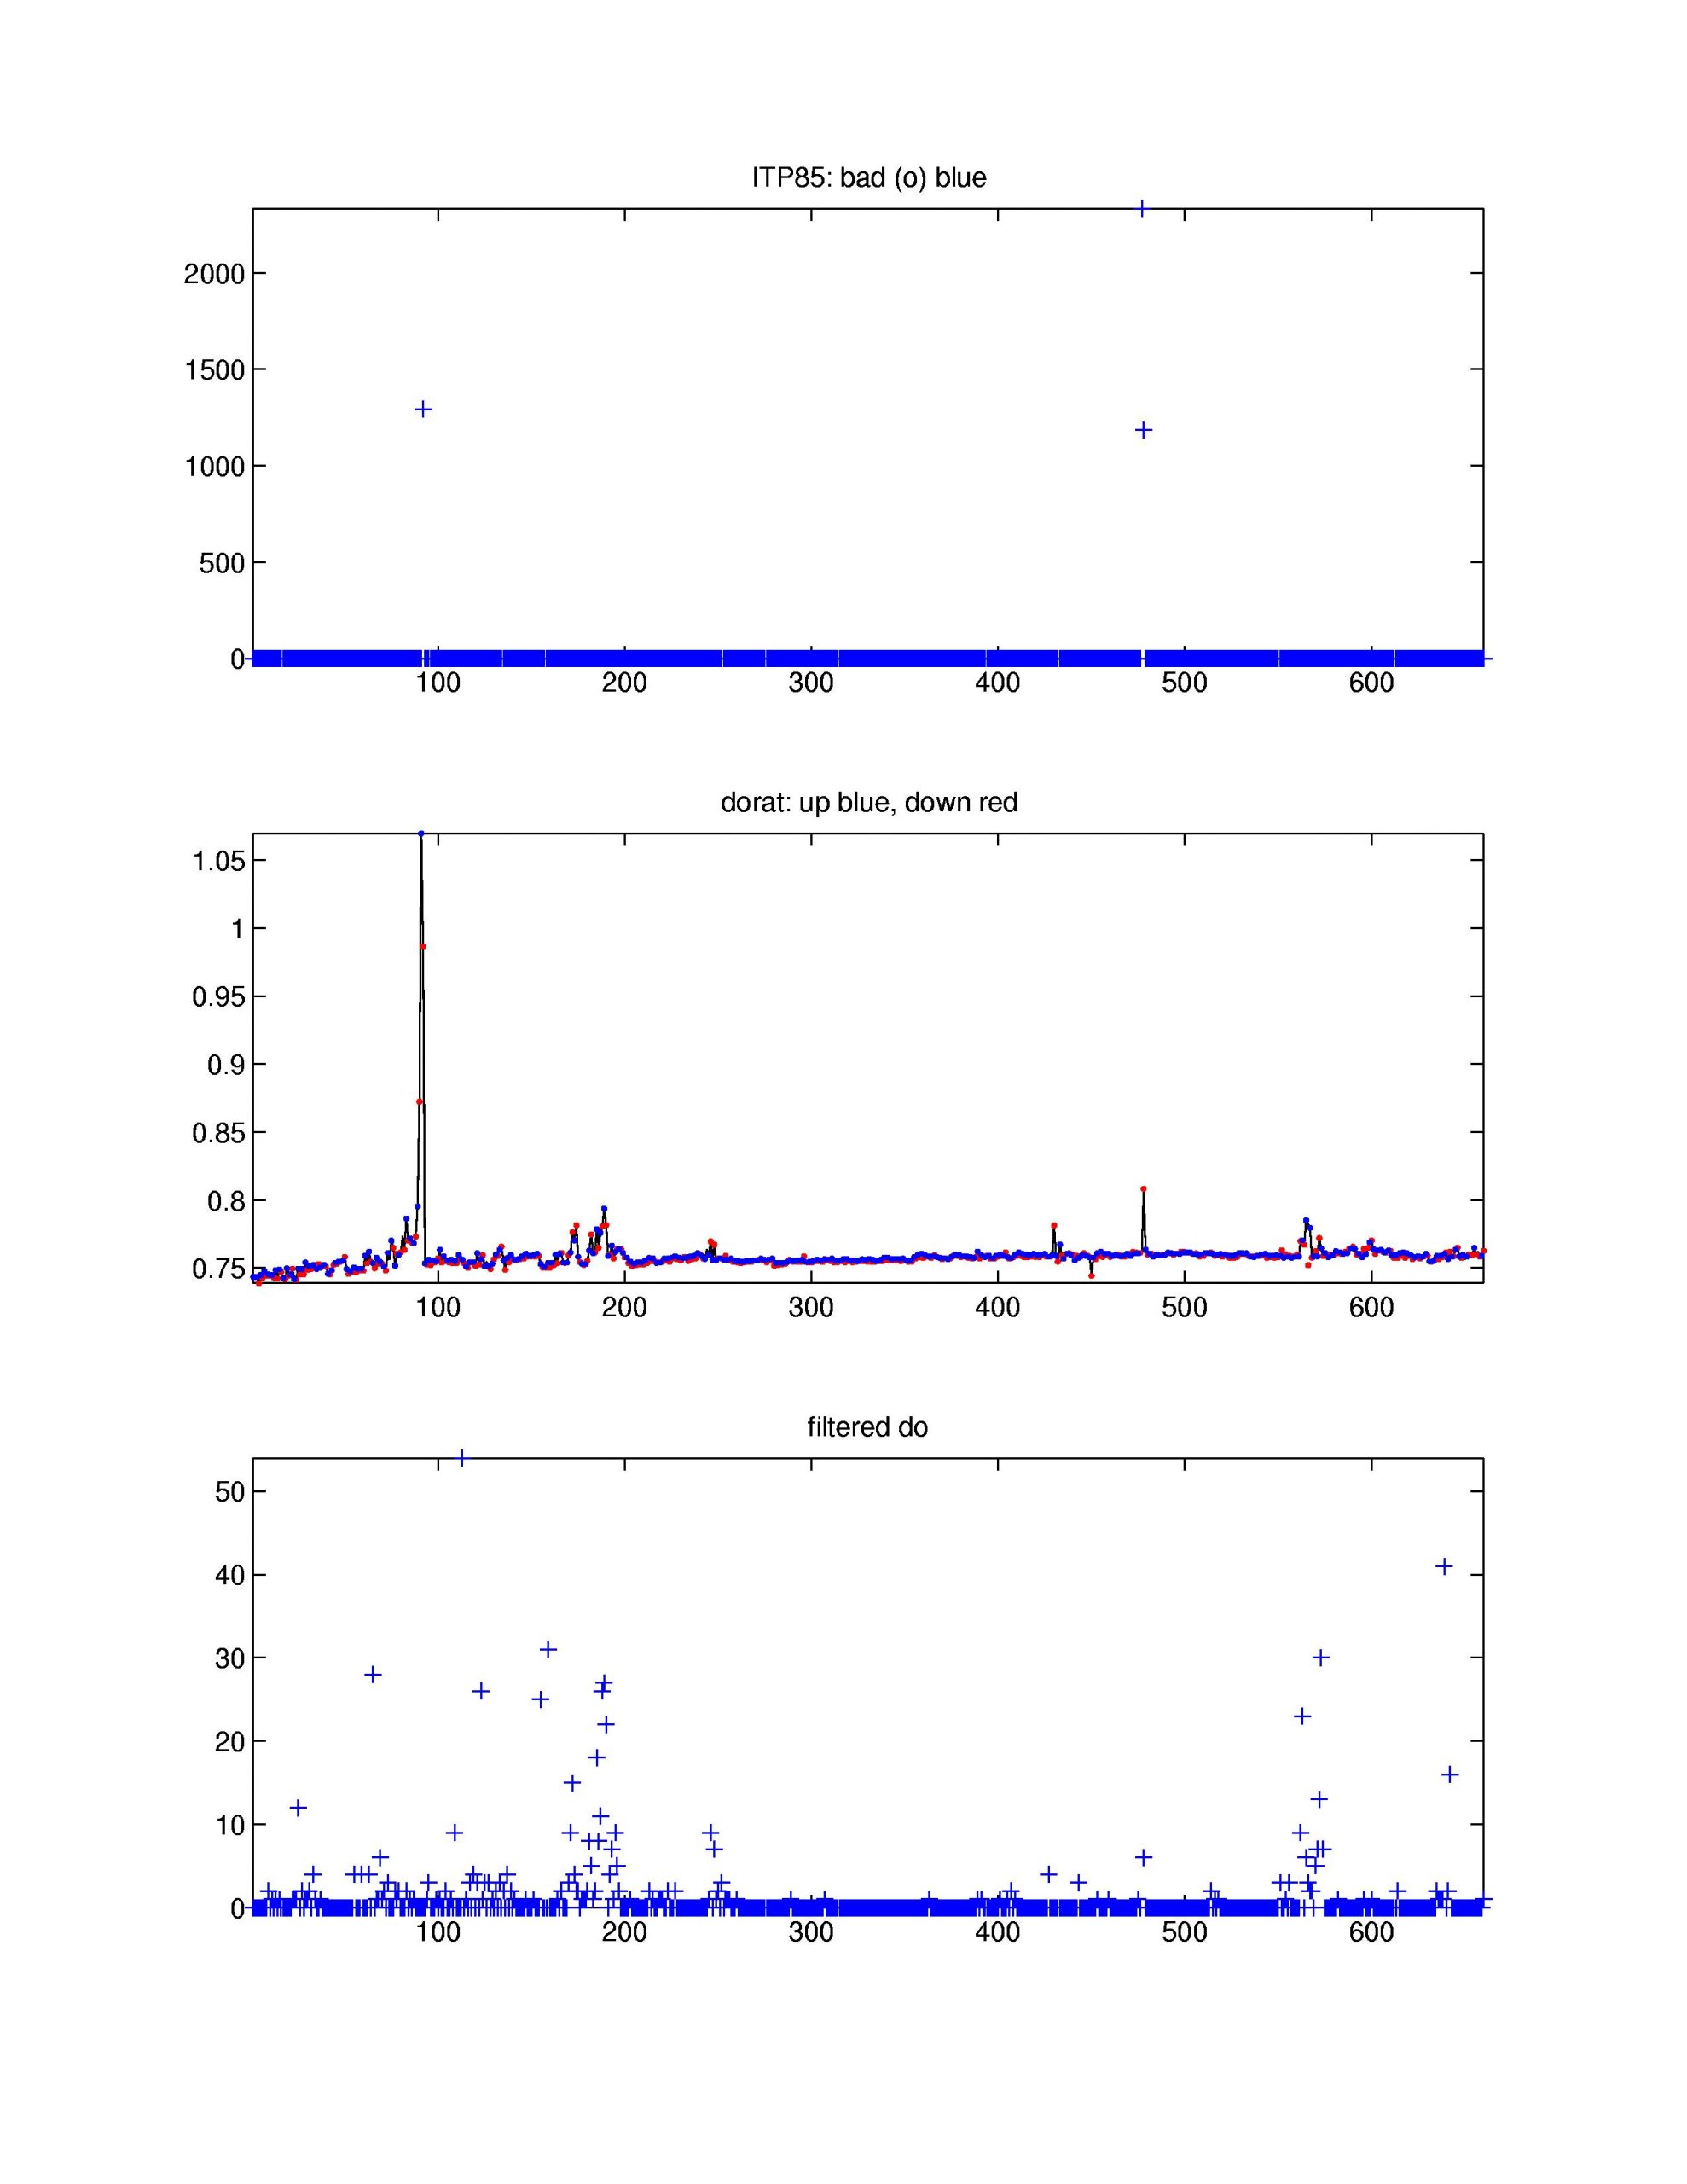
The 660 profiles that were transmitted from the ITP were processed according to the procedures described in the ITP Updated Data Processing Procedures. The processing parameters for the CTD and dissolved oxygen data are shown in the figures to the right. The SAMI data validation are described in Islam et al., (2017). The SAMI pH data were deemed to be bad in post processing.
See the Data Products tab to the left for descriptions of the three levels (I, II, III) of data processing and to access all data.
References:
Islam, F., M.D. DeGrandpre, C.M Beatty, M.-L. Timmermans, R.A. Krishfield, J.M Toole, and S.R. Laney, 2017. Sea surface pCO2 and O2 dynamics in the partially ice-covered Arctic Ocean. Journal of Geophysical Research, Vol. 122, doi:10.1002/2016JC012162.
